| Issue |
A&A
Volume 659, March 2022
|
|
|---|---|---|
| Article Number | A69 | |
| Number of page(s) | 23 | |
| Section | Interstellar and circumstellar matter | |
| DOI | https://doi.org/10.1051/0004-6361/202142863 | |
| Published online | 09 March 2022 | |
Successive deuteration in low-mass star-forming regions: The case of D2-methanol (CHD2OH) in IRAS 16293-2422★
1
Center for Space and Habitability, Universität Bern,
Gesellschaftsstrasse 6,
3012
Bern,
Switzerland
e-mail: This email address is being protected from spambots. You need JavaScript enabled to view it.
; This email address is being protected from spambots. You need JavaScript enabled to view it.
2
Institut des Sciences Moléculaires d’Orsay (ISMO), CNRS, Université Paris-Saclay,
91405
Orsay,
France
e-mail: This email address is being protected from spambots. You need JavaScript enabled to view it.
3
Laboratoire de Physique des Lasers, Atomes, et Molécules, UMR CNRS 8523, Université de Lille,
59655
Villeneuve d’Ascq Cedex,
France
4
Institut de Recherche en Astrophysique et Planétologie, Université de Toulouse, UPS-OMP, CNRS, CNES,
9 Av. du Colonel Roche,
31028
Toulouse Cedex 4,
France
5
Niels Bohr Institute, University of Copenhagen,
Øster Voldgade 5–7,
1350
Copenhagen K.,
Denmark
6
Laboratoire d’Etudes Spatiales et d’Instrumentation en Astrophysique (LESIA), Observatoire de Paris, Université PSL, CNRS, Sorbonne Université, Université de Paris,
5 place Jules Janssen,
92195
Meudon,
France
Received:
8
December
2021
Accepted:
17
January
2022
Abstract
Context. Di-deuterated molecules are observed in the earliest stages of star formation at abundances of a few percent relative to their nondeuterated isotopologs, which is unexpected considering the scarcity of deuterium in the interstellar medium. With sensitive observations leading to the detection of a steadily increasing number of di-deuterated species, it is becoming possible to explore successive deuteration chains.
Aims. The accurate quantification of the column density of di-deuterated methanol is a key piece of the puzzle that is missing in the otherwise thoroughly constrained family of D-bearing methanol in the deeply embedded low-mass protostellar system and astrochemical template source IRAS 16293-2422. A spectroscopic dataset for astrophysical purposes was built for CHD2OH and made publicly available to facilitate the accurate characterization of this species in astrochemical surveys.
Methods. The newly computed line list and partition function were used to search for CHD2OH toward IRAS 16293-2422 A and B in data from the Atacama Large Millimeter/submillimeter Array (ALMA) Protostellar Interferometric Line Survey (PILS). Only nonblended, optically thin lines of CHD2OH were used for the synthetic spectral fitting.
Results. The constructed spectroscopic database contains line frequencies and strengths for 7417 transitions in the 0–500 GHz frequency range. ALMA-PILS observations in the 329–363 GHz range were used to identify 105 unique, nonblended, optically thin line frequencies of CHD2OH for synthetic spectral fitting. The derived excitation temperatures and column densities yield high D/H ratios of CHD2OH in IRAS 16293-2422 A and B of 7.5 ± 1.1% and 7.7 ± 1.2%, respectively.
Conclusions. Deuteration in IRAS 16293-2422 is not higher than in other low-mass star-forming regions (L483, SVS13-A, NGC 1333-IRAS2A, -IRAS4A, and -IRAS4B). Di-deuterated molecules consistently have higher D/H ratios than their mono-deuterated counterparts in all low-mass protostars, which may be a natural consequence of H–D substitution reactions as seen in laboratory experiments. The Solar System’s natal cloud, as traced by comet 67P/Churyumov–Gerasimenko, may have had a lower initial abundance of D, been warmer than the cloud of IRAS 16293-2422, or been partially reprocessed. In combination with accurate spectroscopy, a careful spectral analysis, and the consideration of the underlying assumptions, successive deuteration is a robust window on the physicochemical provenance of star-forming systems.
Key words: astrochemistry / ISM: molecules / stars: protostars / stars: formation / ISM: individual objects: IRAS 16293-2422 / submillimeter: ISM
The constructed spectroscopic database for CHD2OH containing line frequencies and strengths for 7417 transitions in the 0–500 GHz frequency range are only available at the CDS via anonymous ftp to cdsarc.u-strasbg.fr (130.79.128.5) or via http://cdsarc.u-strasbg.fr/viz-bin/cat/J/A+A/659/A69
© ESO 2022
1 Introduction
Di-deuterated molecules are supposed to be scarce since hydrogen is much more abundant than deuterium in the interstellar medium (ISM). The elemental abundance of deuterium relative to hydrogen in the local (within ~ 1–2 kpc of the Sun) ISM has been derived to be at least (2.0 ± 0.1) × 10−5, including observed variations caused by the depletion of gas-phase deuterium onto dust grains (Prodanović et al. 2010). However, the inventory of species containing two deuterium atoms is steadily increasing: D2O (Butner et al. 2007), D2CO (Turner 1990), CHD2OH (Parise et al. 2002), CHD2OCHO (Manigand et al. 2019), CH3OCHD2 (Richard et al. 2021), CHD2CCH and CH2DCCD (Agúndez et al. 2021), NHD2 (Roueff et al. 2000), ND2 radical (Bacmann et al. 2020), CHD2CN (Calcutt et al. 2018), D2S (Vastel et al. 2003), D2CS (Marcelino et al. 2005), c-C3D2 (Spezzano et al. 2013), and D2H+ (Vastel et al. 2004). This inventory of D2-bearing molecules includes simple and complex organic species. Two tri-deuterated species have also been detected: ND3 (van der Tak et al. 2002)and CD3OH (Parise et al. 2004). Moreover, the abundances of multiply deuterated isotopologs are typically high, at a level of a few percent relative to the normal (i.e., nondeuterated) species (e.g., Caselli & Ceccarelli 2012; Ceccarelli et al. 2014).
The low (~10 K) temperatures of dense (> 104 cm−3) cores are thought to be the sole environments capable of boosting chemical pathways toward D-bearing molecules via gas-phase and solid-state reactions (Watson 1974; Tielens 1983; Dalgarno & Lepp 1984; Rodgers & Charnley 2002; Millar 2003; Caselli et al. 2019). Di-deuterated molecules have been detected in starless and prestellar cores (e.g., Roueff et al. 2000; Bacmann et al. 2003; Bergman et al. 2011), as well as in hot corinos of embedded low-mass protostars (e.g., Ceccarelli et al. 1998, 2001; Loinard et al. 2000) and hot cores of high-mass star-forming regions (e.g., Turner 1990; Zahorecz et al. 2017, 2021). It is thought that D-bearing molecules observed in protostellar regions have formed in the preceding cold prestellar phases and been preserved as ices until the later protostellar stage, when they undergo thermal desorption and become observable as gases (e.g., Cazaux et al. 2011; Aikawa et al. 2012; Taquet et al. 2012, 2013, 2014). Di-deuterated molecules have recently been detected in comets of our Solar System as well: D2O (Altwegg et al. 2017) and di-deuterated methanol (although the exact isotopolog could not be identified; Drozdovskaya et al. 2021).
IRAS 16293-2422 is a frequently studied, well-characterized nearby (141 pc; Dzib et al. 2018) low-mass protostellar system. An extensive description of the source is available in Jørgensen et al. (2016). It is thought to be a triple system of a single source B and a tight binary of A1 and A2. Source B is separated from the binary A by 5.3′′ (~ 747 au; van der Wiel et al. 2019). Sources A1 and A2 have a separation of just 0.38′′ (~ 54 au; Maureira et al. 2020). The proximity of IRAS 16293-2422 enables spatially resolved observations at a high sensitivity to be carried out, making it an optimal target for searches for minor chemical constituents. Early on, multiply deuterated species were detected toward this source in observations with the Institute for Radio Astronomy in the Millimeter Range (IRAM) 30 m telescope: D2CO (Ceccarelli et al. 1998), CHD2OH (Parise et al. 2002), and CD3OH (Parise et al. 2004). Now, with the Atacama Large Millimeter/submillimeter Array (ALMA) their precise spatial distribution within this triple system can be examined, thereby allowing accurate abundances to be determined in every individual physical component (circumbinary envelope vs. individual protostellar envelopes vs. central individual hot corinos) of the system. The ALMA Protostellar Interferometric Line Survey (ALMA-PILS) survey of this source also revealed new (previously undetected in the ISM) di-deuterated molecules: CHD2CN (Calcutt et al. 2018), CHD2OCHO (Manigand et al. 2019), and CH3OCHD2 (Richard et al. 2021).
Up to now, only single-dish estimates of the column density of CHD2OH in IRAS 16293-2422 had been available in the literature (Parise et al. 2002). Moreover, all interstellar detections of this molecule thus far have been based on spectroscopic data of low quality. In this paper, new accurate spectroscopic data (Sect. 2.2) were used to firmly quantify the availability of CHD2OH in IRAS 16293-2422 A and B (hereafter, I16293A and I16293B, respectively) on the basis of ALMA-PILS observations(Sect. 2.1). The catalog entry is also being made publicly available to enable accurate determination of di-deuterated methanol abundances in other sources. This work made use of newly developed Markov Chain Monte Carlo (MCMC) spectral fitting routines for the derivation of the column density and excitation temperature of a species (Sect. 2.3). With the accurate column density of CHD2OH in IRAS 16293-2422 on hand (Sect. 3), the deuteration chains of all multiply deuterated molecules were investigated. A comparison was performed to other low-mass star-forming systems, as well as laboratory experiments and cometary measurements (Sect. 4). The conclusions of this work are summarized in Sect. 5.
2 Methods
2.1 Observations
IRAS 16293-2422 was the target of the large unbiased Protostellar Interferometric Line Survey (PILS1 ; project-id: 2013.1.00278.S, PI: Jes K. Jørgensen) carried out with ALMA in Cycle 2 as presented in an extensive series of papers. These data cover the 329–363 GHz frequency range (ALMA Band 7) at a spatial resolution of ~ 0.5′′ (70 au; the applied uniform circular restoring beam). This allows for sources A and B to be studied individually; however, this is not enough to spatially separate A1 from A2. The observations are a combination of the 12 m array and the 7 m Atacama Compact Array (ACA), hence sampling extended structures up to ~ 13′′ (~ 2000 au; largest recoverable size). The data were obtained at a spectral resolution of 0.2 km s−1 (0.244 MHz) and reached a sensitivity of σ = 8–10 mJy beam−1 channel−1 (or 4–5 mJy beam−1 km s−1). For the typical line widths of ~1.0 and ~ 2.2 km s−1 toward favorable positions near sources B and A (with narrowest lines, least dust absorption, but yet still probing hot dense inner regions), respectively, this allowed the lines to be spectrally resolved by ~ 5–11 spectral bins. The observations did not yet reach the line confusion limit of this source at these frequencies. The full details about the data set and its reduction are available in Jørgensen et al. (2016).
2.2 Spectroscopy of CHD2OH
Di-deuterated methanol CHD2OH is a nonrigidspecies displaying a large amplitude internal rotation of its methyl group. For this reason, it displays a complicated microwave spectrum consisting of many lines with no easily recognizable features. Perturbations take place even for low values of the rotational quantum number K, which prevented the first investigators from accurately predicting transition frequencies. In this investigation, torsional states were identified using either the labeling scheme of Su & Quade (1989b) or the torsional quantum number vt. The one-to-one correspondence between both schemes is given in Table 1 of Ndao et al. (2016).
The first measurements of the microwave spectrum were reported by Su & Quade (1989a). Thanks to a then new theoretical approach (Quade 1967) aimed at accounting for the internal rotation of an asymmetrical methyl group and with the help of the double resonance technique, parallel a-type transitions within the three lowest-lying torsional states, e0, o1, and e1, could be assigned up to J = 2 and K =1, as well as ΔK = ±1 perpendicular transitions with J ≤ 9 and K ≤ 2 involving the same torsional states. Thanks to a modified version of the theoretical approach (Liu & Quade 1991b), new parallel and perpendicular transitions could later be assigned and fitted (Liu & Quade 1991a; Fu Su et al. 1991) up to J = 7, K = 2, and o3. The number of assigned transitions further increased thanks to Su et al. (1991) who were able to assign additional transitions within the first three torsional states, as well as perpendicular transitions within e2 and o2. Parallel transitions within the higher lying o3 and e3 were reported by Quade et al. (1998) and their assignments were confirmed with combination differences. An improved theoretical approach proposed by Ndao et al. (2016) led to more accurate rotation-torsion energy levels and allowed these authors to assign 3271 parallel and perpendicular transitions up to J = 40, with 3 ≤ K ≤ 9, within the three first torsional states. All transitions could be fitted using a phenomenological J(J + 1) expansion, which substantiated the assignments. It was also found that such an expansion fails for transitions with 0 ≤ K < 3 because the corresponding low-lying rotation-torsion energy levels are close together and perturbed. The theoretical approach (Ndao et al. 2016) was used to predict the subband center of many torsional subbands characterized by a value of the torsional quantum number vt as high as 11, which could be observed in the far infrared (FIR). The analysis of their rotational structure also substantiated the microwave transitions assignments. Independently and at the same time, I. Mukhopadhyay reported assignments for three sets of transitions. The first set (Mukhopadhyay 2016b) concerns parallel microwave and submillimeter wave transitions with 0 ≤ K ≤ 7 assigned for the first three torsional states up to J = 8. This first set also concerns 4 perpendicular subbands involving the same torsional states, with 3 ≤ K ≤ 6, assigned in submillimeter wave and FIR spectra. These perpendicular transitions were also reported by Ndao et al. (2016). The second (Mukhopadhyay 2016a) and third (Mukhopadhyay 2016c) sets consist of perpendicular transitions assigned in submillimeter wave and FIR spectra: within the ground e0 torsional state and up to K = 14 for the first set and between the first three torsional states and up to K = 13 for the third set. The torsional subbands with K ≤ 9 were also reported by Ndao et al. (2016). In a subsequent paper by Mukhopadhyay & Billinghurst (2021), additional FIR perpendicular subbands were reported for 3 ≤ K ≤ 7 and up to e5. Parallel and perpendicular microwave transitions were also reported for K = 3 and 4. Those involving the second and third torsional states were already reported in Ndao et al. (2016). The assignment of the perturbed transitions with 0 ≤ K < 3 within the three first torsional state was successfully carried out by Coudert et al. (2021) thanks to an improved version of the theoretical approach of Ndao et al. (2016). For the same torsional torsional states, new parallel and perpendicular transitions were assigned up to K = 12 and J = 40. The first global line position analysis, restricted to transitions with J ≤ 26, was also performed.
The results of the global line position analysis of Coudert et al. (2021) were used to build a spectroscopic database for CHD2OH. All rotation-torsion lines within and between the first three torsional states, 0 ≤ vt ≤ 2, were computed up to J = 26. Line strengths were evaluated taking a dipole moment function with two nonvanishing constant components along the x and z axes of the molecule-fixed axis system such that the xz plane remains parallel to the COH group. The values are μx = −1.37 and μz = 0.8956 D as reported by Amano (1981). The partition function Qrot-tors, which contains the rotational and torsional contributions, was calculated by taking a degeneracy factor equal to (2J + 1) and a zero energy for the lowest-lying rotation-torsion energy level, which is the J = 0, e0 level. It should be noted that the vibrational contribution to the partition function is negligible, because the vibrational modes are above 1000 cm−1. The values computed for temperatures ranging from 2.725 to 300 K are listed in Table 1. Rotation-torsion lines with a frequency below 500 GHz were selected and, as in the Jet Propulsion Laboratory (JPL) database catalog line files (Pickett et al. 1998), an intensity cutoff depending on the line frequency was taken. Its value in nm2 ⋅MHz units at 300 K is
 (1)
(1)
where F is the frequency in MHz, and LOGSTR0 and LOGSTR1 are two dimensionless constants both set to − 9. The line list is published as an electronic Table at the CDS. It is formatted in the same way as the catalog line files of the JPL database (Pickett et al. 1998) and displays 16 columns. Columns 1 to 3 contain, respectively, the line frequency (FREQ) in MHz, the error (ERR) in MHz, and the base-10 logarithm of the line intensity (LGINT) in nm2 ⋅MHz units at 300 K. Columns 4 to 6 give the degrees of freedom of the rotational partition function (DR), the lower state energy (ELO) in cm−1, and the upper state degeneracy (GUP), respectively. Columns 7 and 8 contain the species tag (TAG) and format number (QNFMT), respectively. Finally, columns 9 to 12 (13–16) give the assignment of the upper (lower) level in terms of the rotational quantum numbers J, K, p introduced by Coudert et al. (2021) and the torsionalquantum number vt. A minimum value of 10 kHz was selectedfor the calculated error (ERR). For observed nonblended microwave lines, the line frequency (FREQ) and the error (ERR) were replaced by their experimental values. This is then indicated by a negative species tag.
A comparison between the present spectroscopic database and a previously available line list is shown in Table 2. For the 184 parallel transitions given in table 2 of Mukhopadhyay (2016b), Table 2 of the present paper lists the 32 transitions with a frequency discrepancy larger than 0.5 MHz. These discrepancies are due to assignment errors and can be as large as 788 MHz. For instance, the parallel line at 333 159 MHz initially assigned as a K = 6, e0 line turned out to be a K = 7, o1 line. The assignments of the closely lying lines at 125 031 and 125 018 MHz need to be exchanged.
Partition function Qrot-tors of CHD2OH.
2.3 Spectral analysis
The primary focus of this publication is the one-beam offset position from source B in the SW direction (0.5′′ or 70 au away from the dust peak of B). This is the same position studied in nearly all other ALMA-PILS papers, thereby providing a unique coherent set of abundances for a large number of molecules. This position is favorable for spectral analysis as it displays narrow lines, which reduces blending, and probes the hot dense inner hot corino around source B, while avoiding self-absorption and strong dust absorption on source. Infall signatures have been observed toward source B, which suggests that infall timescales are short and that the hot corino contains freshly thermally desorbed ices (Schöier et al. 2002; Zapata et al. 2013). The chosen position likely experiences heating solely from the central protostar, because of its farness from the collimated outflows of IRAS 16293-2422 oriented in NW-SE direction and those less collimated in the E-W direction (Fig. 1 of van der Wiel et al. 2019). The coordinates of this position are RA, Dec (J2000) of 16h32m22.58s, −24d28′32.80′′.
Once this single position spectrum is extracted from the continuum-subtracted (based on the methodology described in Jørgensen et al. 2016) data cube, it is analyzed with custom-made Python scripts. A Doppler shift by vLSR = 2.7 km s−1 determined for this position is applied (Jørgensen et al. 2011). As a large number of molecules have already been quantified at this position, it is possible to construct a “reference spectrum”. This spectrum contains computed emission lines from all molecules detected with the ALMA-PILS survey at this position at their determined excitation temperatures (Tex) and column densities (N) with publicly available spectroscopy in either the Cologne Database of Molecular Spectroscopy (CDMS; Müller et al. 2001, 2005; Endres et al. 2016) or the JPL catalog (Pickett et al. 1998). The computation is performed under the local thermal equilibrium (LTE) approximation. In many instances, the reference spectrum overproduces the observed emission, which is a result of many observed lines being optically thick (Jørgensen et al. 2018) and requiring special treatment for proper synthetic fitting. Next, the observed spectrum is investigated at all covered rest frequencies of CHD2OH lines with the reference spectrum overlaid. In this way, all covered (detected and nondetected) lines of CHD2OH are investigated for potential blending with already-identified molecules in this source. This check for blending is done through visual inspection; and all lines that have any level of blending are removed from further synthetic spectrum fitting. Then, optically thick lines of CHD2OH are removed from further synthetic spectrum fitting. These are assumed to be lines that have τ > 0.1 either at Tex = 50 or 300 K at N = 1.3 × 1017 cm−2 (initial rough estimate of the column density of CHD2OH). There are in total 554 lines of CHD2OH covered in the observed ALMA-PILS frequency range, of which 525 have unique rest frequencies. After the removal of blended and optically thick lines, 105 unique line frequencies remain that are used for synthetic spectral fitting (this includes detected and nondetected lines). Out of 105 lines, 26 are predicted to have a peak intensity > 14 mJy beam−1 (and an integrated intensity ≳3σ) for the subsequently derived best-fitting Tex and N (Table 3)2. Nonblended nondetected lines are of course also constraining the synthetic spectral fitting.
Finally, synthetic spectral fitting for CHD2OH is carried out with a newly developed routine based on the MCMC Python package EMCEE (Foreman-Mackey et al. 2013)3. The code computes an LTE synthetic spectrum based on several input parameters. Several parameters are fixed: beam size of 0.5′′, source size of 0.5′′, and line full width half-maximum (FWHM) of 1 km s−1. The parameter space of Tex and N is explored by walkers that take a certain number of steps. Two runs of MCMC are executed. The first has 300 walkers for each parameter with each walker taking 250 steps, which are initiated at values distributed in a Gaussian around the medians of “sensible” Tex and N ranges, specifically: Tex∈ [50, 400] K and N ∈ [1013, 1018] cm−2 (the log-prior function is set to infinity outside of these ranges). The second has 300 walkers for each parameter with each taking 1000 steps, but now initiated in a small region around the best-fitting Tex and N of the first run. The best-fitting Tex and N of the second run are considered the final best-fitting model parameters to the data. In both runs, the first 10% of the steps are discarded as this corresponds to the burn-in phase of the computation (that this is sufficient is subsequently double checked with the autocorrelation times). Both runs are also thinned by 0.3% of the steps. The best-fitting values are considered the 50th percentiles of the samples in the marginalized distributions. The errors computed by the routine are considered to be the differences of the 50th percentile to the 16th and 84th percentiles (i.e., 1σ errors if the values have a Gaussian distribution centered on the mean). These errors are very small for well-converged runs and do not take all origins of uncertainty in observations into account (see a continuation of this discussion in Sect. 3.1). The walkers undertake the default “stretch moves” of EMCEE (Goodman & Weare 2010). The negative likelihood function being minimized is:
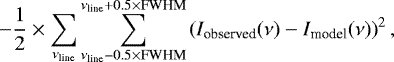 (2)
(2)
where the outer summation considers rest frequencies (νline) of all optically thin, nonblended (detected and nondetected) lines covered in the observed ALMA-PILS frequency range. The inner summation means that the model is computed and compared to observations around each line in a range of ± FWHM∕2 around its respective rest frequency. Equation (2) implies that all optically thin, nonblended (detected and nondetected) lines are being considered simultaneously. The output of the second MCMC run is checked for convergence and high values of acceptance ratios. For the second MCMC run of the CHD2OH computation, the mean acceptance fraction of the 300 walkers is 70% and the quality of the convergence is illustrated in the corner plot shown in Fig. A.1 for I16293B. For I16293A, the second MCMC run of the CHD2OH computation has the mean acceptance fraction of the 300 walkers also at 70% and the quality of the convergence is illustrated in the corner plot shown in Fig. A.2.
Fundamentally, MCMC is used to compare a model to data. It is inherently a sampler (Foreman-Mackey et al. 2013)4. Consequently, the fit is only as good as the postulated model that is thought to match the observed data. In the case of this paper, this is the LTE synthetic spectrum model. It is thought that this is a good approximation, because the densities are high and molecules are expected to be thermalized (Sect. 5.1 of Jørgensen et al. 2016). The code behind the LTE model is based on the formalisms used in Centre d’Analyse Scientifique de Spectres Instrumentaux et Synthétiques (CASSIS5; Vastel et al. 2015). The partition function is linearly interpolated in log-space between the values corresponding to the two temperatures closest to the Tex being computed. The code accounts for optical depth by considering the Sobolev or the large velocity gradient (LVG) approximation: Nup; op. thick = Nup; op. thin × β, where  (Sobolev 1960; Castor 1970; Elitzur 1992; as in RADEX6, pp. 42–44 of van der Tak et al. 2007). However, it does not properly account for flat-topped line profiles of optically thick lines, therefore being most-suitable for the analysis of optically thin lines. With both beam and source distributions being Gaussian, the dilution of the observed emission is accounted for by the beam-filling factor:
  (Drozdovskaya et al. 2018).
The secondary focus of this publication is a (slightly more than) one-beam offset position from source A in the NE direction (0.6′′ or 85 au away from the dust peak of A). This is the same position studied in all other ALMA-PILS papers that analyzed source A with coordinates RA, Dec (J2000) of 16h32m22.90s, −24d28′36.20′′ and vLSR = 0.8 km s−1. The same spectral analysis methodology is applied to this position as for the offset from source B position. This excludes the same lines based on blending and optical thickness grounds and uses the same 105 unique line frequencies for synthetic spectral fitting. All other input parameters are kept the same; only FWHM is changed to 2.2 km s−1 as deduced from previous analysis of this position (Manigand et al. 2020).
3 Results
3.1 Line profiles
A selection of some of the strongest 15 lines of CHD2OH out of the 105 used for synthetic spectral fitting is shown in Fig. 1 for source B (and in Fig. A.6 for source A). Since these have already been filtered for blended and optically thick lines (Sect. 2.3), all the shown lines are not blending with any of the known molecules of I16293B (there may still be blending with unknown species) and are also mostly optically thin (τ < 0.1 cut-off holds for the initially guessed N = 1.3 × 1017 cm−2 and Tex = 50 and 300 K; Sect. 2.3). The best-fitting synthetic spectrum is shown in pink in Fig. 1 and corresponds to Tex = 90.0 ± 9 K and N = (1.78 ± 0.36) × 1017 cm−2. The errors that are derived during the MCMC computation are very small, because they are measuring the goodness of fit of the assumed model to the data. However, the model assumptions (e.g., LTE with a single Tex) have much higher uncertainties and so do the data themselves (calibration uncertainty of 5%). These uncertainties are not taken into account in the MCMC computation. It is hard to quantify the exact uncertainty on the parameters, consequently, pessimistic errors of 10% and 20% on Tex and N, respectively, are adopted in order to ensure that the uncertainties are not underestimated (Jørgensen et al. 2018). The observed spectrum contains much stronger lines of CHD2OH, which have been excluded from fitting due to their high τ values. Another selection of some of the strongest 15 lines of CHD2OH observed (all optically thick) is shown in Fig. A.3. Figures 1 and A.3 support the clear detection of CHD2OH toward I16293B with consistent narrow (~ 1 km s−1) lines and demonstrate the quality of the synthetic spectral fitting.
The excitation temperature for IRAS16293B deduced by the MCMC fitting is lower than the ≈300 K previously inferred for CH OH (Jørgensen et al. 2016)and CH3OD (Jørgensen et al. 2018). For example, rotational diagram fits to the CH3OD transitions showed a best-fitting 321 ± 31 K and could not support a lower excitation temperature of 125 K (Fig. 1 of Jørgensen et al. 2018). To investigate this further, MCMC models for fixed temperatures of 150 and 300 K were ran while varying the column density. The results of these models are shown in Figs. A.4 and A.5 in Appendix A for the 15 strongest lines (included in the synthetic spectral fitting) and for a set of 15 high excitation transitions, respectively. While the former do not show significant differences for the different excitation temperatures, the latter do: a couple of high excitation transitions (Eup ≈ 500–700 K) are predicted at the 50–100 mJy beam−1 level, but are not seen in the observed spectra. With the lower temperature of the 90 K model, less emission is seen for those lines; although, there are still examples of over-predicted emission for some. In the end, this set of lines drives the best-fitting Tex to the lower values: whether this is reflecting actual differences between the methanol isotopologs or rather uncertainties in the spectroscopy for these transitions remains unclear. No matter, the different MCMC models allow us to quantify the uncertainties on N as a result of changing Tex. For the Tex= 300 K model the best-fitting column density is N = (6.62 ± 1.32) × 1016 cm−2, while for the Tex = 150 K model the best-fitting column density is N = (1.07 ± 0.21) × 1017 cm−2 from the MCMC computation. Consequently, the lower N values for higher Tex result in lower D/H ratios derived for CHD2OH (by at most a factor of 1.6); however, the conclusions of this paper are not changed even when considering this hypothetical broader range of D/H ratios (Table 3). The excitation temperature for IRAS16293A deduced by the MCMC fitting is consistent with previously published values for this source (Calcutt et al. 2018; Manigand et al. 2020).
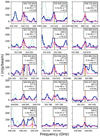 |
Fig. 1 Selection of some of the strongest 15 lines of CHD2OH out of the 105 used for synthetic spectral fitting. The observed spectrum is in dark blue, the reference spectrum is in turquoise, and the best-fitting synthetic spectrum is in pink. The rest frequency, Eup (K), Aij (s−1), and optical depth (for the best-fitting parameters) are shown in the right corner of each panel. The rest frequency is indicated with a vertical dashed line, and the filled yellow region corresponds to the uncertainty on that line frequency. The lines at 353.934, 353.983, 355.788, and 359.948 GHz are in fact overlapping double transitions. |
3.2 Integrated intensity maps
The spectral line richness of IRAS 16293-2422 complicates the creation of moment 0 maps. When an integration across a wide velocity range is performed (in order to encompass all the emission in the line of interest), it becomes increasingly easy to also erroneously integrate over emission from some adjacent line of another molecule. This is particularly exacerbated near source A, as it has much broader lines than source B: FWHMA ≈ 2.2 km s−1, which is a factor of 2 higher than FWHMB ≈ 1 km s−1 at the most favorable position near source A in terms of line width (some positions near source A can reach FWHMs of ~ 5 km s−1). This means that for IRAS 16293-2422, meaningful moment 0 maps can only be created for very few, highly isolated lines. The (nearly) optically thin 348.710 GHz line of CHD2OH is highly promising in this regard (the line profile toward the one-beam offset position is shown in Fig. 1: top row, right column). For the best-fitting parameters of the one-beam offset position from B, this line has τ = 0.18. Figure 2a shows the integrated intensity map of this line. Around source A it is still hard to compute an accurate integrated intensity and therefore, the shown map should be interpreted with caution (see Appendix B). Here, the integration is performed over 25 spectral bins, corresponding to a ~ 5 km s−1 range, which is mostly sufficient to encompass the entire line profile near both sources. The rest frequency of the line is characterized well with a single value only in the vicinity of source B. Around source A, a steep velocity gradient exists (Pineda et al. 2012; Maureira et al. 2020). Consequently, the rest frequency of this line in every pixel is found by first determining the rest frequency of the bright methanol transition at 337.519 GHz, thereby determining a velocity map of IRAS 16293-2422 (Fig. 4 of Calcutt et al. 2018). This method was developed by Calcutt et al. (2018) and produces so-called Velocity-corrected INtegrated emission (VINE) maps.
Figure 2a illustrates that CHD2OH emission is compact toward A and B, but that a more detailed analysis of the spatial distribution would require data of higher spatial resolution (beam size <0.5′′). Figure 2b shows the integrated intensity map of the optically thick 334.056 GHz line of CHD2OH. The line profile toward the one-beam offset position is shown in Fig. A.3 (bottom row, right column). The peak integrated intensity in this map is roughly an order of magnitude higher than in Fig. 2a, as this is a much brighter line of CHD2OH. For the best-fitting parameters of the one-beam offset position from B, this line has τ = 7.91 and the combined effects of line optical depth and on-source dust optical depth are clearly visible in Fig. 2b in the form of an emission ring around source B. Both Figs. 2a and b show an asymmetry near source B, which is seen for most molecules in the hot corino. The origin of this asymmetry remains to be conclusively unraveled (e.g., Zamponi et al. 2021).
Best-fitting column densities, excitation temperatures, and D/H ratios (with statistical correction) of CHD2OH toward IRAS 16293-2422 B and A.
4 Discussion
4.1 Deuteration in IRAS 16293-2422
A large number of molecules have been detected in IRAS 16293-2422, including many deuterated species (appendix C of Drozdovskaya et al. 2019). Figure 3 shows the D/H ratio as measured in all the D-bearing molecules detected in the hot corino of I16293B, including the respective statistical corrections (Appendix C). All the data points (except for water and ammonia) of I16293B stem from the ALMA-PILS survey as determined at the same one-beam offset position in all the respective publications. The plotted HDO/H2O ratio is an estimate on disk-scales toward source A (Persson et al. 2013). The D2O/H2O ratio is an estimate on scales of the circumbinary envelope encompassing sources A and B together (Coutens et al. 2013b). The plotted NH2D/NH3 ratio is a circumbinary estimate (van Dishoeck et al. 1995). Upper limits determined for D2CS (Drozdovskaya et al. 2018), CH3SD (Zakharenko et al. 2019), CD2CO (Jørgensen et al. 2018), HDC18O (Persson et al. 2018), and the two mono-deuterated isotopologs of propyne (Calcutt et al. 2019; although, Caux et al. 2011 did secure a detection of CH2DCCH as part of “The IRAS 16293-2422 Millimeter And Submillimeter Spectral Survey”, TIMASSS, most likely from the circumbinary envelope) are also depicted for completeness.
In Fig. 3, the error bars on all the values of I16293B are a result of the 20% error on each N, which gives an error of 30% on the ratioof two column densities, and a result of statistical error propagation based on the respective statistical corrections. The hot corino D/H ratios of all available molecules (including error bars) lie in the 5.5 × 10⁻³–1.6 × 10⁻¹ range (excluding estimated ratios of water and ammonia, and upper limits). No apparent trend of the D/H ratio with functional group is seen, as was already realized by Jørgensen et al. (2018). Figure 3 includes molecules with deuteration in the hydroxyl group (HDO, D2O, CH3OD, HCOOD, a-CH3CH2OD), the aldehyde group (CH2(OD)CHO), the amino group (NH2D, cis- and trans-HC(O)NHD, HCNCN, DNCO), the thiol group (HDS, HD34S), and all others in the methylene (CH2−) or methyl (CH3−) groups. No apparent trend is seen for different families of molecules either, that is CHO-, N-, S-bearing, when considering all D-bearing molecules. A tentative trend is seen when considering solely mono-deuterated species: D/H ratios seem to be lower for N-bearing molecules and O-bearing species that contain less than 6 atoms in comparison to S-bearing molecules and O-bearing species with more than 6 atoms. D/H ratios lower by a factor of 2–4 were previously deduced for small O-bearing molecules than those for large O-bearing species (Jørgensen et al. 2018). This may be related to the differences in formation timescales of small and large molecules as proposed in Coutens et al. (2020). Mono- and di-deuterated molecules of I16293B are shown separately in Figs. A.8 and A.9.
What does persist is the trend of di-deuterated species having a higher D/H ratio than their mono-deuterated counterparts. The fractionation levels of mono-deuterated formaldehyde, methanol, methyl formate, dimethyl ether, and methyl cyanide are:

Above, the sym- and asym- variants of mono- and di-deuterated dimethyl ether have been summed (as in Richard et al. 2021). Within error bars, all five values agree, implying the same level of deuteration in all di-deuterated species relative to their mono-deuterated variants. The numbers suggest that roughly one in every four mono-deuterated molecules of the aforementioned molecules will undergo a second deuteration. However, di-deuterated molecular D/H ratios are only six values out of 36 (excluding HDO, D2O, NH2D, and upper limits). Di-deuterated molecular D/H ratios span 10–33% with a mean of 20.7± 6.2%. The D2O/HDO ratio is estimated at 0.004 and 0.063 for the hot corino and outer envelope, respectively, which would correspond to a  of 0.8% and 12.6%, respectively (Coutens et al. 2013b). Consequently, D2O may be associated with a factor of ~2 lower D/H ratio in comparison to other di-deuterated molecules, at least on the large circumbinary scales of those data.
Even within such a consistent spectral analysis as was carried out based on ALMA-PILS, a certain degree of ambiguity remains when it comes to determining column densities of some of the main isotopologs. These can be derived from their minor carbon or oxygen isotopologs and an assumed local ISM 12C/13C or 16O/18O ratio, or based on a vibrationally excited state, or from the analysis of optically thin lines alone of the main isotopologs themselves. In Jørgensen et al. (2016, 2018), it was already suspected that some species may be associated with a lower 12C/13C ratio than the canonical ISM value. If the applied 12C/13C ratio is too high, then the D/H ratios shown in Fig. 3 would be higher for the species in question. A key species to constrain the column density of would be HD13CO, as it would allow the determination of  . This would test whether the level of deuteration is independent of the 12C/13C ratio. The lines of HD13CO covered in the frequency range of the ALMA-PILS were too weak for detection (Persson et al. 2018). More deuterated species have been detected toward I16293B than those displayed in Fig. 3. All the omitted species are thought to trace the large-scale circumbinary envelope or even the larger surrounding cloud (Appendix D). The D/H ratios measured in I16293A are very similar to those in I16293B on a molecule by molecule basis, as already reported in Manigand et al. (2020). This high degree of agreement (Fig. A.7) supports the key role of the birth cloud in setting the chemical composition of the material in the protostellar systems that form therein.
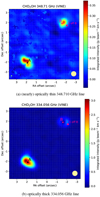 |
Fig. 2 Integrated intensity maps of CHD2OH (moment 0 maps). The binary sources A and B are labeled, as well as the one-beam offset position in the SW direction from sourceB that is central to this work. The origin of the axes corresponds to RA, Dec (J2000) of 16h32m22.72s, −24d28′34.3′′. The 0.5′′ beam size isindicated in the bottom right by a yellow circle. |
4.2 Comparison to other low-mass protostars with CHD2 OH detections
CHD2OH was detected for the first time by Parise et al. (2002) with the IRAM 30 m single-dish telescope in IRAS 16293-2422. Due to the low spatial resolution of the data, it was not possible to disentangle the emitting components. The ALMA-PILS data analyzed in this work are now clearly showing that both sources A and B are emitting in CHD2OH from within their respective hot corino regions; unfortunately, A1 and A2 cannot be separated at the present spatial resolution. This molecule has also been detected in the low-mass Class I SVS13-A system (Bianchi et al. 2017), in the cold envelope of the Class 0 L483 source (Agúndez et al. 2019), and in the hot corinos of NGC 1333-IRAS2A, -IRAS4A, and -IRAS4B (Parise et al. 2006; Taquet et al. 2019). The uncertainties on CHD2OH column densities may be elevated in comparison to that derived in this work in IRAS 16293-2422 due to the significant uncertainties in the past nonpublic CHD2OH spectroscopy and poor rigid-rotor assumptions for its partition function (Sect. 2.2). For example, for IRAS 16293-2422 Parise et al. (2002) reported CHD2OH/CH3OH = 0.2 ± 0.1; however, based on the values in Table 3 this ratio is 1.78± 0.5 × 10⁻² and 1.71± 0.6 × 10⁻² for source B and A, respectively. The large one order of magnitude discrepancy is likely due to less accurate old spectroscopy and underestimates of the CH3OH column density stemming from its optically thick lines. It would be fruitful to revisit the CHD2OH analysis in these others five sources as is being done in this work for IRAS 16293-2422. Figure 3 includes deuterated molecules that are common to I16293B and any of these other five sources.
Details of past observations of other low-mass protostellar regions that are being compared to I16293 are presented in Appendix A. Several aspects of concern must be acknowledged when carrying out such comparisons with observational campaigns stemming from other facilities and based on different assumptions. These include scarcity of analyzed lines (notably of CHD2OH) down to a level of just 1–2 lines, assumed isotopic ratios (12C/13C), and different treatments of potentially optically thick lines of the main isotopologs. The cumulative uncertainties arising from these aspects are likely partially responsible for the scatter in the D/H ratios in Fig. 3 between sources. However, Fig. 3 does not yield enough evidence to support I16293B being abnormally deuterium-rich among low-mass protostars. Systematic differences in the D/H ratios of several molecules are not seen when comparing it to L483, SVS13-A, NGC 1333-IRAS2A, -IRAS4A, and -IRAS4B. Neither are any concrete differences seen across these early evolutionary stages, when comparing these six Class 0 and I sources. I16293B does have a much larger number of D-bearing molecule detections in comparison to other low-mass protostars. Likely, this is an observational bias owing to the small distance to this source, its optimal positioning in the sky resulting in narrow line widths, more thorough and frequent studies of the source by many observational projects and spectral surveys. By now, IRAS 16293-2422 has been studied with an exceptionally wide spectral coverage, which increases the chances of detecting many lines from numerous molecules.
For the limited detections of di-deuterated molecules in these other sources, the trend of D/H ratios of di-deuterated molecules relative to their mono-deuterated counterparts being higher than the D/H ratios of mono-deuterated isotopologs relative to the nondeuterated species appears to persist (Fig. 3). L483 and NGC 1333-IRAS4B are the only nonbinary protostars considered in this comparison (Appendix A). The binarity of the other sources is only spatially resolved for the case of I16293A and I16293B. The D/H ratios of D-bearing molecules do not show any trends with the degree of multiplicity or separation in binaries within this small set of sources. There appears to be a difference in deuterium fractionation between low- and high-mass star-forming regions (Jørgensen et al. 2020), in particular when it comes to deuteration of methanol (Taquet et al. 2019) or later stages of high-mass protostellar evolution (Zahorecz et al. 2021). The study of di-deuterated molecules should be expanded to high-mass sources in future work.
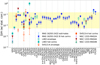 |
Fig. 3 D/H ratio as measured in all the D-bearing molecules detected in the hot corino of IRAS 16293-2422 B, including the respective statistical corrections (Appendix C). Available D/H ratios measured in other low-mass star-formingsystems are also shown, see the main text for details. |
4.3 Comparison to experimental data
Figure 4 shows the D/H ratio of formaldehyde and methanol in the hot corino of I16293B in comparison to the experimental results of Nagaoka et al. (2005, 2007), and Hidaka et al. (2009). The results stemfrom an extensive series of experiments performed on amorphous solid water (ASW) at 10–20 K (the experimental values stem from N. Watanabe priv. comm.; this can be considered an update of Fig. 5 of Nagaoka et al. 2006). During the experiments, cold H and D atoms are deposited (separately or simultaneously) onto either solid CO or formaldehyde ice (H2CO or D2CO) with a thickness of ~nm with ASW underneath (at least for the experiments with formaldehyde). Different combinations of reactants were explored in the series of experiments to accurately pin down the chemical network at hand. Sample composition is monitored with reflection-absorption spectroscopy directly in the solid phase. Under laboratory conditions, the D/H ratios of multiply deuterated isotopologs are higher than those of mono-deuterated molecules as observed toward I16293B. Consequently, this observational trend cannot be attributed to multiply deuterated molecules forming under conditions with more D atoms, because the experimental D/H flux is constant. Rather, it seems that this is a natural consequence of H-D substitution reactions on grain-surfaces at cold temperatures. Successive hydrogen abstractionsseem to be more likely once the first deuteration of a molecule has occurred. D/H ratios of HDCO and CH2DOH match between observations and experiments even though the experimental D/H flux of 0.1 is much higher than ~105 that is available in the ISM. The D/H ratios of multiply deuterated species (D2CO, CHD2OH, and CD3OH) are higher than the observed values, which could be a sign of an over-availability of D atoms for the synthesis of multiply deuterated isotopologs in the experiments (i.e., too frequent H-D substitution reactions). Conversely, observational lower D/H ratios of multiply deuterated isotopologs could stem from the negative catalytic effect of solid water. Oba et al. (2016) experimentally verified this trend for the case of dimethyl ether and attributed it to the formation of an H-bond between the hydrogen atom of water and the oxygen atom of dimethyl ether, which strengthens the C–H bond in the dimethyl ether-water complex. However, this trend likely would have an equal effect on mono- and multiply deuterated isotopologs of O-bearing molecules. It would be interesting to experimentally test lower D/H fluxes and compare them to the observed values of I16293B to see if D/H ratios of mono-deuterated molecules will still be as high and if D/H ratios of multiply deuterated species would be lower. The presented comparison relies on the assumption that the observed gases toward I16293B are representative of freshly thermally desorbed ices (Sect. 2.3), which predominantly originate from the innate prestellar core that birthed the IRAS 16293-2422 system. The experimental conditions may be more representative of the prestellar core stage with a higher availability of D. However, this still does not explain the discrepancy in experimental and observed D/H ratios of multiply deuterated species, as multiply deuterated and mono-deuterated complex organics (unlike water; Furuya et al. 2016) are expected to form simultaneously.
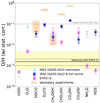 |
Fig. 4 D/H ratio as measured in the hot corino of IRAS 16293-2422 B, in the volatiles and dust of comet 67P/Churyumov–Gerasimenko, and in laboratory experiments. The respective statistical corrections (Appendix C) are accounted for in all data points. The dashed gray line is the experimental D/H input flux. The solid black line is the mean value of the refractory carbonaceous component with black dashed lines indicating the errors on this mean and the yellow region indicating the full range of values covered by the individual 25 particle measurements. See the main text for details and references. |
4.4 Comparison to cometary measurements
Figure 4 also includes the seven D-bearing molecules measured with the Rosetta Orbiter Spectrometer for Ion and Neutral Analysis (ROSINA; Balsiger et al. 2007) instrument aboard the ESA Rosetta spacecraft during its 2-yr monitoring of volatiles in the coma of comet 67P/Churyumov–Gerasimenko, hereafter 67P/C–G. The cometary D/H ratio of D2O is higher than that of HDO, which also tentatively agrees with what is measured for IRAS 16293-2422 based on best-available estimates (Sect. 4.1). Within errors, it is not clear whether di-deuterated or mono-deuterated methanol has a higher D/H ratio. The main reason for this is the inability of ROSINA to distinguish CH3OD from CH2DOH (and CHD2OH from CH2DOD) by its instrumental design (Drozdovskaya et al. 2021). Figure 4 shows that the cometary D/H ratio of D2O, CHD2OH, NH2D, and HDS are significantly (at least one order of magnitude) lower than that in I16293B. The discrepancy for D2O and NH2D could be attributed to a lack of reliable protostellar measurements; however, for CHD2OH and HDS the differences are firm and pronounced. These could be signaling differences between IRAS 16293-2422 and the core that birthedour Solar System in the availability of D atoms, which could stem from either an initially lower elemental cloud abundance of D or be set by a warmer cloud temperature. Alternatively, this may stem from chemical evolution between the Class 0 stage and the formation of comets. Paquette et al. (2021) reported the measurements of the D/H ratio in 25 cometary dust particles that were obtained with the Cometary Secondary Ion Mass Analyser (COSIMA; Kissel et al. 2007) instrument aboard Rosetta. The average value of 1.57± 0.54 × 10⁻³ is in range of the D/H ratios determined in cometary volatile HDO, D2O, NH2D, and HDS (especially if the full range of D/H ratios measured in individual particles is considered, i.e., the shaded yellow range), but not with deuterated methanol. The measured D/H ratio of the carbonaceous refractory material is more than one order of magnitude lower than that of all volatiles of IRAS 16293-2422, except the best-available estimate in HDO. Unfortunately, there are no possibilities of directly probing the composition of dust in IRAS 16293-2422. Of course, it is also relevant to realize that 67P/C-G is merely a single comet of trillions in our Solar System, which may be tracing only a specific small sector of the proto-Solar disk.
5 Conclusions
This paper presents a new precise spectroscopic dataset for di-deuterated methanol, CHD2OH, based on the global line position analysis of Coudert et al. (2021) together with an observational search toward the low-mass protostellar system IRAS 16293-2422 in the data from the Atacama Large Millimeter/submillimeter Array (ALMA) Protostellar Interferometric Line Survey (PILS; Jørgensen et al. 2016). Until now, CHD2OH has been the missing link in the chain of methanol deuteration. This work investigates deuteration chains of several molecules (water, formaldehyde, methanol, methyl formate, dimethyl ether, and methyl cyanide) alongside one another. The main conclusions are:
- 1.
The best-fitting LTE parameters of CHD2OH are N = (1.78 ± 0.36) × 1017 cm−2 and Tex = 90.0 ± 9 K toward a one-beam offset position from IRAS 16293-2422 B in the SW direction (0.5′′ or 70 au away from the dust peak of B), which yields a D/H ratio 7.7 ± 1.2% with statistical correction. Toward a (slightly more than) one-beam offset position from IRAS 16293-2422 A in the NE direction (0.6′′ or 85 au away from the dust peak of A), the best-fitting LTE parameters of CHD2OH are N = (2.22 ± 0.44) × 1017 cm−2 and Tex = 127 ± 13 K, which yields a D/H ratio 7.5 ± 1.1% with statistical correction.
- 2.
In IRAS 16293-2422 B, the hot corino D/H ratios of all available molecules lie in the 0.55–16% range. This includes statistical corrections and is based on 36 data points (which include mono-, di-, and tri-deuterated molecules).
- 3.
No trends in the D/H ratios with functional groups are seen, nor with families (i.e., CHO-, N-, or S-bearing) when considering all D-bearing molecules. When considering solely mono-deuterated species, D/H ratios tentatively seem to be lower for N-bearing molecules and O-bearing species with <6 atoms in comparison to S-bearing molecules and O-bearing species with >6 atoms. This has already been observed in past papers for the O-bearing species and may be related to the differences in formation timescales.
- 4.
The D/H ratios of di-deuterated molecules relative to their mono-deuterated counterparts are consistently and significantly higher than the D/H ratios of mono-deuterated isotopologs relative to the nondeuterated species.Moreover, these fractionation levels of mono-deuterated formaldehyde, methanol, methyl formate, dimethyl ether, and methyl cyanide are remarkably similar (10–33% range with a mean value of 20.7 ± 6.2%) and agree within error bars. This trend is also starting to be seen in other low-mass star-forming systems as inventories of mono- and di-deuterated molecules in other sources are expanding.
- 5.
Tentatively, the best-available estimates of water deuteration suggest D2O to have aD/H ratio relative to HDO that is a factor of ~2 lower than of other di-deuterated molecules relative to their respective mono-deuterated counterparts. The D/H ratio of HDO relative to H2O is also lower than of all other molecules considered in low-mass star-forming regions. This is also seen in other sources, not just IRAS 16293-2422.
- 6.
When comparing D/H ratios of detected D-bearing molecules in IRAS 16293-2422 A and B with those in other low-mass Class 0 and I sources (L483, SVS13-A, NGC 1333-IRAS2A, -IRAS4A, and -IRAS4B), it does not appear that IRAS 16292-2422 is in any way abnormally deuterium-rich.
- 7.
Comparing D/H ratios of deuteration chains of formaldehyde and methanol in IRAS 16293-2422 B with those obtained in laboratory experiments (Nagaoka et al. 2005, 2007; Hidaka et al. 2009) shows that higher levels of fractionation in multiply deuterated isotopologs are obtained at a constant D/H input flux, which implies that this is not an indicator of multiply deuterated isotopologs forming in more D-rich conditions. Rather, this is a natural consequence of successive H-D substitution reactions (i.e., H-abstractions followed by D additions).
- 8.
Comparing D/H rations of molecules in IRAS 16293-2422 B with those measured in volatiles of comet 67P/Churyumov–Gerasimenko with Rosetta-ROSINA shows a firm and pronounced discrepancy in di-deuterated methanol and HDS (and, tentatively, in D2O and NH2D). The disagreement is less pronounced in mono-deuterated methanol due to larger cometary error bars and, tentatively, in HDO.The D/H ratio of the carbonaceous refractory cometary material measured with Rosetta-COSIMA is more than one order of magnitude lower than that of all volatiles of IRAS 16293-2422 B except for HDO (tentatively). The Solar System’s natal cloud may have had a lower initial elemental abundance of D or may have been warmer than the cloud of IRAS 16293-2422; or the cloud material may have been partially reprocessed prior to incorporation into a comet.
The analysis presented in this paper highlights the importance of accurate molecular spectroscopy for studies of isotopic fractionation. Concurrently, such studies have the potential to shed new light on the formation of organic molecules and their role in the chemistry of the early Solar System. Future studies of successive deuteration in large samples of protostellar sources, including high-mass star-forming regions, will test its role as a physicochemical tracer under a wider range of physical conditions.
Acknowledgements
This work is supported by the Swiss National Science Foundation (SNSF) Ambizione grant no. 180079, the Center for Space and Habitability (CSH) Fellowship, and the IAU Gruber Foundation Fellowship. A.C. is supported by the European Research Council (ERC) under the European Union’s Horizon 2020 research and innovation programme through ERC Starting Grant “Chemtrip” (grant agreement No. 949278). J.K.J. is supported by the Independent Research Fund Denmark (grant number 0135-00123B). The authors would like to thank Daniel Harsono and Florian Reinhard for useful discussions about the MCMC modeling routines that have been developed for this work. This work benefited from discussions held with the international team #461 “Provenances of our Solar System’s Relics” (team leaders Maria N. Drozdovskaya and Cyrielle Opitom) at the International Space Science Institute, Bern, Switzerland.
Appendix A Additional figures and detailed assumptions
A.1 Main isotopolog column densities in I16293
For ketene, formic acid, formamide, isocyanic acid, and cyanamide, the column densities of the main isotopologs are based on their minor carbon isotopologs and an assumed local ISM 12C/13C ratio (Jørgensen et al. 2018; Coutens et al. 2016; Ligterink et al. 2017; Coutens et al. 2018). For methyl cyanide, the column density was derived based in the vibrationally ex- cited v8 = 1 state (Calcutt et al. 2018). For methanol, the co- lumn density is based on its minor oxygen isotopolog and an as- sumed local ISM 16O/18O ratio (Jørgensen et al. 2016). For hydrogen sulfide, the column density is merely an estimate based on the jointly detected D-bearing isotopologs and past single dish data (section 3.6 of Drozdovskaya et al. 2018; however, on-going analysis of additional observations is constraining N(H2S) more accurately and showing it to be very close to the esti- mated value used here; Kushwahaa et al. in prep.). For formalde- hyde, ethanol, dimethyl ether, methyl formate, glycolaldehyde, acetaldehyde, and thioformaldehyde, the column densities of the main isotopologs are more reliable, because they were determined based on optically thin lines alone of the main isotopologs themselves (Persson et al. 2018; Jørgensen et al. 2018; Manigand et al. 2019; Drozdovskaya et al. 2018).
A.2 L483
Agúndez et al. (2019) carried out a line survey in the 80– 116 GHz frequency range with IRAM 30 m toward the cold dense protostellar core L483 harboring a Class 0 source. The cold nature of the source reduces the number of lines that are observable, for example, just one line of CHD2OH is detected (table 1 of Agúndez et al. 2019), which in turn makes it difficult to constrain Tex and N. Nevertheless, several di-deuterated species have been detected, including di-deuterated formaldehyde and methanol that are in common with I16293B (Persson et al. 2018 and this work)7. Jacobsen et al. (2019); Jensen et al. (2019), and Jensen et al. (2021) targeted the embedded protostar of this system with ALMA and detected HDO, D2O, CH3OD, and CH2DOH in the hot inner regions. Figure 3 shows that the ratio of CH2DOH/CH3OH in the hot corino is in close agreement with this ratio in the envelope8, suggesting that the envelope abundance ratios of Agúndez et al. (2019) may be representative of the hot corino abundance ratios for other D-bearing molecules in L483.
A.3 SVS13-A
Bianchi et al. (2017, 2019) observed the Class I SVS13-A protostar with IRAM 30 m and detected CHD2OH at two unique frequencies around 208 GHz. Simultaneously, deuterated formaldehyde (HDCO, D2CO), mono-deuterated methanol (CH2DOH, CH3OD), and mono-deuterated thioformaldehyde (HDCS) were also detected. Consequently, all D-bearing molecules of SVS13-A are common to I16293B. Methanol observations of SVS13-A were interpreted with two components: a compact hot corino and an extended colder envelope, both of which are plotted in Fig. 3. For the data points of SVS13-A, the D/H ratios and errors bars of HDCO, D2CO, and CH2DOH are taken directly from table 3 of Bianchi et al. (2017), which are based on column densities calculated with the Trot of the respective 13C-isotopologs. The D/H ratios stemming from CH3OD and CHD2OH have been calculated based on the provided estimated column densities of these two species in Bianchi et al. (2017), and N(CH3OH) as calculated from N(13CH3OH) and 12C/13C = 68 (Milam et al. 2005; Bianchi et al. 2017 quote 12C/13C = 86, which is likely a typo). The error bars correspond to uncertainties of 73%, as estimated for the worst case scenario from the uncertainties tabulated in table 3 of Bianchi et al. (2017) for D/H ratios from other molecules. The D/H ratio and errors bars of HDCS are taken di- rectly from figure 4 of Bianchi et al. (2019).
A.4 NGC 1333-IRAS2, -IRAS4A, and -IRAS4B
Parise et al. (2006) detected CHD2OH, CH2DOH, and CH3OD toward NGC 1333-IRAS2, -IRAS4A, and -IRAS4B with IRAM 30 m observations. The former two have subsequently been observed with the IRAM Plateau de Bure Interferometer (IRAM-PdBI) by Taquet et al. (2015, 2019), which allowed the column densities to be derived on smaller spatial scales of the hot corinos. The methanol and methyl cyanide column densi- ties shown in Fig. 3 for IRAS2A and IRAS4A stem from these PdBI observations, which are associated with the analysis of op- tically thin CH3OH lines (as verified by 13CH3OH line analysis and the derivation of the standard local ISM 12C/13C = 70 ratio). For IRAS4B, only single dish estimates of the column densities of deuterated methanol are available from Parise et al. (2006). The column density of HDO in IRAS2A, IRAS4A, and IRAS4B stems from PdBI observations of Persson et al. (2014) and of H2O from PdBI observations by Persson et al. (2012) of H O upon assumption of the standard 16O/18O = 560 ratio. These values are in agreement with those derived on larger spatial scales from Herschel observations of IRAS4A and IRAS4B (Coutens et al. 2013a; not shown). D2O has been detected by Coutens et al. (2014) in IRAS2A by PdBI observations. The HDO and H
 O column densities of Coutens et al. (2014) are within a factor of 2 of those derived in Persson et al. (2012, 2014). D/H ratios of HDCO and D2CO (and the associated H2CO abundance) stem from the JCMT Spectral Legacy Survey (SLS; Koumpia et al. 2016, 2017). The column densities of NH2D and NH3 stem from Wootten & Mangum (1993) and Blake et al. (1995), respectively, as presented in Shah & Wootten (2001), which is a combination of the Very Large Array (VLA), Caltech Submillimeter Observatory (CSO), and James Clerk Maxwell Telescope (JCMT) data. The error bars correspond to 30% uncertainties, based on the errors reported in the respective publications.
A.5 Binarity
All NGC 1333 sources appear to be part of binaries based on the latest ALMA and VLA observations. IRAS4A is a binary source of A1 and A2 with a separation of 1.83′′ (~ 547 au) (Tobin et al. 2016; López-Sepulcre et al. 2017; De Simone et al. 2020). Sahu et al. (2019) derived the column density of CH2DOH and of CH3OH based on 13CH3OH, yielding D/H ratios of 2.0 × 10⁻³ and 1.6 × 10⁻² for A2 and A1, respectively. These values are not far off from those of Taquet et al. (2019) for the binary as a whole (not shown in Fig. 3). IRAS2A is a binary source of VLA1 and VLA2 with a separation of 0.62′′ (~ 185 au) (Maret et al. 2014; Codella et al. 2014; Tobin et al. 2015, 2016). IRAS4B (sometimes labeled BI) has a binary component B’ (or BII) that is 10.654′′ (~ 3 186 au) away (Sakai et al. 2012; Anderl et al. 2016; Tobin et al. 2016). Here, a distance to NGC1333 of 299 pc is adopted (Zucker et al. 2018). The data points in Fig. 3 do not separate A1 from A2 in IRAS4A, nor VLA1 from VLA2 in IRAS2A, but IRAS4B data do not include contributions from IRAS4B’. All these sources are classified as Class 0s. L483 is an isolated source at a distance of ~ 200 pc (Dame & Thaddeus 1985; although there is quite some uncertainty here as discussed in Jacobsen et al. 2019). SVS13-A is binary source of VLA4A and VLA4B with a separation of 0.30′′ (~ 90 au), and a third source VLA3 (or SVS13A2) that is 5.314′′ (~ 1 589 au) away (Tobin et al. 2016; Codella et al. 2021). The data in Fig. 3 for SVS13-A are a combination of VLA4A and VLA4B, and may even contain contributions from VLA3. SVS13-A is also located in NGC1333.
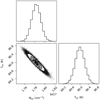 |
Fig. A.1 Corner plot of the second MCMC run of the CHD2OH computation for source B. |
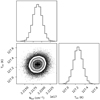 |
Fig. A.2 Corner plot of the second MCMC run of the CHD2OH computation for source A. |
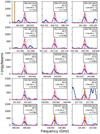 |
Fig. A.3 Another selection of some of the strongest 15 lines of CHD2OH observed (all optically thick). None of these have been used in the MCMC spectral fitting. The observed spectrum is in dark blue, the reference spectrum is in turquoise, and the best-fitting synthetic spectrum is in pink. The rest frequency, Eup (K), Aij (s−1), and optical depth (for the best-fitting parameters) are shown in the right corner of each panel. The rest frequency is indicated with a vertical dashed line, and the filled yellow region corresponds to the uncertainty on that line frequency. |
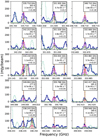 |
Fig. A.4 Same selection of some of the strongest 15 lines of CHD2OH out of the 105 used for synthetic spectral fitting as in Fig. 1, but now with also the best-fitting models for fixed Tex = 150 and 300 K overlaid in lilac and green, respectively. The observed spectrum is in dark blue, the reference spectrum is in turquoise, and the best-fitting synthetic spectrum (Tex =90 K) is in pink. The rest frequency, Eup (K), Aij (s−1), and optical depth (for the best-fitting parameters) are shown in the right corner of each panel. The rest frequency is indicated with a vertical dashed line, and the filled yellow region corresponds to the uncertainty on that line frequency. The lines at 353.934, 353.983, 355.788, and 359.948 GHz are in fact overlapping double transitions. |
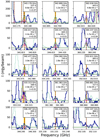 |
Fig. A.5 Highly excited lines of CHD2OH (out of the 105 used for synthetic spectral fitting) that drive the best-fitting excitation temperature to lower values (Sect. 3.1). The observed spectrum is in dark blue, the reference spectrum is in turquoise, and the best-fitting synthetic spectrum (Tex =90 K) is in pink. The best- fitting models for fixed Tex = 150 and 300 K are overlaid in lilac and green, respectively. The rest frequency, Eup (K), Aij (s−1), and optical depth (for the best-fitting parameters) are shown in the right corner of each panel. The rest frequency is indicated with a vertical dashed line, and the filled yellow region corresponds to the uncertainty on that line frequency. The lines at 342.477 and 333.313 GHz are in fact overlapping double transitions. |
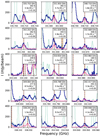 |
Fig. A.6 Same selection of some of the strongest 15 lines of CHD2OH out of the 105 used for synthetic spectral fitting as in Fig. 1, but now for source A. The observed spectrum is in dark blue, the best-fitting synthetic spectrum of is in pink. The reference spectrum is in turquoise. It is to note that the reference spectrum belongs to source B (shown to check for blending and to facilitate a comparison with Fig. 1). The rest frequency, Eup (K), Aij (s−1), and optical depth (for the best-fitting parameters) are shown in the right corner of each panel. The rest frequency is indicated with a vertical dashed line, and the filled yellow re- gion corresponds to the uncertainty on that line frequency. The lines at 353.934, 353.983, 355.788, and 359.948 GHz are in fact overlapping double transitions. |
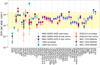 |
Fig. A.7 D/H ratio as measured in all the D-bearing molecules detected in the hot corinos of IRAS 16293-2422 A and B, including the respective statistical corrections (Appendix C). Available D/H ratios measured in other low-mass star-forming systems are also shown, see the main text for details. |
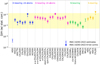 |
Fig. A.8 D/H ratio as measured in all the mono-deuterated molecules detected in the hot corino of IRAS 16293-2422 B, including the respective statistical corrections (Appendix C). This is a subset of the data points shown in Fig. 3. The data points are blue if the molecules are O-bearing and have no more than 6 atoms, fuchsia if the molecules are O-bearing and contain more than 6 atoms, green if the molecules are N-bearing, and gold if the molecules are S-bearing. |
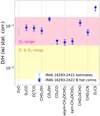 |
Fig. A.9 D/H ratio as measured in all the di-deuterated molecules detected in the hot corino of IRAS 16293-2422 B, in- cluding the respective statistical corrections (Appendix C). This is a subset of the data points shown in Fig. 3. |
Appendix B Integrated intensity maps details
In this Appendix, some additional details in connection to integrated intensity maps (moment 0 maps) are presented. Figure B.1 displays the “classical” (non-VINE) integrated intensity map, in which a constant vLSR of 2.7 km s−1 is applied. The left panel shows the full field of view (FOV) of the observations and the right panel shows a zoom-in of the two sources. This panel can be compared to the VINE map of the same line in Fig. 2a. Only minor differences are seen in this case. Figure B.3 displays the classical integrated intensity map of the line with a VINE map in Fig. 2b. In this case, the differences between the two for source A are more significant. The morphology of the emission is somewhat more extended in the VINE map. Also, the peak integrated intensity is higher. Both of these points indicate that the VINE map is doing a better job at recovering the line emission near source A.
Figs. B.1 and B.3 have 14 individual positions labeled. The corresponding line profiles at these positions are shown in Figs. B.2 and B.4, respectively. A closer inspection of position #9, which corresponds to on-source A, shows that there is blending with a neighboring line in the case of the 348.710 GHz line (which is only weakly emitting near source B) and that the 25 spectral bins used for integration still do not fully grab all the emission in the 334.056 GHz line (but a larger range would start including emission from nearby lines seen in the spectrum of source B). This illustrates that moment 0 maps, even VINE maps, have limitations when it comes to accurately showing the emission near source A. Potentially, only much higher spatial resolution observations can disentangle the different components of source A and allow more narrow lines to be observed that would be suitable for the creation of moment 0 maps.
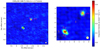 |
Fig. B.1 Integrated intensity maps of CHD2OH (moment 0 maps) in classical (non-VINE) method. The origin of the axes corresponds to RA, Dec (J2000) of 16h32m22.72s, -24d28′ 34.3′′. The 0.5′′ beam size isindicated in the bottom right by a yellow circle. |
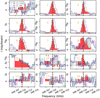 |
Fig. B.2 Spectra of the 348.710 GHz line at 15 different position that are numbered and displayed in Fig. B.1. The different colored curves correspond to different vLSR being applied. Blue corresponds to vLSR = 2.7 km s−1 that is most appropriate for source B, purple corresponds to vLSR = 3.2 km s−1 that is most appropriate for source A, and turquoise corresponds to the position-dependent vLSR of the VINE method. The red region shows the region being integrated for the VINE map in Fig. 2a. The gray region shows the region being integrated during the classical (non-VINE) method in Fig. B.1 (near sourceB it is fully overlapping with the red region). |
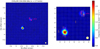 |
Fig. B.3 Integrated intensity maps of CHD2OH (moment 0 maps) in classical (non-VINE) method. The origin of the axes corresponds to RA, Dec (J2000) of 16h32m22.72s, -24d28′ 34.3′′. The 0.5′′ beam size isindicated in the bottom right by a yellow circle. |
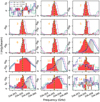 |
Fig. B.4 Spectra of the 334.056 GHz line at 15 different position that are numbered and displayed in Fig. B.3. The different colored curves correspond to different vLSR being applied. The different colored curves correspond to different vLSR being applied. Blue corresponds to vLSR = 2.7 km s−1 that is most appropriate for source B, purple corresponds to vLSR = 3.2 km s−1 that is most appropriate for source A, and turquoise corresponds to the position-dependent vLSR of the VINE method. The red region shows the region being integrated for the VINE map in Fig. 2b. The gray region shows the region being integrated during the classical (non-VINE) method in Fig. B.3 (near sourceB it is fully overlapping with the red region). |
Appendix C Statistical corrections to abundance ratios for D/H ratio derivations
The probability of a deuterium atom replacing a hydrogen atom at a specific location in a certain functional group (−XHn) is a statistically independent event. As presented in appendix B of Manigand et al. (2019), the number of indistinguishable combinations with i deuterium atoms at n potential sites in a specific functional group is the statistical correction that must be applied to the abundance ratio of two isotopologs to obtain the molecular deuteration fraction (called the D/H ratio of a molecule) in a specific functional group. The D/H ratio depends on whether it is being considered relative to an isotopolog without deuterium in that functional group or relative to one that already contains j deuterium atoms in that functional group as follows:

where  . For example:

Appendix D Deuterated species detected on large scales around IRAS 16293-2422
Deuterated species that are thought to trace the large-scale circumbinary envelope or even the larger surrounding cloud have been omitted from Fig. 3. Specifically, these are: DNO (tentatively claimed in absorption toward source A, Chandler et al. 2005; but noting that HNO has not been detected at the one-beam offset position from B, Coutens et al. 2019), DCN (Lis et al. 2002; van Dishoeck et al. 1995; Kuan et al. 2004; Takakuwa et al. 2007; Caux et al. 2011; Jørgensen et al. 2011; Wampfler et al. 2014; van der Wiel et al. 2019), DNC (van Dishoeck et al. 1995; Caux et al. 2011), DC3N (detected as part of TIMASSS without a derived column density, Jaber Al-Edhari et al. 2017, but not detected at the one-beam offset position from B, Calcutt et al. 2018), DC15N (Drozdovskaya et al. 2019), ND (Bacmann et al. 2010), N2D+ (Castets et al. 2001; Lis et al. 2002, 2016; Murillo et al. 2018), H2D+ (Stark et al. 2004; Brünken et al. 2014), D2H+ (Harju et al. 2017), C2D (van Dishoeck et al. 1995; Caux et al. 2011), OD (Parise et al. 2012), DCO+ (Wootten &Loren 1987; van Dishoeck et al. 1995; Lis et al. 2002; Stark et al. 2004; Caux et al. 2011; Jørgensen et al. 2011; Lindberg et al. 2017; Quénard et al. 2018; Murillo et al. 2018), D13CO+ (Caux et al. 2011; Quénard et al. 2018), c-C3HD (van Dishoeck et al. 1995; Caux et al. 2011; Majumdar et al. 2017), c-C3D2 (labeled in Martín-Doménech et al. 2016), and DCS+ (tentatively detected toward source A, Jørgensen et al. 2011, but not detected at the one-beam offset position from B, Drozdovskaya et al. 2018). Finally, CH2CDCN is omitted, as it was only tentatively detected by Huang et al. (2005) and was searched for, but not detected in the ALMA-PILS data (H. Calcutt priv. comm.).
References
- Agúndez, M., Marcelino, N., Cernicharo, J., Roueff, E., & Tafalla, M. 2019, A&A, 625, A147 [Google Scholar]
- Agúndez, M., Roueff, E., Cabezas, C., Cernicharo, J., & Marcelino, N. 2021, A&A, 649, A171 [NASA ADS] [CrossRef] [EDP Sciences] [Google Scholar]
- Aikawa, Y., Wakelam, V., Hersant, F., Garrod, R. T., & Herbst, E. 2012, ApJ, 760, 40 [NASA ADS] [CrossRef] [Google Scholar]
- Altwegg, K., Balsiger, H., Berthelier, J. J., et al. 2017, Phil. Trans. R. Soc. Lond. A, 375, 20160253 [Google Scholar]
- Amano, T. 1981, J. Mol. Spectr., 88, 194 [NASA ADS] [CrossRef] [Google Scholar]
- Anderl, S., Maret, S., Cabrit, S., et al. 2016, A&A, 591, A3 [NASA ADS] [CrossRef] [EDP Sciences] [Google Scholar]
- Anglada, G., Sepulveda, I., & Gomez, J. F. 1997, A&AS, 121, 255 [NASA ADS] [CrossRef] [EDP Sciences] [Google Scholar]
- Bacmann, A., Lefloch, B., Ceccarelli, C., et al. 2003, ApJ, 585, L55 [NASA ADS] [CrossRef] [Google Scholar]
- Bacmann, A., Caux, E., Hily-Blant, P., et al. 2010, A&A, 521, L42 [NASA ADS] [CrossRef] [EDP Sciences] [Google Scholar]
- Bacmann, A., Faure, A., Hily-Blant, P., et al. 2020, MNRAS, 499, 1795 [Google Scholar]
- Balsiger, H., Altwegg, K., Bochsler, P., et al. 2007, Space Sci. Rev., 128, 745 [NASA ADS] [CrossRef] [Google Scholar]
- Bergman, P., Parise, B., Liseau, R., & Larsson, B. 2011, A&A, 527, A39 [NASA ADS] [CrossRef] [EDP Sciences] [Google Scholar]
- Bianchi, E., Codella, C., Ceccarelli, C., et al. 2017, MNRAS, 467, 3011 [NASA ADS] [CrossRef] [Google Scholar]
- Bianchi, E., Ceccarelli, C., Codella, C., et al. 2019, ACS Earth Space Chem., 3, 2659 [NASA ADS] [CrossRef] [Google Scholar]
- Blake, G. A., Sandell, G., van Dishoeck, E. F., et al. 1995, ApJ, 441, 689 [Google Scholar]
- Brünken, S., Sipilä, O., Chambers, E. T., et al. 2014, Nature, 516, 219 [Google Scholar]
- Butner, H. M., Charnley, S. B., Ceccarelli, C., et al. 2007, ApJ, 659, L137 [Google Scholar]
- Calcutt, H., Jørgensen, J. K., Müller, H. S. P., et al. 2018, A&A, 616, A90 [NASA ADS] [CrossRef] [EDP Sciences] [Google Scholar]
- Calcutt, H., Willis, E. R., Jørgensen, J. K., et al. 2019, A&A, 631, A137 [NASA ADS] [CrossRef] [EDP Sciences] [Google Scholar]
- Caselli, P., & Ceccarelli, C. 2012, A&ARv, 20, 56 [Google Scholar]
- Caselli, P., Sipilä, O., & Harju, J. 2019, Phil. Trans. R. Soc. Lond. A, 377, 20180401 [Google Scholar]
- Castets, A., Ceccarelli, C., Loinard, L., Caux, E., & Lefloch, B. 2001, A&A, 375, 40 [NASA ADS] [CrossRef] [EDP Sciences] [Google Scholar]
- Castor, J. I. 1970, MNRAS, 149, 111 [NASA ADS] [Google Scholar]
- Caux, E., Kahane, C., Castets, A., et al. 2011, A&A, 532, A23 [NASA ADS] [CrossRef] [EDP Sciences] [Google Scholar]
- Cazaux, S., Caselli, P., & Spaans, M. 2011, ApJ, 741, L34 [NASA ADS] [CrossRef] [Google Scholar]
- Ceccarelli, C., Castets, A., Loinard, L., Caux, E., & Tielens, A. G. G. M. 1998, A&A, 338, L43 [NASA ADS] [Google Scholar]
- Ceccarelli, C., Loinard, L., Castets, A., et al. 2001, A&A, 372, 998 [NASA ADS] [CrossRef] [EDP Sciences] [Google Scholar]
- Ceccarelli, C., Caselli, P., Bockelée-Morvan, D., et al. 2014, in Protostars and Planets VI, Deuterium Fractionation: The Ariadne’s Thread from the Precollapse Phase to Meteorites and Comets Today, eds. B. Henrik, R. S. Klessen, C. P. Dullemond, & T. Henning (Tucson, AZ: Univ. Press), 859 [Google Scholar]
- Chandler, C. J., Brogan, C. L., Shirley, Y. L., & Loinard, L. 2005, ApJ, 632, 371 [NASA ADS] [CrossRef] [Google Scholar]
- Codella, C., Maury, A. J., Gueth, F., et al. 2014, A&A, 563, L3 [NASA ADS] [CrossRef] [EDP Sciences] [Google Scholar]
- Codella, C., Bianchi, E., Podio, L., et al. 2021, A&A 654, A52 [NASA ADS] [CrossRef] [EDP Sciences] [Google Scholar]
- Coudert, L., Motiyenko, R., Margulès, L., & Tchana Kwabia, F. 2021, J. Mol. Spectr., 381, 111515 [NASA ADS] [CrossRef] [Google Scholar]
- Coutens, A., Vastel, C., Cabrit, S., et al. 2013a, A&A, 560, A39 [NASA ADS] [CrossRef] [EDP Sciences] [Google Scholar]
- Coutens, A., Vastel, C., Cazaux, S., et al. 2013b, A&A, 553, A75 [NASA ADS] [CrossRef] [EDP Sciences] [Google Scholar]
- Coutens, A., Jørgensen, J. K., Persson, M. V., et al. 2014, ApJ, 792, L5 [Google Scholar]
- Coutens, A., Jørgensen, J. K., van der Wiel, M. H. D., et al. 2016, A&A, 590, L6 [NASA ADS] [CrossRef] [EDP Sciences] [Google Scholar]
- Coutens, A., Willis, E. R., Garrod, R. T., et al. 2018, A&A, 612, A107 [NASA ADS] [CrossRef] [EDP Sciences] [Google Scholar]
- Coutens, A., Ligterink, N. F. W., Loison, J. C., et al. 2019, A&A, 623, L13 [NASA ADS] [CrossRef] [EDP Sciences] [Google Scholar]
- Coutens, A., Commerçon, B., & Wakelam, V. 2020, A&A, 643, A108 [EDP Sciences] [Google Scholar]
- Dalgarno, A., & Lepp, S. 1984, ApJ, 287, L47 [NASA ADS] [CrossRef] [Google Scholar]
- Dame, T. M., & Thaddeus, P. 1985, ApJ, 297, 751 [NASA ADS] [CrossRef] [Google Scholar]
- De Simone, M., Ceccarelli, C., Codella, C., et al. 2020, ApJ, 896, L3 [NASA ADS] [CrossRef] [Google Scholar]
- Drozdovskaya, M. N., van Dishoeck, E. F., Jørgensen, J. K., et al. 2018, MNRAS, 476, 4949 [Google Scholar]
- Drozdovskaya, M. N., van Dishoeck, E. F., Rubin, M., Jørgensen, J. K., & Altwegg, K. 2019, MNRAS, 490, 50 [Google Scholar]
- Drozdovskaya, M. N., Schroeder I, I. R. H. G., Rubin, M., et al. 2021, MNRAS, 500, 4901 [Google Scholar]
- Dzib, S. A., Ortiz-León, G. N., Hernández-Gómez, A., et al. 2018, A&A, 614, A20 [NASA ADS] [CrossRef] [EDP Sciences] [Google Scholar]
- Elitzur, M. 1992, Astron. Masers, 170 [Google Scholar]
- Endres, C. P., Schlemmer, S., Schilke, P., Stutzki, J., & Müller, H. S. P. 2016, J. Mol. Spectr., 327, 95 [NASA ADS] [CrossRef] [Google Scholar]
- Foreman-Mackey, D., Hogg, D. W., Lang, D., & Goodman, J. 2013, PASP, 125, 306 [Google Scholar]
- Fu Su, C., Liu, M., & Quade, C. R. 1991, J. Mol. Spectr., 146, 264 [NASA ADS] [CrossRef] [Google Scholar]
- Furuya, K., van Dishoeck, E. F., & Aikawa, Y. 2016, A&A, 586, A127 [NASA ADS] [CrossRef] [EDP Sciences] [Google Scholar]
- Goodman, J., & Weare, J. 2010, Commun. Appl. Math. Comput. Sci., 5, 65 [Google Scholar]
- Harju, J., Sipilä, O., Brünken, S., et al. 2017, ApJ, 840, 63 [NASA ADS] [CrossRef] [Google Scholar]
- Hidaka, H., Watanabe, M., Kouchi, A., & Watanabe, N. 2009, ApJ, 702, 291 [NASA ADS] [CrossRef] [Google Scholar]
- Huang, H.-C., Kuan, Y.-J., Charnley, S. B., et al. 2005, Adv. Space Res., 36, 146 [NASA ADS] [CrossRef] [Google Scholar]
- Jaber Al-Edhari, A., Ceccarelli, C., Kahane, C., et al. 2017, A&A, 597, A40 [NASA ADS] [CrossRef] [EDP Sciences] [Google Scholar]
- Jacobsen, S. K., Jørgensen, J. K., Di Francesco, J., et al. 2019, A&A, 629, A29 [NASA ADS] [CrossRef] [EDP Sciences] [Google Scholar]
- Jensen, S. S., Jørgensen, J. K., Kristensen, L. E., et al. 2019, A&A, 631, A25 [NASA ADS] [CrossRef] [EDP Sciences] [Google Scholar]
- Jensen, S. S., Jørgensen, J. K., Kristensen, L. E., et al. 2021, A&A, 650, A172 [EDP Sciences] [Google Scholar]
- Jørgensen, J. K., Bourke, T. L., Nguyen Luong, Q., & Takakuwa, S. 2011, A&A, 534, A100 [NASA ADS] [CrossRef] [EDP Sciences] [Google Scholar]
- Jørgensen, J. K., van der Wiel, M. H. D., Coutens, A., et al. 2016, A&A, 595, A117 [Google Scholar]
- Jørgensen, J. K., Müller, H. S. P., Calcutt, H., et al. 2018, A&A, 620, A170 [Google Scholar]
- Jørgensen, J. K., Belloche, A., & Garrod, R. T. 2020, ARA&A, 58, 727 [Google Scholar]
- Kissel, J., Altwegg, K., Clark, B. C., et al. 2007, Space Sci. Rev., 128, 823 [NASA ADS] [CrossRef] [Google Scholar]
- Koumpia, E., van der Tak, F. F. S., Kwon, W., et al. 2016, A&A, 595, A51 [NASA ADS] [CrossRef] [EDP Sciences] [Google Scholar]
- Koumpia, E., Semenov, D. A., van der Tak, F. F. S., Boogert, A. C. A., & Caux, E. 2017, A&A, 603, A88 [NASA ADS] [CrossRef] [EDP Sciences] [Google Scholar]
- Kuan, Y.-J., Huang, H.-C., Charnley, S. B., et al. 2004, ApJ, 616, L27 [CrossRef] [Google Scholar]
- Ligterink, N. F. W., Coutens, A., Kofman, V., et al. 2017, MNRAS, 469, 2219 [Google Scholar]
- Lindberg, J. E., Charnley, S. B., Jørgensen, J. K., Cordiner, M. A., & Bjerkeli, P. 2017, ApJ, 835, 3 [NASA ADS] [CrossRef] [Google Scholar]
- Lis, D. C., Gerin, M., Phillips, T. G., & Motte, F. 2002, ApJ, 569, 322 [NASA ADS] [CrossRef] [Google Scholar]
- Lis, D. C., Wootten, H. A., Gerin, M., et al. 2016, ApJ, 827, 133 [NASA ADS] [CrossRef] [Google Scholar]
- Liu, M., & Quade, C. R. 1991a, J. Mol. Spectr., 146, 252 [NASA ADS] [CrossRef] [Google Scholar]
- Liu, M., & Quade, C. R. 1991b, J. Mol. Spectr., 146, 238 [NASA ADS] [CrossRef] [Google Scholar]
- Loinard, L., Castets, A., Ceccarelli, C., et al. 2000, A&A, 359, 1169 [NASA ADS] [Google Scholar]
- López-Sepulcre, A., Sakai, N., Neri, R., et al. 2017, A&A, 606, A121 [NASA ADS] [CrossRef] [EDP Sciences] [Google Scholar]
- Majumdar, L., Gratier, P., Andron, I., Wakelam, V., & Caux, E. 2017, MNRAS, 467, 3525 [NASA ADS] [CrossRef] [Google Scholar]
- Manigand, S., Calcutt, H., Jørgensen, J. K., et al. 2019, A&A, 623, A69 [NASA ADS] [CrossRef] [EDP Sciences] [Google Scholar]
- Manigand, S., Jørgensen, J. K., Calcutt, H., et al. 2020, A&A, 635, A48 [NASA ADS] [CrossRef] [EDP Sciences] [Google Scholar]
- Marcelino, N., Cernicharo, J., Roueff, E., Gerin, M., & Mauersberger, R. 2005, ApJ, 620, 308 [NASA ADS] [CrossRef] [Google Scholar]
- Maret, S., Belloche, A., Maury, A. J., et al. 2014, A&A, 563, L1 [NASA ADS] [CrossRef] [EDP Sciences] [Google Scholar]
- Martín-Doménech, R., Jiménez-Serra, I., Muñoz Caro, G. M., et al. 2016, A&A, 585, A112 [NASA ADS] [CrossRef] [EDP Sciences] [Google Scholar]
- Maureira, M. J., Pineda, J. E., Segura-Cox, D. M., et al. 2020, ApJ, 897, 59 [NASA ADS] [CrossRef] [Google Scholar]
- Milam, S. N., Savage, C., Brewster, M. A., Ziurys, L. M., & Wyckoff, S. 2005, ApJ, 634, 1126 [Google Scholar]
- Millar, T. J. 2003, Space Sci. Rev., 106, 73 [CrossRef] [Google Scholar]
- Mukhopadhyay, I. 2016a, Infrared Phys. Technol., 75, 193 [NASA ADS] [CrossRef] [Google Scholar]
- Mukhopadhyay, I. 2016b, Infrared Phys. Technol., 75, 139 [NASA ADS] [CrossRef] [Google Scholar]
- Mukhopadhyay, I. 2016c, Infrared Phys. Technol., 76, 116 [NASA ADS] [CrossRef] [Google Scholar]
- Mukhopadhyay, I., & Billinghurst, B. E. 2021, Infrared Phys. Technol., 113, 103563 [NASA ADS] [CrossRef] [Google Scholar]
- Müller, H. S. P., Thorwirth, S., Roth, D. A., & Winnewisser, G. 2001, A&A, 370, L49 [Google Scholar]
- Müller, H. S. P., Schlöder, F., Stutzki, J., & Winnewisser, G. 2005, J. Mol. Struct., 742, 215 [Google Scholar]
- Murillo, N. M., van Dishoeck, E. F., van der Wiel, M. H. D., et al. 2018, A&A, 617, A120 [NASA ADS] [CrossRef] [EDP Sciences] [Google Scholar]
- Nagaoka, A., Watanabe, N., & Kouchi, A. 2005, ApJ, 624, L29 [NASA ADS] [CrossRef] [Google Scholar]
- Nagaoka, A., Watanabe, N., & Kouchi, A. 2006, in Astrochemistry - From Laboratory Studies to Astronomical Observations, eds. R. I. Kaiser, P. Bernath, Y. Osamura, S. Petrie, & A. M. Mebel, AIP Conf. Ser., 855, 69 [NASA ADS] [CrossRef] [Google Scholar]
- Nagaoka, A., Watanabe, N., & Kouchi, A. 2007, J. Phys. Chem. A, 111, 3016 [NASA ADS] [CrossRef] [Google Scholar]
- Ndao, M., Kwabia Tchana, F., Coudert, L. H., et al. 2016, J. Mol. Spectr., 326, 136 [NASA ADS] [CrossRef] [Google Scholar]
- Oba, Y., Watanabe, N., & Kouchi, A. 2016, Chem. Phys. Lett., 662, 14 [NASA ADS] [CrossRef] [Google Scholar]
- Paquette, J. A., Fray, N., Bardyn, A., et al. 2021, MNRAS, 504, 4940 [NASA ADS] [CrossRef] [Google Scholar]
- Parise, B., Ceccarelli, C., Tielens, A. G. G. M., et al. 2002, A&A, 393, L49 [NASA ADS] [CrossRef] [EDP Sciences] [Google Scholar]
- Parise, B., Castets, A., Herbst, E., et al. 2004, A&A, 416, 159 [NASA ADS] [CrossRef] [EDP Sciences] [Google Scholar]
- Parise, B., Ceccarelli, C., Tielens, A. G. G. M., et al. 2006, A&A, 453, 949 [NASA ADS] [CrossRef] [EDP Sciences] [Google Scholar]
- Parise, B., Du, F., Liu, F. C., et al. 2012, A&A, 542, L5 [NASA ADS] [CrossRef] [EDP Sciences] [Google Scholar]
- Persson, M. V., Jørgensen, J. K., & van Dishoeck, E. F. 2012, A&A, 541, A39 [NASA ADS] [CrossRef] [EDP Sciences] [Google Scholar]
- Persson, M. V., Jørgensen, J. K., & van Dishoeck, E. F. 2013, A&A, 549, L3 [NASA ADS] [CrossRef] [EDP Sciences] [Google Scholar]
- Persson, M. V., Jørgensen, J. K., van Dishoeck, E. F., & Harsono, D. 2014, A&A, 563, A74 [NASA ADS] [CrossRef] [EDP Sciences] [Google Scholar]
- Persson, M. V., Jørgensen, J. K., Müller, H. S. P., et al. 2018, A&A, 610, A54 [NASA ADS] [CrossRef] [EDP Sciences] [Google Scholar]
- Pickett, H. M., Poynter, R. L., Cohen, E. A., et al. 1998, J. Quant. Spectr. Rad. Transf., 60, 883 [Google Scholar]
- Pineda, J. E., Maury, A. J., Fuller, G. A., et al. 2012, A&A, 544, L7 [NASA ADS] [CrossRef] [EDP Sciences] [Google Scholar]
- Prodanović, T., Steigman, G., & Fields, B. D. 2010, MNRAS, 406, 1108 [NASA ADS] [Google Scholar]
- Quade, C. R. 1967, J. Chem. Phys., 47, 1073 [NASA ADS] [CrossRef] [Google Scholar]
- Quade, C. R., Liu, M., Mukhopadhyay, I., & Su, C. F. 1998, J. Mol. Spectr., 192, 378 [NASA ADS] [CrossRef] [Google Scholar]
- Quénard, D., Jiménez-Serra, I., Viti, S., Holdship, J., & Coutens, A. 2018, MNRAS, 474, 2796 [Google Scholar]
- Richard, C., Jørgensen, J. K., Margulès, L., et al. 2021, A&A, 651, A120 [NASA ADS] [CrossRef] [EDP Sciences] [Google Scholar]
- Rodgers, S. D., & Charnley, S. B. 2002, Planet. Space Sci., 50, 1125 [Google Scholar]
- Roueff, E., Tiné, S., Coudert, L. H., et al. 2000, A&A, 354, L63 [NASA ADS] [Google Scholar]
- Sahu, D., Liu, S.-Y., Su, Y.-N., et al. 2019, ApJ, 872, 196 [Google Scholar]
- Sakai, N., Ceccarelli, C., Bottinelli, S., Sakai, T., & Yamamoto, S. 2012, ApJ, 754, 70 [NASA ADS] [CrossRef] [Google Scholar]
- Schöier, F. L., Jørgensen, J. K., van Dishoeck, E. F., & Blake, G. A. 2002, A&A, 390, 1001 [NASA ADS] [CrossRef] [EDP Sciences] [Google Scholar]
- Shah, R. Y., & Wootten, A. 2001, ApJ, 554, 933 [NASA ADS] [CrossRef] [Google Scholar]
- Sobolev, V. V. 1960, Moving envelopes of stars (Cambridge: Harvard University Press) [CrossRef] [Google Scholar]
- Spezzano, S., Brünken, S., Schilke, P., et al. 2013, ApJ, 769, L19 [Google Scholar]
- Stark, R., Sandell, G., Beck, S. C., et al. 2004, ApJ, 608, 341 [NASA ADS] [CrossRef] [Google Scholar]
- Su, C. F., & Quade, C. R. 1989a, J. Chem. Phys., 90, 1396 [NASA ADS] [CrossRef] [Google Scholar]
- Su, C. F., & Quade, C. R. 1989b, J. Mol. Spectr., 134, 290 [CrossRef] [Google Scholar]
- Su, C. F., Liu, M., & Quade, C. R. 1991, J. Mol. Spectr., 149, 557 [CrossRef] [Google Scholar]
- Takakuwa, S., Ohashi, N., Bourke, T. L., et al. 2007, ApJ, 662, 431 [NASA ADS] [CrossRef] [Google Scholar]
- Taquet, V., Ceccarelli, C., & Kahane, C. 2012, ApJ, 748, L3 [Google Scholar]
- Taquet, V., Peters, P. S., Kahane, C., et al. 2013, A&A, 550, A127 [NASA ADS] [CrossRef] [EDP Sciences] [Google Scholar]
- Taquet, V., Charnley, S. B., & Sipilä, O. 2014, ApJ, 791, 1 [NASA ADS] [CrossRef] [Google Scholar]
- Taquet, V., López-Sepulcre, A., Ceccarelli, C., et al. 2015, ApJ, 804, 81 [Google Scholar]
- Taquet, V., Bianchi, E., Codella, C., et al. 2019, A&A, 632, A19 [NASA ADS] [CrossRef] [EDP Sciences] [Google Scholar]
- Tielens, A. G. G. M. 1983, A&A, 119, 177 [NASA ADS] [Google Scholar]
- Tobin, J. J., Dunham, M. M., Looney, L. W., et al. 2015, ApJ, 798, 61 [Google Scholar]
- Tobin, J. J., Looney, L. W., Li, Z.-Y., et al. 2016, ApJ, 818, 73 [CrossRef] [Google Scholar]
- Turner, B. E. 1990, ApJ, 362, L29 [Google Scholar]
- van der Tak, F. F. S., Schilke, P., Müller, H. S. P., et al. 2002, A&A, 388, L53 [CrossRef] [EDP Sciences] [Google Scholar]
- van der Tak, F. F. S., Black, J. H., Schöier, F. L., Jansen, D. J., & van Dishoeck, E. F. 2007, A&A, 468, 627 [NASA ADS] [CrossRef] [EDP Sciences] [Google Scholar]
- van der Wiel, M. H. D., Jacobsen, S. K., Jørgensen, J. K., et al. 2019, A&A, 626, A93 [NASA ADS] [CrossRef] [EDP Sciences] [Google Scholar]
- van Dishoeck, E. F., Blake, G. A., Jansen, D. J., & Groesbeck, T. D. 1995, ApJ, 447, 760 [Google Scholar]
- Vastel, C., Bottinelli, S., Caux, E., Glorian, J. M., & Boiziot, M. 2015, in SF2A-2015: Proceedings of the Annual meeting of the French Society of Astronomy and Astrophysics, 313 [Google Scholar]
- Vastel, C., Phillips, T. G., Ceccarelli, C., & Pearson, J. 2003, ApJ, 593, L97 [Google Scholar]
- Vastel, C., Phillips, T. G., & Yoshida, H. 2004, ApJ, 606, L127 [Google Scholar]
- Wampfler, S. F., Jørgensen, J. K., Bizzarro, M., & Bisschop, S. E. 2014, A&A, 572, A24 [NASA ADS] [CrossRef] [EDP Sciences] [Google Scholar]
- Watson, W. D. 1974, ApJ, 188, 35 [NASA ADS] [CrossRef] [Google Scholar]
- Wootten, A., & Loren, R. B. 1987, ApJ, 317, 220 [NASA ADS] [CrossRef] [Google Scholar]
- Wootten,A., & Mangum, J. 1993, in Amer. Astron. Soc. Meet. Abstr., 183, 49.03 [Google Scholar]
- Zahorecz, S., Jimenez-Serra, I., Testi, L., et al. 2017, A&A, 602, L3 [NASA ADS] [CrossRef] [EDP Sciences] [Google Scholar]
- Zahorecz, S., Jimenez-Serra, I., Testi, L., et al. 2021, A&A, 653, A45 [NASA ADS] [CrossRef] [EDP Sciences] [Google Scholar]
- Zakharenko, O., Lewen, F., Ilyushin, V. V., et al. 2019, A&A, 621, A114 [NASA ADS] [CrossRef] [EDP Sciences] [Google Scholar]
- Zamponi, J., Maureira, M. J., Zhao, B., et al. 2021, MNRAS, 508, 2583 [NASA ADS] [CrossRef] [Google Scholar]
- Zapata, L. A., Loinard, L., Rodríguez, L. F., et al. 2013, ApJ, 764, L14 [NASA ADS] [CrossRef] [Google Scholar]
- Zucker, C., Schlafly, E. F., Speagle, J. S., et al. 2018, ApJ, 869, 83 [NASA ADS] [CrossRef] [Google Scholar]
Within this set of 26 lines, there are 22 unique line frequencies. Twenty out of 22 frequencies correspond to clearly detected emission lines. The remaining two lines are highly excited lines that are difficult to fit with all considered Tex values, specifically at 343.179 and 362.018 GHz (top left and top right panels of Fig. A.5).
Additional useful resources are, for example, https://prappleizer.github.io/Tutorials/MCMC/MCMC_Tutorial.html and https://jellis18.github.io/post/2018-01-02-mcmc-part1/
Likely, di-deuterated cyclopropenylidene (c-C3D2) is common to both sources as well, although the detection is yet to be confirmed following the labeling in Martín-Doménech et al. 2016. Di-deuterated thioformaldehyde and propyne (methyl acetylene) have not been detected in the hot corino of I16293B at the sensitivity of the ALMA-PILS data (Drozdovskaya et al. 2018; Calcutt et al. 2019), but are detected in L483 (Agúndez et al. 2019, 2021).
Jacobsen et al. (2019) determines N(CH3OH) based on optically thin lines of methanol itself, which are accessible in this source at the ~ 350 GHz frequencies targeted in that work. Meanwhile, Agúndez et al. (2019) derived N(CH3OH) based on N(13CH3OH) and the local ISM 12C/13C = 68 ratio, because the methanol lines at ~ 100 GHz are optically thick. The assumed value of 68 has been supported by the column density of 13CH3OH derived in Jacobsen et al. (2019). The same approach was also undertaken by Agúndez et al. (2019) to derive N(H2CO) based on N(H CO).
N(NH3) is the best-available value from Anglada et al. (1997). Jensen et al. (2019) and Jensen et al. (2021) derived N(H2O) based on N(H
CO).
N(NH3) is the best-available value from Anglada et al. (1997). Jensen et al. (2019) and Jensen et al. (2021) derived N(H2O) based on N(H OH) and the local ISM 16O/18O = 560 ratio. In Fig. 3, the error bars on the values from Jacobsen et al. (2019); Jensen et al. (2019, 2021); Agúndez et al. (2019, 2021) correspond to uncertainties of 30%.
All Tables
Best-fitting column densities, excitation temperatures, and D/H ratios (with statistical correction) of CHD2OH toward IRAS 16293-2422 B and A.
All Figures
|
Fig. 1 Selection of some of the strongest 15 lines of CHD2OH out of the 105 used for synthetic spectral fitting. The observed spectrum is in dark blue, the reference spectrum is in turquoise, and the best-fitting synthetic spectrum is in pink. The rest frequency, Eup (K), Aij (s−1), and optical depth (for the best-fitting parameters) are shown in the right corner of each panel. The rest frequency is indicated with a vertical dashed line, and the filled yellow region corresponds to the uncertainty on that line frequency. The lines at 353.934, 353.983, 355.788, and 359.948 GHz are in fact overlapping double transitions. |
| In the text | |
|
Fig. 2 Integrated intensity maps of CHD2OH (moment 0 maps). The binary sources A and B are labeled, as well as the one-beam offset position in the SW direction from sourceB that is central to this work. The origin of the axes corresponds to RA, Dec (J2000) of 16h32m22.72s, −24d28′34.3′′. The 0.5′′ beam size isindicated in the bottom right by a yellow circle. |
| In the text | |
|
Fig. 3 D/H ratio as measured in all the D-bearing molecules detected in the hot corino of IRAS 16293-2422 B, including the respective statistical corrections (Appendix C). Available D/H ratios measured in other low-mass star-formingsystems are also shown, see the main text for details. |
| In the text | |
|
Fig. 4 D/H ratio as measured in the hot corino of IRAS 16293-2422 B, in the volatiles and dust of comet 67P/Churyumov–Gerasimenko, and in laboratory experiments. The respective statistical corrections (Appendix C) are accounted for in all data points. The dashed gray line is the experimental D/H input flux. The solid black line is the mean value of the refractory carbonaceous component with black dashed lines indicating the errors on this mean and the yellow region indicating the full range of values covered by the individual 25 particle measurements. See the main text for details and references. |
| In the text | |
|
Fig. A.1 Corner plot of the second MCMC run of the CHD2OH computation for source B. |
| In the text | |
|
Fig. A.2 Corner plot of the second MCMC run of the CHD2OH computation for source A. |
| In the text | |
|
Fig. A.3 Another selection of some of the strongest 15 lines of CHD2OH observed (all optically thick). None of these have been used in the MCMC spectral fitting. The observed spectrum is in dark blue, the reference spectrum is in turquoise, and the best-fitting synthetic spectrum is in pink. The rest frequency, Eup (K), Aij (s−1), and optical depth (for the best-fitting parameters) are shown in the right corner of each panel. The rest frequency is indicated with a vertical dashed line, and the filled yellow region corresponds to the uncertainty on that line frequency. |
| In the text | |
|
Fig. A.4 Same selection of some of the strongest 15 lines of CHD2OH out of the 105 used for synthetic spectral fitting as in Fig. 1, but now with also the best-fitting models for fixed Tex = 150 and 300 K overlaid in lilac and green, respectively. The observed spectrum is in dark blue, the reference spectrum is in turquoise, and the best-fitting synthetic spectrum (Tex =90 K) is in pink. The rest frequency, Eup (K), Aij (s−1), and optical depth (for the best-fitting parameters) are shown in the right corner of each panel. The rest frequency is indicated with a vertical dashed line, and the filled yellow region corresponds to the uncertainty on that line frequency. The lines at 353.934, 353.983, 355.788, and 359.948 GHz are in fact overlapping double transitions. |
| In the text | |
|
Fig. A.5 Highly excited lines of CHD2OH (out of the 105 used for synthetic spectral fitting) that drive the best-fitting excitation temperature to lower values (Sect. 3.1). The observed spectrum is in dark blue, the reference spectrum is in turquoise, and the best-fitting synthetic spectrum (Tex =90 K) is in pink. The best- fitting models for fixed Tex = 150 and 300 K are overlaid in lilac and green, respectively. The rest frequency, Eup (K), Aij (s−1), and optical depth (for the best-fitting parameters) are shown in the right corner of each panel. The rest frequency is indicated with a vertical dashed line, and the filled yellow region corresponds to the uncertainty on that line frequency. The lines at 342.477 and 333.313 GHz are in fact overlapping double transitions. |
| In the text | |
|
Fig. A.6 Same selection of some of the strongest 15 lines of CHD2OH out of the 105 used for synthetic spectral fitting as in Fig. 1, but now for source A. The observed spectrum is in dark blue, the best-fitting synthetic spectrum of is in pink. The reference spectrum is in turquoise. It is to note that the reference spectrum belongs to source B (shown to check for blending and to facilitate a comparison with Fig. 1). The rest frequency, Eup (K), Aij (s−1), and optical depth (for the best-fitting parameters) are shown in the right corner of each panel. The rest frequency is indicated with a vertical dashed line, and the filled yellow re- gion corresponds to the uncertainty on that line frequency. The lines at 353.934, 353.983, 355.788, and 359.948 GHz are in fact overlapping double transitions. |
| In the text | |
|
Fig. A.7 D/H ratio as measured in all the D-bearing molecules detected in the hot corinos of IRAS 16293-2422 A and B, including the respective statistical corrections (Appendix C). Available D/H ratios measured in other low-mass star-forming systems are also shown, see the main text for details. |
| In the text | |
|
Fig. A.8 D/H ratio as measured in all the mono-deuterated molecules detected in the hot corino of IRAS 16293-2422 B, including the respective statistical corrections (Appendix C). This is a subset of the data points shown in Fig. 3. The data points are blue if the molecules are O-bearing and have no more than 6 atoms, fuchsia if the molecules are O-bearing and contain more than 6 atoms, green if the molecules are N-bearing, and gold if the molecules are S-bearing. |
| In the text | |
|
Fig. A.9 D/H ratio as measured in all the di-deuterated molecules detected in the hot corino of IRAS 16293-2422 B, in- cluding the respective statistical corrections (Appendix C). This is a subset of the data points shown in Fig. 3. |
| In the text | |
|
Fig. B.1 Integrated intensity maps of CHD2OH (moment 0 maps) in classical (non-VINE) method. The origin of the axes corresponds to RA, Dec (J2000) of 16h32m22.72s, -24d28′ 34.3′′. The 0.5′′ beam size isindicated in the bottom right by a yellow circle. |
| In the text | |
|
Fig. B.2 Spectra of the 348.710 GHz line at 15 different position that are numbered and displayed in Fig. B.1. The different colored curves correspond to different vLSR being applied. Blue corresponds to vLSR = 2.7 km s−1 that is most appropriate for source B, purple corresponds to vLSR = 3.2 km s−1 that is most appropriate for source A, and turquoise corresponds to the position-dependent vLSR of the VINE method. The red region shows the region being integrated for the VINE map in Fig. 2a. The gray region shows the region being integrated during the classical (non-VINE) method in Fig. B.1 (near sourceB it is fully overlapping with the red region). |
| In the text | |
|
Fig. B.3 Integrated intensity maps of CHD2OH (moment 0 maps) in classical (non-VINE) method. The origin of the axes corresponds to RA, Dec (J2000) of 16h32m22.72s, -24d28′ 34.3′′. The 0.5′′ beam size isindicated in the bottom right by a yellow circle. |
| In the text | |
|
Fig. B.4 Spectra of the 334.056 GHz line at 15 different position that are numbered and displayed in Fig. B.3. The different colored curves correspond to different vLSR being applied. The different colored curves correspond to different vLSR being applied. Blue corresponds to vLSR = 2.7 km s−1 that is most appropriate for source B, purple corresponds to vLSR = 3.2 km s−1 that is most appropriate for source A, and turquoise corresponds to the position-dependent vLSR of the VINE method. The red region shows the region being integrated for the VINE map in Fig. 2b. The gray region shows the region being integrated during the classical (non-VINE) method in Fig. B.3 (near sourceB it is fully overlapping with the red region). |
| In the text | |
Current usage metrics show cumulative count of Article Views (full-text article views including HTML views, PDF and ePub downloads, according to the available data) and Abstracts Views on Vision4Press platform.
Data correspond to usage on the plateform after 2015. The current usage metrics is available 48-96 hours after online publication and is updated daily on week days.
Initial download of the metrics may take a while.