Fig. A.6
Download original image
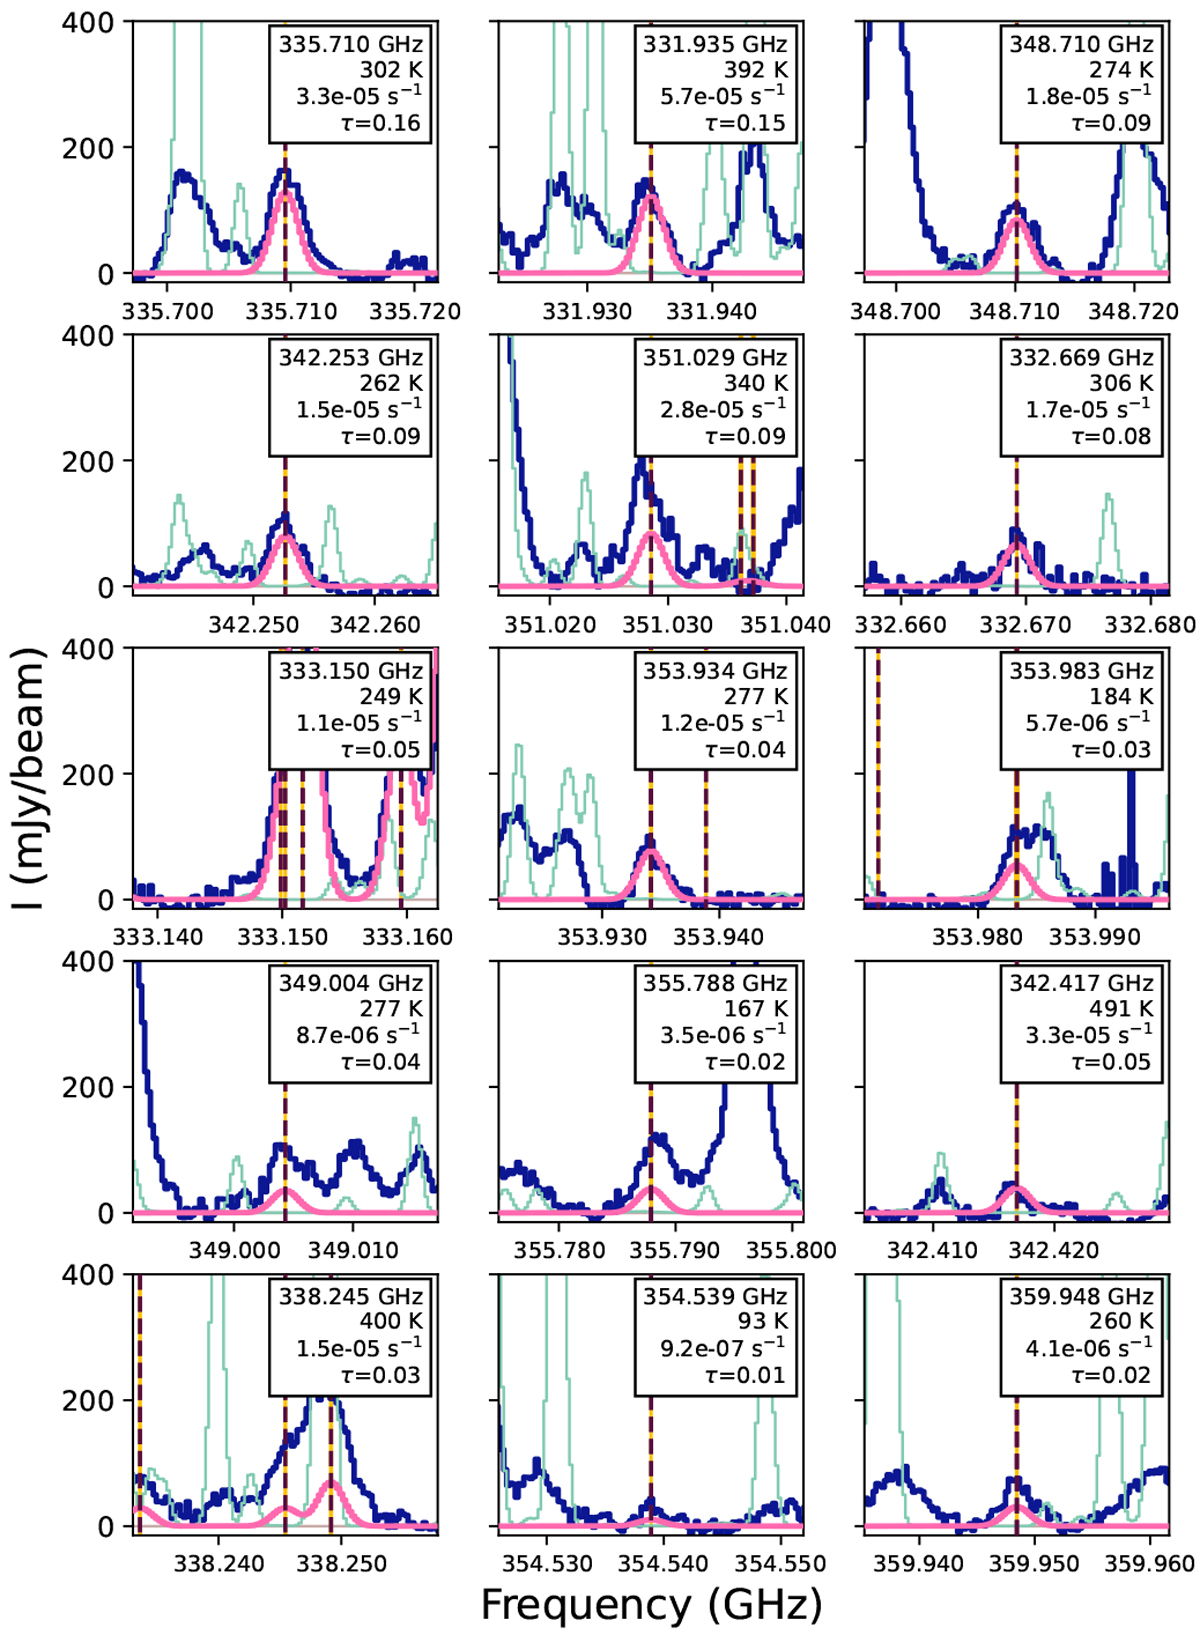
Same selection of some of the strongest 15 lines of CHD2OH out of the 105 used for synthetic spectral fitting as in Fig. 1, but now for source A. The observed spectrum is in dark blue, the best-fitting synthetic spectrum of is in pink. The reference spectrum is in turquoise. It is to note that the reference spectrum belongs to source B (shown to check for blending and to facilitate a comparison with Fig. 1). The rest frequency, Eup (K), Aij (s−1), and optical depth (for the best-fitting parameters) are shown in the right corner of each panel. The rest frequency is indicated with a vertical dashed line, and the filled yellow re- gion corresponds to the uncertainty on that line frequency. The lines at 353.934, 353.983, 355.788, and 359.948 GHz are in fact overlapping double transitions.
Current usage metrics show cumulative count of Article Views (full-text article views including HTML views, PDF and ePub downloads, according to the available data) and Abstracts Views on Vision4Press platform.
Data correspond to usage on the plateform after 2015. The current usage metrics is available 48-96 hours after online publication and is updated daily on week days.
Initial download of the metrics may take a while.