Fig. A.5
Download original image
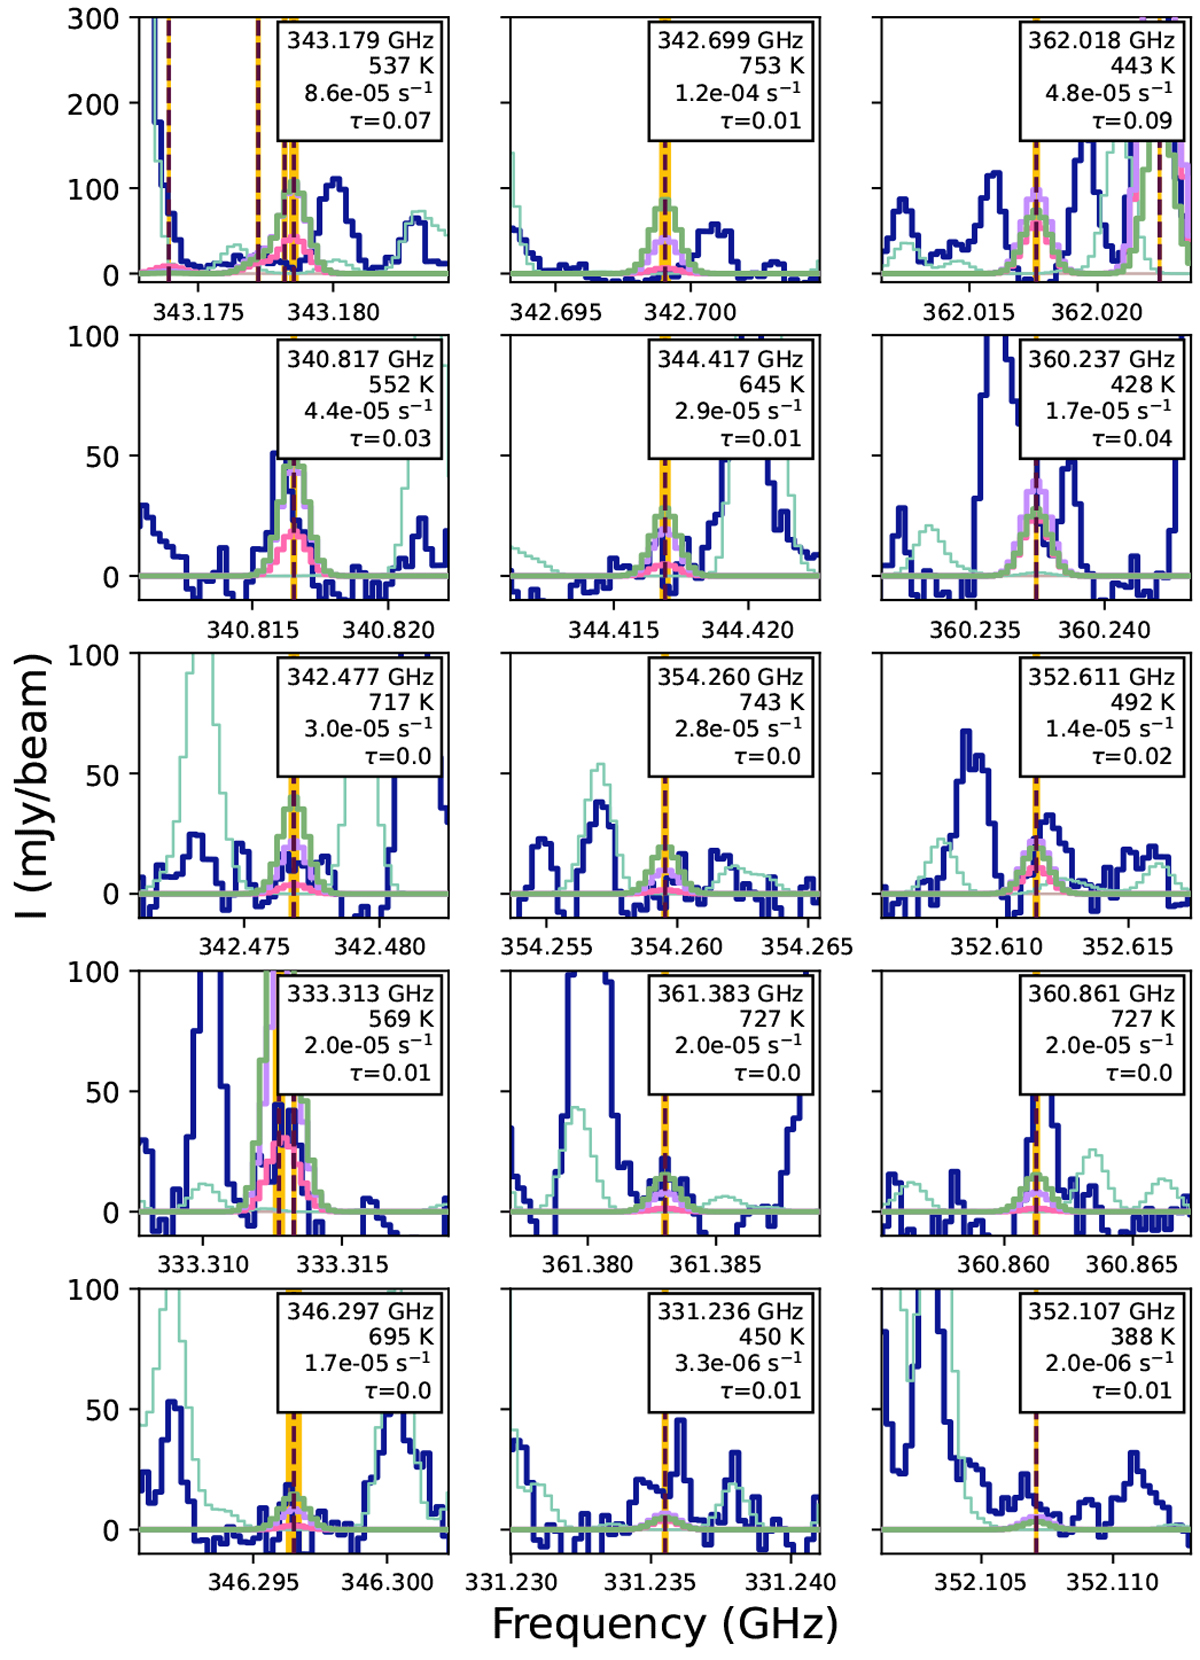
Highly excited lines of CHD2OH (out of the 105 used for synthetic spectral fitting) that drive the best-fitting excitation temperature to lower values (Sect. 3.1). The observed spectrum is in dark blue, the reference spectrum is in turquoise, and the best-fitting synthetic spectrum (Tex =90 K) is in pink. The best- fitting models for fixed Tex = 150 and 300 K are overlaid in lilac and green, respectively. The rest frequency, Eup (K), Aij (s−1), and optical depth (for the best-fitting parameters) are shown in the right corner of each panel. The rest frequency is indicated with a vertical dashed line, and the filled yellow region corresponds to the uncertainty on that line frequency. The lines at 342.477 and 333.313 GHz are in fact overlapping double transitions.
Current usage metrics show cumulative count of Article Views (full-text article views including HTML views, PDF and ePub downloads, according to the available data) and Abstracts Views on Vision4Press platform.
Data correspond to usage on the plateform after 2015. The current usage metrics is available 48-96 hours after online publication and is updated daily on week days.
Initial download of the metrics may take a while.