Fig. 4
Download original image
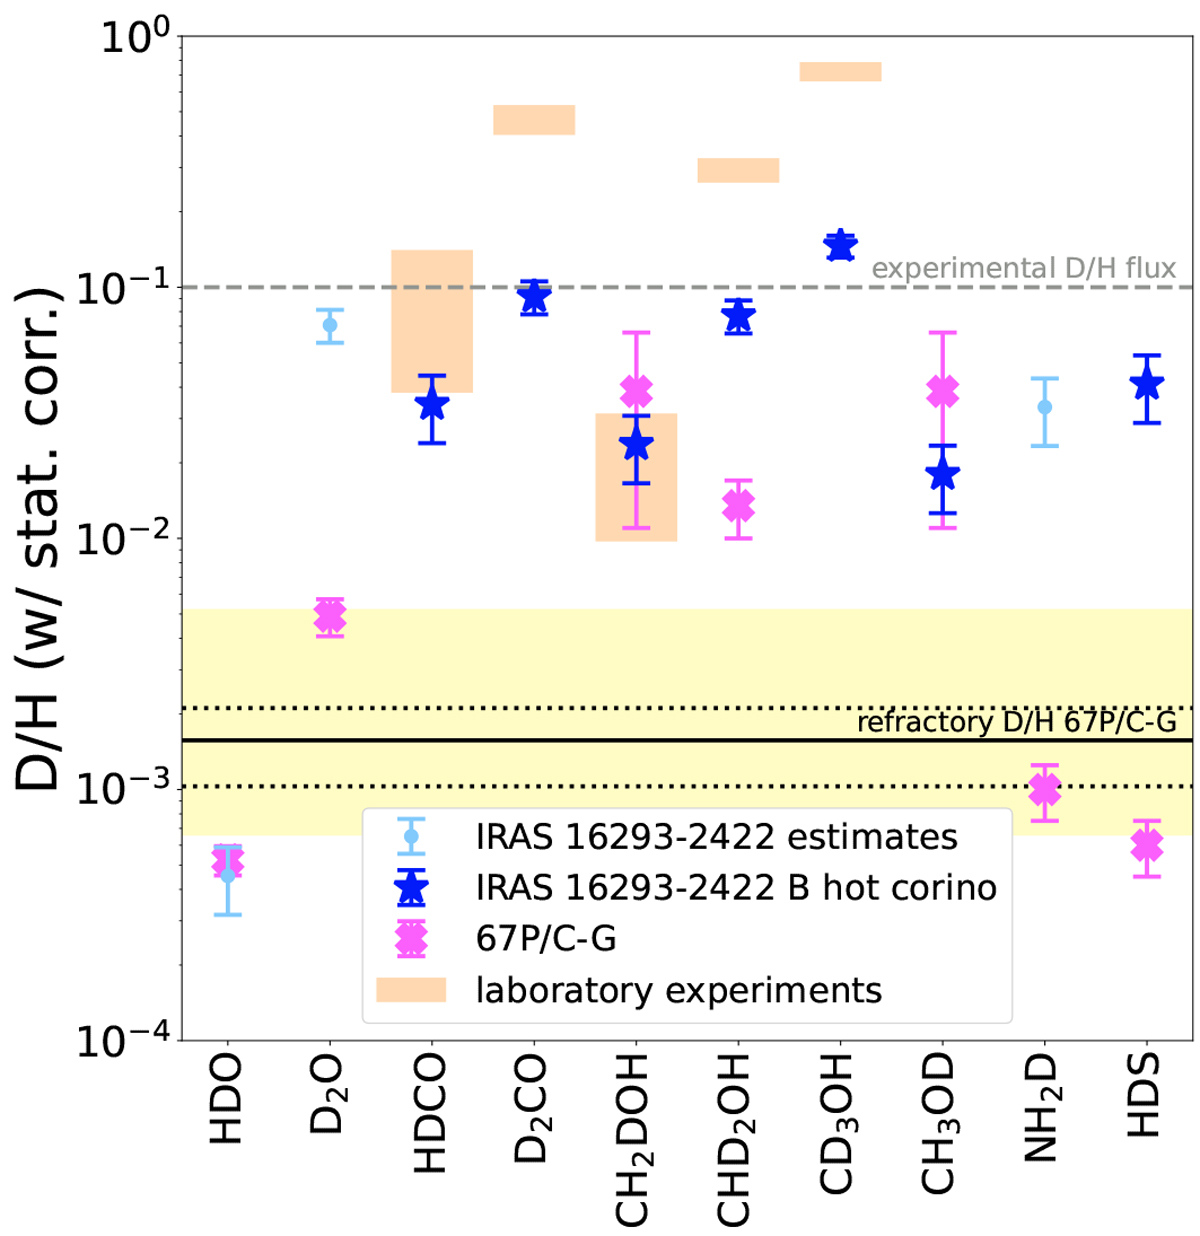
D/H ratio as measured in the hot corino of IRAS 16293-2422 B, in the volatiles and dust of comet 67P/Churyumov–Gerasimenko, and in laboratory experiments. The respective statistical corrections (Appendix C) are accounted for in all data points. The dashed gray line is the experimental D/H input flux. The solid black line is the mean value of the refractory carbonaceous component with black dashed lines indicating the errors on this mean and the yellow region indicating the full range of values covered by the individual 25 particle measurements. See the main text for details and references.
Current usage metrics show cumulative count of Article Views (full-text article views including HTML views, PDF and ePub downloads, according to the available data) and Abstracts Views on Vision4Press platform.
Data correspond to usage on the plateform after 2015. The current usage metrics is available 48-96 hours after online publication and is updated daily on week days.
Initial download of the metrics may take a while.