| Issue |
A&A
Volume 656, December 2021
|
|
|---|---|---|
| Article Number | A121 | |
| Number of page(s) | 10 | |
| Section | Stellar structure and evolution | |
| DOI | https://doi.org/10.1051/0004-6361/202142151 | |
| Published online | 10 December 2021 | |
Rossby numbers and stiffness values inferred from gravity-mode asteroseismology of rotating F- and B-type dwarfs
Consequences for mixing, transport, magnetism, and convective penetration
1
Institute of Astronomy, KU Leuven, Celestijnenlaan 200D, 3001 Leuven, Belgium
e-mail: This email address is being protected from spambots. You need JavaScript enabled to view it.
2
Department of Astrophysics, IMAPP, Radboud University Nijmegen, PO Box 9010 6500 GL Nijmegen, The Netherlands
3
Max Planck Institute for Astronomy, Koenigstuhl 17, 69117 Heidelberg, Germany
4
AIM, CEA, CNRS, Université Paris-Saclay, Université Paris Diderot, Sorbonne Paris Cité, 91191 Gif-sur-Yvette, France
5
Department of Engineering Science and Applied Mathematics, Northwestern University, 2145 Sheridan Road, Evanston, IL 60208, USA
6
Kavli Institute for Theoretical Physics, University of California, Santa Barbara, CA, USA
7
IRAP, Université de Toulouse, CNRS, UPS, CNES, 14 avenue Édouard Belin, 31400 Toulouse, France
Received:
3
September
2021
Accepted:
12
October
2021
Abstract
Context. Multi-dimensional (magneto-)hydrodynamical simulations of physical processes in stellar interiors depend on a multitude of uncalibrated free parameters, which set the spatial and time scales of their computations.
Aims. We aim to provide an asteroseismic calibration of the wave and convective Rossby numbers, and of the stiffness at the interface between the convective core and radiative envelope of intermediate-mass stars. We deduce these quantities for rotating dwarfs from the observed properties of their identified gravity and gravito-inertial modes.
Methods. We relied on near-core rotation rates and asteroseismic models of 26 B- and 37 F-type dwarf pulsators derived from 4-year Kepler space photometry, high-resolution spectroscopy, and Gaia astrometry in the literature to deduce their convective and wave Rossby numbers. We computed the stiffness at the interface of the convective core and the radiative envelope from the inferred maximum buoyancy frequency at the interface and the convective turnover frequency in the core. We use those asteroseismically inferred quantities to make predictions of convective penetration levels, local flux levels of gravito-inertial waves triggered by the convective core, and of the cores’ potential rotational and magnetic states.
Results. Our sample of 63 gravito-inertial mode pulsators covers near-core rotation rates from almost zero up to the critical rate. The frequencies of their identified modes lead to models with stiffness values between 102.69 and 103.60 for the B-type pulsators, while those of F-type stars cover the range from 103.47 to 104.52. The convective Rossby numbers derived from the maximum convective diffusion coefficient in the convective core, based on mixing length theory and a value of the mixing length coefficient relevant for these pulsators, vary between 10−2.3 and 10−0.8 for B-type stars and 10−3 and 10−1.5 for F-type stars. The 17 B-type dwarfs with an asteroseismic estimate of the penetration depth reveal it to be in good agreement with recent theory of convective penetration that takes rotation into account. Theoretical estimates based on the observationally inferred convective Rossby numbers and stiffness values lead to local stochastically-excited gravito-inertial wave fluxes which may exceed those predicted for non-rotating cores, in agreement with observations. Finally, the convective core of rapid rotators is expected to have cylindrical differential rotation causing a magnetic field of 20–400 kG for B-type stars and of 0.1–3 MG for F-type stars.
Conclusions. Our results provide asteroseismic calibrations to guide realistic (magneto-)hydrodynamical simultations of rotating (magnetised) core convection in stellar interiors of dwarfs and future modelling of transport and mixing processes in their interiors.
Key words: waves / asteroseismology / convection / stars: interiors / stars: rotation / stars: oscillations
© ESO 2021
1. Introduction
Stellar modelling of dwarfs with a convective core and a radiative envelope is currently undergoing major advances. This boost occurs thanks to the integration of high-precision observational constraints, notably μmag space photometry, even more powerful multi-dimensional hydrodynamical simulations, and new theoretical developments (see Aerts et al. 2019, for a review on this integration). One particular aspect of the progress relates to the new development of gravito-inertial asteroseismology applied to F- and B-type dwarfs (e.g., Aerts et al. 2018, for a modelling scheme). This research field could only emerge thanks to long-term uninterrupted photometric observations from space. Such uninterrupted space photometry delivered the required observational constraints to exploit long-period non-radial gravity modes, in contrast to interrupted time-series spectroscopy or photometry assembled from ground-based observatories.
The best available space data for gravito-inertial asteroseismology are the 4-year duration Kepler light curves (Koch et al. 2010). These are assembled in quarters with a duration of 3 months, after which the satellite had to be rotated to avoid sunlight hitting the detectors. Stitching the 3-month-long light curve chunks from all quarters results in 4-year light curves, which deliver high-precision mode amplitudes ranging from a few to thousands of μmag. The low frequencies of high-amplitude gravito-inertial modes are also of high precision given that the frequency resolution of the light curves is ∝1/(1460 d). However, the signal at low frequencies is only trustworthy above ∼1 μHz. Below this value, the frequency spectra of the stitched quarter light curves are unreliable due to the influence of instrumental and detrending effects (see Tkachenko et al. 2013, for details). We therefore only rely on gravity or gravito-inertial modes and waves with observed frequencies above 1 μHz. Such modes are prominently present in the observed frequency spectra of F-type and B-type dwarfs (Aerts 2021, for a review).
While the global frequency spectra of internal gravity waves tend to be smooth functions described by power laws (Rogers et al. 2013; Alvan et al. 2014), resonant eigenmodes with high amplitudes occur as sharp peaks in the Fourier spectrum thanks to efficient excitation mechanisms overcoming radiative damping (see e.g., Alvan et al. 2015; Lecoanet et al. 2019). Aside from tidal excitation (ignored in this work; see Fuller 2017), gravity-mode excitation in single B-type dwarfs may occur in their thin iron convection zone due to an opacity bump in the outer radiative envelope (the so-called κ mechanism, e.g., Pamyatnykh 1999; Szewczuk & Daszyńska-Daszkiewicz 2017). Gravity-modes in F-type dwarfs occur due to flux blocking (Guzik et al. 2000; Dupret et al. 2005). However, it has recently become clear that gravito-inertial waves (GIWs) can also be excited stochastically by the rapidly rotating convective core because of turbulent convective Reynolds stresses and turbulent convective plumes (Samadi et al. 2010; Rogers et al. 2013; Neiner et al. 2020; Augustson et al. 2020). In the subinertial regime, waves are propagative in the convective core as inertial waves that become gravito-inertial waves in the radiative envelope (e.g., Mathis et al. 2014; Ouazzani et al. 2020; Lee & Saio 2020; Lee 2021). In the superinertial regime, they are evanescent in the convective core and are propagative only in the radiative envelope. Stochastically excited GIWs have recently been detected in rapidly rotating Be stars (Neiner et al. 2012, 2020). Finally, non-linear resonant mode coupling may also be an efficient excitation and energy exchange mechanism in dwarfs (e.g., Goupil & Buchler 1994; Buchler et al. 1997), with promising recent observational detections for SPB stars by Van Beeck et al. (2021).
Irrespective of how the modes are excited, gravito-inertial asteroseismology treats the modelling of detected and identified mode frequencies in rapidly rotating dwarfs. These mode frequencies are often of the same order as the rotation frequency of the star and therefore tend to occur in the subinertial regime (Van Reeth et al. 2015; Moravveji et al. 2016). As such, asteroseismic modelling must rely on the inclusion of the Coriolis acceleration in the theoretical pulsation computations upon which it builds. This is nowadays done in the so-called Traditional Approximation of Rotation (TAR, e.g., Lee & Saio 1987; Townsend 2003; Mathis 2009, for theoretical descriptions suitable to compute adiabatic pulsations in the Cowling approximation) and has proven to be highly successful in deriving high-precision values for the masses of dwarfs (in the range of 1.3–9 M⊙), their evolutionary stage, their internal rotation frequency near the convective core, and their level of envelope mixing (Aerts 2021, for a summary of asteroseismic achievements).
Given the recent findings from this new subfield of asteroseismology, new theoretical developments of the TAR have emerged and are yet to be exploited by revisiting the Kepler data. The latest formulations of the TAR include the Lorentz force due to a magnetic field (Prat et al. 2019, 2020) and the centrifugal acceleration for either slightly deformed stars (Mathis & Prat 2019; Henneco et al. 2021) or in the presence of strong deformation (Dhouib et al. 2021a,b). These new TAR-based theories offer opportunities to go beyond the derivation of internal rotation and mixing in the exploitation of the Kepler data and should allow for future probing of internal magnetic field strengths in the presence of rotational deformation (Van Beeck et al. 2020; Mathis et al. 2021; Henneco et al. 2021; Dhouib et al. 2021a,b).
This paper gathers the currently available input from gravito-inertial asteroseismology to guide and advance multi-dimensional magnetohydrodynamical (MHD) simulations of dwarfs with a convective core (e.g., Browning et al. 2004; Brun et al. 2005; Rogers et al. 2013). With ever increasing computational power, progress in such simulations is large, with the aim to offer new understandings in transport processes in the deep interior of stars with a convective core. In order to be of practical use, the simulations need to be run for proper time and spatial scales revealed by modern 4-year long observations.
Gravito-inertial asteroseismology has revealed low-frequency large-scale prograde modes (adopting the terminology by Unno et al. 1989), also termed Kelvin modes by Townsend (2003), with frequencies between a few and a few tens of μHz which are dominant in the data for the majority of stars (Aerts 2021). Hence, proper numerical simulations should be set up to treat large-scale global long-duration processes for appropriate ranges of the rotation frequencies of observed stars. Only few such simulations were developed since the seminal work by Rogers et al. (2013), given the tough requirements on the time and spatial scales (Edelmann et al. 2019; André 2019; Horst et al. 2020).
While modern 3D (M)HD simulations of rotating core convection for intermediate-mass dwarfs reveal internal gravity wave spectra in good agreement with observations (Bowman et al. 2019a,b, 2020), both for an anelastic approach (Edelmann et al. 2019) and for compressible fluids (Horst et al. 2020), these do not yet cover the range of internal rotation rates inferred for gravito-inertial pulsators. Building further on the simulations by Browning et al. (2004), Brun et al. (2005), and Featherstone et al. (2009), Augustson et al. (2016) included both a strong core dynamo-generated magnetic field and rotation in extensive sets of 3D MHD simulations. They include rotation rates up to 16% of the critical rate in the presence of strong magnetism. However, observational data of the strongest magnetic and fast rotating gravity-mode B-type pulsator points to a clear dominance of the Coriolis acceleration over the Lorentz force (Buysschaert et al. 2018). Moreover, as we show below, rotation at 16% of the critical rate is low compared to the internal rotation frequencies inferred for most F- and B-type pulsators. We currently lack observational estimates of the internal magnetic field strenghts of dwarfs with a convective core, while they should be detectable from gravito-inertial modes (Van Beeck et al. 2020).
Because the interaction of rotation and convection impacts the properties of the magnetic dynamo, convective penetration, and wave excitation and may lead to more rotationally constrained regimes (Augustson et al. 2019, 2020; Augustson & Mathis 2019), it is worthwhile to reconsider 3D MHD simulations for the best setup guided by asteroseismic constraints. Our current paper has the aim to provide such observational input for future simulations. This input is derived from asteroseismic models based on identified prograde modes detected in Kepler space photometry of carefully selected pulsators. Their resonant modes allow for the derivation of three important local time scales connected with the phenomena of convection, buoyancy, and rotation in and near the convective core of these pulsators. We discuss the sample of pulsators used in this work in Sect. 2 and introduce the relevant properties of their asteroseismic models in Sect. 3. Section 4 is devoted to the derivation of Rossby numbers and interface stiffness values, which are important input quantities for numerical simulations. We evaluate these observables in terms of theoretical predictions for convective penetration and GIW fluxes in Sect. 5. We discuss the potential rotational and magnetic states of the convective core in Sect. 6 and come to conclusions in Sect. 7.
2. The sample and its near-core rotation rates
Before discussing the Kepler sample used in our study, it is worthwhile to recall the broad frequency regime covered by gravity-mode asteroseismology of dwarfs from the earliest space-based studies. The anticipated opportunity of exploiting such modes (e.g., Aerts et al. 2010) was turned into practice by Degroote et al. (2010). These authors discovered a period spacing pattern in the slowly rotating B3V star HD 50230 from its 5-month light curve assembled with the CoRoT space telescope (Auvergne et al. 2009). The detected pattern of period spacings of eight dipole modes of consecutive radial order for this star is almost constant because it is an exceptionally slow rotator for a B-type star. Because of this, each of its modes can be described in terms of a spherical harmonic with degree l and azimuthal order m, while the radial order n denotes the overtone. For such a slow rotator, the mode frequencies cover a limited range. The detected period spacing pattern of HD 50230 is fully in line with the theoretical predictions for non-rotating stars by Tassoul (1980) and Miglio et al. (2008). Asteroseismic modelling ignoring the Coriolis acceleration is appropriate for this star and allowed for the derivation of its mass, age, and near-core envelope mixing from the small periodic deviations in the detected pattern (Degroote et al. 2010). These results have meanwhile been confirmed from a more detailed independent analysis by Wu & Li (2019), who found the level of extra mixing in the radiative envelope to be well described by a diffusion coefficient of Dmix ≃ 103.8 cm2 s−1 for this exceptionally slow rotator among B-type gravity-mode pulsators (Pedersen et al. 2021). The CoRoT mission was also a pioneer in the discovery of stochastic gravito-inertial modes subjected to the strong Coriolis acceleration in the rapidly rotating Be star HD 51452 (Neiner et al. 2012). In that case, the frequencies in an inertial reference frame were spread across a large range and led to an assessment of convective penetration for that star.
These two early CoRoT applications revealed that gravity and gravito-inertial mode asteroseismology covers rotational frequencies from almost zero to almost the critical rate of the pulsators. For rapid rotators, the angular dependence of each mode can no longer be expressed by a single spherical harmonic. Rather, the eigenfunctions under the TAR are described by Hough functions. Lee & Saio (1997) introduced a convenient labeling system to treat gravito-inertial modes and Rossby modes by one set of indices (k, m), with k = l − |m|≥0 for gravito-inertial modes and k < 0 for Rossby modes. The potential of any asteroseismic inference is completely determined by the ability to label each observed eigenfrequency with the (k, m, n) of the mode causing it. This is challenging when the Coriolis acceleration cannot be ignored, as is the case for the gravito-inertial modes. Achievement of proper mode identification and labeling from light curves that cover only a few months (as in the CoRoT case) is difficult for fast rotators, particularly for stochastic modes. For this reason, we here limit ourselves to pulsators for which identification of (k, m) has been achieved without any ambiguity. Such is the case for a sample of gravity and gravito-inertial pulsators with resonant modes discovered from the 4-year Kepler (Koch et al. 2010) light curves. Thanks to the long time base of 4 years, these light curves are so far the best suited ones to reveal gravity-mode period spacing patterns caused by resonant modes.
Once period spacing patterns are recognised, they offer an optimal tool to identify the (k, m) values of the modes from asymptotic relationships valid for high-order gravity modes treated in the TAR (Bouabid et al. 2013; Van Reeth et al. 2016)1. Many such period spacing patterns have been detected from Kepler light curves for both F-type γ Dor pulsators (e.g., Van Reeth et al. 2015; Li et al. 2019, 2020) and slowly pulsating B (SPB hereafter) stars (e.g., Pápics et al. 2017; Szewczuk et al. 2021; Pedersen et al. 2021). As we rely on properties of forward asteroseismic models for our research, we restrict ourselves here to those γ Dor and SPB stars that have meanwhile been followed up and analysed in a homogeneous way from high-resolution spectroscopy and Gaia DR2 astrometry (Gebruers et al. 2021) and for which forward asteroseismic modelling of their identified modes has been done. These requirements are fulfilled for 37 γ Dor stars (Mombarg et al. 2019, 2021) and 26 SPB stars (Pedersen et al. 2021). These studies revealed best forward models with low values of extra turbulent envelope mixing for the 37 γ Dor stars (Dmix < 10 cm2 s−1) while a wide variety of such extra mixing was derived for the 26 SPB stars (with diffusion coefficients Dmix between roughly 10 and 106 cm2 s−1). For these SPB stars, the inferred Dmix values are mildly correlated with the near-core rotation frequency (Pedersen et al. 2021).
Various methods have been developed to deduce the near-core rotation rates, denoted here as Ωrot ≡ 2πνrot, from the slope of detected period spacing patterns of identified modes (Van Reeth et al. 2016; Ouazzani et al. 2017; Christophe et al. 2018; Takata et al. 2020), all of which leading to consistent results (e.g., Ouazzani et al. 2019, for a comparison). Here, we rely on the method originally designed by Van Reeth et al. (2016) and meanwhile updated with the improved asymptotic expressions for the eigenvalues of Laplace’s tidal equations by Townsend (2020). It is noteworthy that gravito-inertial modes have their dominant probing power in the transition region between the convective core and the radiative envelope and therefore lead to stellar properties that are most optimally and quite robustly determined in that transition region (e.g., Aerts 2021, for a general review on the probing power of various types of modes). Envelope and/or surface rotation frequencies are also available for some gravity-mode pulsators (Kurtz et al. 2014; Saio et al. 2015; Triana et al. 2015), revealing low levels of differentiality of a few percent. Because ratios between envelope and (near-)core rotation are not yet available for many stars (Aerts et al. 2019, for an overview) and given that we focus on rotating core convection and the transition layer towards the radiative envelope, we use the rotation rates deduced for the near-core region of the stars in the rest of this paper.
The near-core rotation frequencies Ωrot and spin parameters, 2Ωrot/ωn, l, m with ωn, l, m the angular mode frequencies in the co-rotating frame of reference, were already deduced for the 37 γ Dor stars considered here (Aerts et al. 2017). Pedersen et al. (2021) took the modelling approach one step further, using the values of Ωrot derived from the method by Van Reeth et al. (2016) as initial estimate to optimise its value from a 7D modelling framework following Aerts et al. (2018). The values obtained by Pedersen et al. (2021) are used for the 26 SPB stars in our sample, while we took their spin parameters from the follow-up study by Pedersen (2021). We note that several of these 26 SPB stars and most of the 37 γ Dor stars have spin parameters too high to represent their eigenfunction by the single spherical harmonic  . This spherical harmonic component delivers the dominant contribution to the Hough eigenfunction for spin parameters up to ≈7. Nevertheless, these low-frequency prograde modes have been called ‘dipole’ prograde modes for simplicity in the recent literature.
The cyclic near-core rotation frequencies, νrot, of the 63 gravity-mode pulsators in our sample are shown in Fig. 1, where they are compared with the maximum of the cyclic buoyancy frequency profile in the transition layer between the convective core and the radiative envelope (Nmax). The ratios Nmax/2νrot deduced from Fig. 1 range from 5.2 to 223 for the SPB pulsators and from 8.1 to 666 for the γ Dor stars, with median values of 28 and 68, respectively. We use these values in Sect. 4 to compute the Rossby numbers but for now point out that the 63 stars in our sample cover the entire core-hydrogen burning phase. Moreover, the cyclic near-core rotation frequencies shown in Fig. 1 range from almost zero (nonrotating case) to the critical rotation frequency (see Mombarg et al. 2021; Pedersen et al. 2021, for detailed discussions of these coverages and relationships between derived properties and evolutionary status). It is noteworthy to recall that the critical rotation frequencies of our target stars have been derived in the simplistic Roche model, which assumes that the potential of the star can be computed as if its entire mass is concentrated at the stellar centre (e.g., Georgy et al. 2013). However, the sample stars rotating close to their critical rate are quite deformed due to the centrifugal acceleration. Despite this, all the 63 stars in our sample were modelled with the TAR in its original form, which neglects the centrifugal deformation. Future improvements can be made from the recent TAR upgrades for moderate to strong deformation by Mathis & Prat (2019), Henneco et al. (2021), Dhouib et al. (2021a, b).
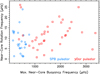 |
Fig. 1. Near-core rotation frequencies versus the maxima of the buoyancy frequency profile in the transition region region between the convective core and the radiative envelope (cf. Fig. 2) for a sample of 37 γ Dor (red squares) and 26 SPB (blue circles) pulsators. |
3. Properties of gravito-inertial asteroseismic models
The modelling of gravity and gravito-inertial modes and waves is already described in detail in the literature (Aerts 2021, for a review). We stress the importance of including the Coriolis acceleration in the modelling, in order to get meaningful results for the majority of observed gravity-mode pulsators. Because this is sometimes ignored in recent studies (e.g., Wu et al. 2018; Lecoanet et al. 2019), we recall that considering the Coriolis acceleration as a small perturbation already breaks down for projected surface rotation velocities of v sin i ≃ 30 km s−1 (Schmid & Aerts 2016).
Based on the subinertial nature of most of the detected gravity modes (Aerts et al. 2017), asteroseismic forward modelling frameworks relying on the TAR were developed and applied to rotating dwarfs (e.g., Moravveji et al. 2016; Van Reeth et al. 2016; Aerts et al. 2018; Szewczuk & Daszyńska-Daszkiewicz 2018; Mombarg et al. 2019). Here, we rely on the best forward models based on the TAR available for the 63 stars in our sample. These are taken from the sample studies by Mombarg et al. (2021) and Pedersen et al. (2021). The γ Dor stars in this sample were so far only modelled with diffusive overshooting adopting the radiative temperature gradient in the overshoot zone. As discussed in Mombarg et al. (2019) and Mombarg et al. (2021) it was not possible to discriminate between a step or exponentially decaying overshooting prescription in the transition layer between the core and the envelope. Moreover, the values of the diffusive mixing coefficient in the envelope beyond the overshoot zone as probed by the gravity and gravito-inertial modes are very low (Dmix below 10 cm2 s−1) for these pulsators when ignoring radiative levitation and shear instabilities. On the other hand, discrimination between convective penetration and diffusive overshooting was achieved for the SPB stars by Pedersen et al. (2021). These authors inferred high values of the mixing coefficient in the radiative envelope of such pulsators, spanning five orders of magnitude for the 26 stars. We show the buoyancy profiles in the inner part of these 63 best asteroseismic stellar models in Fig. 2. It is seen from these profiles that the sample covers a wide variety of stars in terms of evolutionary stage, where several stars have strongly receded convective cores that have left behind broad molecular weight gradient zones contributing to the buoyancy profile. On the other hand, some of the γ Dor stars are in the mass regime and evolutionary stage where they have growing convective cores (Mombarg et al. 2019). We already used the maxima of the profiles shown in Fig. 2 to construct Fig. 1.
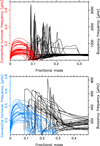 |
Fig. 2. Profiles of the cyclic buoyancy frequency (in black; right y axis) and of the cyclic characteristic convective turnover frequency (coloured; left y axis) in the transition region between the core and the radiative envelope of the 37 γ Dor stars (upper panel) and 26 SPB stars (lower panel) plotted as a function of fractional mass. |
Further, we show in Fig. 2 the profiles of the characteristic frequency of convection in the core deduced from the overall estimation of the diffusive mixing coefficient and the adopted mixing length parameter. The characteristic convective frequency shown in Fig. 2 was computed as
 (1)
(1)
where vconv is the local convective velocity and ℓMLT = αMLT ⋅ Hp is the local length scale over which the fluid elements travel before dissolving, when adopting the mixing length theory of convection (Böhm-Vitense 1958) with Hp the local pressure scale height. For the γ Dor stars, the value of the mixing length parameter, αMLT was taken to be 1.73 (Choi et al. 2016). This is the solar value for the frozen envelope input physics adopted by Mombarg et al. (2021) in their modelling of the γ Dor stars in our sample. Pedersen et al. (2021) took a value of αMLT = 2.0 for the SPB stars given that their input physics adopted for the envelope mixing is not meaningful as physical ingredient for solar-scaled models. This value of 2.0 is a typical value for intermediate-mass stars deduced from the red edge of the classical instability strip based on time-dependent convection in comparison with δ Sct pulsators (Dupret et al. 2005). The temperature gradient in the convective core is essentially the adiabatic one, hence the size of the convective core is insensitive to the value of αMLT. This is also the case for the size and the structure of the radiative envelope, where the gravito-inertial waves propagate. Moreover, the value of αMLT in the convective core cannot be calibrated from gravity or gravito-inertial modes computed within the TAR, because these modes do not propagate in the core. This inability was demonstrated by both Aerts et al. (2018) and Johnston et al. (2019), who showed that changing from αMLT = 1.0 to αMLT = 2.2 leads to stellar models with indistinguishable mode frequencies for 1-year light curves and buoyancy travel times (Π0), respectively. A potential way to estimate αMLT could be to adopt a non-TAR treatment of GIWs for which subinertial GIWs convert into propagative inertial waves in the convective core (Dintrans & Rieutord 2000; Ouazzani et al. 2020; Saio et al. 2021).
From Fig. 2 we extracted the maximum value of the characteristic frequency of convection for each of the stars. The values range from 0.17 to 0.49 μHz for the SPB stars and from 0.062 to 0.264 μHz for the γ Dor stars. We stress that these characteristics frequencies are model dependent and are determined by the adoption of the mixing-length theory. These values result from the best available forward asteroseismic model of the 63 pulsators, assuming the mixing length theory of convection with the most reasonable values for αMLT. This does not exclude the existence of other stellar models with a different value of αMLT that are also capable of fitting the observed and identified modes in these stars.
4. Rossby numbers and interface stiffness values
Rossby numbers constitute key quantities for simulations and theoretical predictions of wave spectra and properties (Augustson et al. 2020). Figure 3 shows the wave Rossby numbers, defined as the inverse spin parameters
 (2)
(2)
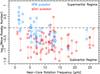 |
Fig. 3. Wave Rossby numbers computed as the inverse of the spin parameters for the sample stars. For each of the stars, the minimal and maximal wave Rossby numbers of the identified low-frequency prograde modes of each star are connected by a dotted vertical line. The horizontal dashed line distinguishes the superinertial and the subinertial regime of the waves. |
of the sample stars. In practice, we took all the identified low-frequency prograde modes occurring in the period spacing patterns detected by Van Reeth et al. (2015) for the γ Dor stars and by Pedersen et al. (2021) for the SPB stars. For all these identified modes, we computed the frequency in the corotating frame from the star’s rotation frequency Ω deduced from the forward modelling by Van Reeth et al. (2016) and Pedersen et al. (2021), respectively. This leads to a list of spin parameters per star based on each of its identified modes. These spin parameters were already computed by Aerts et al. (2017) for the γ Dor stars and were taken from Pedersen (2021) for the SPB stars. In Fig. 3 we connected the lowest and highest of all the Rossby numbers per star by a dotted vertical line segment. These line segments are hence observables based on the minimal and maximal spin values of the identified low-frequency prograde modes for each of the stars in our sample. This covered range of wave Rossby numbers per star is plotted against the near-core rotation frequency per star. Figure 3 illustrates that almost all modes in the γ Dor stars are subinertial. The detection of such modes could be an asset to probe the possibly differential rotation in the core (Ouazzani et al. 2020; Saio et al. 2021), but this potential has yet to be put into practice. For the SPB stars about half of the modes are superinterial and half subinertial. This, along with lower rotational frequencies, led to Rossby modes being detected in the γ Dor stars (Van Reeth et al. 2016; Saio et al. 2018) but not in the SPB stars (Pedersen et al. 2021).
Aside from the wave Rossby numbers, we also computed the convective Rossby numbers. Given that our work relies on the outcome of forward asteroseismic modelling, we approximate the convective Rossby numbers as
 (3)
(3)
and show their values in comparison with the wave Rossby numbers in Fig. 4. This figure reveals that the two groups of stars occupy somewhat different regions, with the γ Dor stars having lower convective Rossby numbers than the SPB stars. Following Augustson et al. (2020), this makes it harder for GIWs to get excited with strong flux at the core/envelope interface for γ Dor stars compared to SPB stars. This conclusion does not change if we compute the convective Rossby numbers from an average value of the characteristic convective turnover frequency in the core region rather than taking its maximum value inside the core. Such averaging roughly lowers this characteristic turnover frequency by a factor of two, implying a shift in the convective Rossby numbers (plotted as x-values) of about −0.3. In this sense, Fig. 4 provides an upper limit of the convective Rossby numbers under the assumption that core convection is well described by mixing length theory with the adopted mixing length scale.
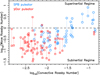 |
Fig. 4. Wave Rossby numbers plotted against the convective Rossby numbers computed as |

Following Augustson et al. (2020), we define the stiffness, S, at the interface between the convective core and the radiative envelope to be the ratio of the maximum of the buoyancy frequency outside of the convective core (cf. Fig. 2) and the maximum characteristic convective turnover frequency in the core. Other studies use the terminology of bulk Richardson number for this dimensionless quantity instead of stiffness (e.g., Cristini et al. 2019; Scott et al. 2021). We show the values of S for the 63 stars in our sample in Fig. 5. The γ Dor pulsators have higher stiffness values (roughly between 3000 and 35 000) than the SPB stars (roughly between 500 and 4000). These stiffness values are in line with those considered by Augustson et al. (2020, their Fig. 6) in their prediction of the local flux of GIWs triggered by the rotating convection in their models of intermediate-mass stars, as discussed in the next section.
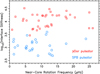 |
Fig. 5. Ratio of the buoyancy frequency in the stable region to the convective turnover frequency in the convective core (interface stiffness) plotted as a function of the near-core rotation frequency for the sample of gravito-inertial pulsators. |
5. Theoretical predictions for convective penetration and gravito-inertial wave flux
5.1. Sizes of convective penetration zones
In principle, gravity modes offer good probing power to assess the mass and the thermal and chemical properties of the transition layer between the convective core and the radiative envelope (Pedersen et al. 2018; Michielsen et al. 2019). The theory of convective penetration developed by Augustson & Mathis (2019) predicts the penetration depth from the core into the envelope to increase with the convective Rossby number as  . We are able to verify this result observationally by considering the gravity-mode pulsators whose best models are based on convective penetration. At present, none of the γ Dor stars have been modelled with convective penetration as it turned out to be difficult to distinguish between different temperature gradients and mixing prescriptions in the transition layer between the convective core and radiative envelope for these pulsators (Mombarg et al. 2019, 2021). The SPB pulsators studied by Pedersen et al. (2021) do offer a good test case as they have been modelled considering eight grids of equilibrium models based on different input physics. Four of these grids are based on convective penetration with the adiabatic temperature gradient in the transition zone between core and envelope, whereas the other four grids use diffusive overshooting, which adopts the radiative temperature gradient in that zone. This study revealed 17 of the 26 SPB stars to have their gravity modes best explained by models with convective penetration.
We computed the sizes of the penetration zones for these 17 SPB stars from their best asteroseismic model and evaluate their relation to Roc. The results are shown in Fig. 6, where the symbol sizes scale linearly with the near-core rotation frequency of the stars. The dotted line is the best univariate linear regression fit and the grey area indicates its uncertainty region. It can be seen that the predictive power of this linear model is limited. We also computed a bivariate linear fit by adding the near-core rotation frequency as covariate but this did not lead to a better model when adopting the Bayesian Information Criterion as model selection tool (Claeskens & Hjort 2008). The full line in Fig. 6 represents a linear fit relying on the prediction from the theory in Augustson & Mathis (2019) with a slope fixed at 3/10 and is in agreement with the observational trend to within the uncertainties.
 |
Fig. 6. Size of the penetration zone plotted as a function of convective Rossby number for the 17 SPB pulsators in Pedersen et al. (2021) whose best forward asteroseismic model is based on convective penetration (the symbol sizes scale linearly with the near-core rotation frequency, where the legends list the lowest and highest values). The full line represents the expected relationship according to the theory by Augustson & Mathis (2019), with a slope fixed at 3/10 and the intercept calibrated by the 17 observed stars. The dotted line represents the best linear fit, with its uncertainty region indicated in grey. |
In order to limit the dimensionality of the challenging forward modelling problem, Pedersen et al. (2021) fixed the efficiency of the mixing accompanying the penetration according to the diffusion coefficient inside the convective core, close to its inner boundary. We thus do not yet have any estimate of this mixing efficiency as it has been fixed to a reasonable value. Figure 6 hints towards stars with lower convective Rossby numbers and faster rotation having their fluid elements originating from within the core penetrate less deep into their envelope and thus experiencing less element transport in that transition zone. Given the current limited sample size, however, this cannot be but considered a hint that needs further investigation from a much larger sample, taking into account the variability in mass, radius, and evolutionary stage across the sample.
5.2. Wave flux predictions
From an observational point of view, we can only assess the GIW flux at the surface of the star. Since the variability of the 63 pulsators in our sample is dominated by coherent resonant modes, we first have to prewhiten all signal due to such significant and resolved modes before hunting for GIWs signals. This prewhitening has been done under the assumption that the resonant modes have infinite lifetime, constant amplitude, and constant phase, as is the common treatment for heat-driven modes. Stochastic GIWs are damped and thus have shorter lifetimes than the resonant modes of the star, implying Lorentzian-shaped frequency peaks in the amplitude spectrum, instead of the sharp delta peaks due to the resonant modes. Moreover, GIWs have time-variable amplitudes and phases. During the prewhitening process, any stochastic GIWs with significant amplitudes according to a chosen significance criterion will also get extracted and prewhitened, but with a wrong mathematical functionality. This leaves signal from their Lorentzian wings in the residual light curve.
In order to assess if stochastically excited GIWs could be present in our sample stars, we take a conservative approach. We rely on the residual light curves of the 37 γ Dor stars computed by Van Reeth et al. (2015). For the 26 SPB stars, we take the residual light curve after prewhitening from the method that gave the highest scaled fractional variance among the five methods exploited by Van Beeck et al. (2021). We compute the amplitude spectra of these 63 residual light curves. The signal left in those residual amplitude spectra may be caused by several phenomena, such as unresolved resonant modes, resonant modes with time-variable amplitudes (e.g., due to non-linear mode couplings), leftover signal of the poorly prewhitened damped GIWs, spots subject to differential surface rotation, magnetic activity, instrumental effects, etc. For the purpose of assessing whether the leftover signal may be a manifestation of GIWs at the stellar surface, we rely on the maximum amplitude in the residual spectrum for each of the 63 stars. Since there is no good way to predict the amplitudes of heat-driven resonant coherent modes, we compute the ratio of the largest-amplitude signal in the residual spectrum, Ares, to the largest-amplitude coherent mode, Acoh. This ratio Ares/Acoh covers the interval [0.09, 3.64]% for the 37 γ Dor stars and suggests that these pulsators do not reveal strong residual surface GIW flux variations compared to those of the prewhitened modes or waves. For the SPB stars, however, Van Beeck et al. (2021) found 4 of the 26 SPB stars to have light curves with outbursts, similar to those observed in pulsating Be stars and interpreted in terms of GIWs (e.g., Neiner et al. 2012, 2020). Following Van Beeck et al. (2021) we divide the 26 SPB pulsators into three groups: (a) 13 SPB stars for which the significant coherent modes with constant amplitude and frequency gave a good fit to the measured light curve; these have Ares/Acoh ∈ [0.97, 13.79]%; (b) 4 SPB stars with Be-like outbursts due to modes with time-variable behaviour, in addition to coherent modes with constant amplitude in their light curve; these have Ares/Acoh ∈ [18.92, 59.04]%; (c) 9 SPB stars with unresolved large-amplitude coherent modes left in the residuals; for those we cannot derive a proper estimate for any residual GIW flux variability at the surface.
Although we have only 17 SPB stars for which we can deduce a meaningful estimate of possible residual stochastic GIWs at the surface, a trend occurs. The residual amplitude of the 13 non-outbursting SPB stars with resolved modes is limited to less than 14% of the dominant resonant-mode amplitude; these 13 stars cover rotation rates between 4% and 88% of the critical rate. The four outbursting SPB stars rotate between 72% and 96% of their critical rate and their residual amplitude is a considerable fraction (up to 59%) of the significant prehwitened modes/waves. This suggests that outbursting SPB stars have variability that is partly due to time-dependent amplitudes and/or frequencies and may point to the co-existence of resonant modes driven in their envelope and GIW triggered locally by the rotating convective core and surviving radiative damping while travelling to the surface, as suggested for outbursting Be pulsators (Neiner et al. 2020).
To get a first physical understanding of these observational results, we revisited the theoretical work by Augustson et al. (2020). They studied the stochastic excitation of GIWs by the Reynolds stresses in turbulent rotating convective regions as a function of the convective Rossby number and of the stiffness of the convective/radiative interface. Using their model, we computed the GIW flux (Fz) normalised by the gravity-wave flux in the non-rotating case (F0) for values of the stiffness typical of SPB stars (i.e. S = 103) and of γ Dor stars (i.e. S = 104). The results are shown in the left and right panels of Fig. 7, respectively. For convective Rossby numbers observed for SPB stars (Roc between 10−2.3 and 10−0.8), we see that the ratio of the wave flux can vary between 10−5 and 105. This opens the path to observe stochastically excited GIWs at the surface of these stars if those waves can propagate through the near-surface layers. For convective Rossby numbers observed for γ Dor stars (Roc between 10−3 and 10−1.5), we find that the ratios of the wave fluxes are often below unity, making a detection for such stars more difficult, except for stars that rotate slowly such that Roc ≳ 10−2. About one third of our sample of γ Dor stars fall between this lower bound and Roc ∼ 10−1.5. Thus, according to the local Cartesian analytical model with a monochromatic wave excitation by small-scale turbulent convective Reynolds stresses derived in Augustson et al. (2020), subinertial GIWs could have sufficient energy flux to be observed with an amplitude between 1 and 100 times the one expected for pure gravity waves. These trends are in good agreement with observations (Bowman et al. 2019a,b, 2020). To confirm these results, however, devoted theoretical predictions and numerical simulations in spherical geometry should be computed, building on relevant work such as Edelmann et al. (2019) and Neiner et al. (2020) and using the calibrated stiffness parameters and Rossby numbers as calibrated in this work.
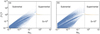 |
Fig. 7. Scaling of the gravito-inertial wave flux Fz, normalised by the gravity wave flux for the non-rotating case F0, when excited by columnar convection at the equator for waves. The stiffness adopted in the theory by Augustson et al. (2020), defined as the ratio of the buoyancy frequency to the convective overturning frequency (S = NR/N0 in their notation) is approximated here by Nmax/2νrot from Fig. 1 and taken to be (a) 103 for the SPB stars (left panel), (b) 104 for the γ Dor stars (right panel) as found from Fig. 5. The vertical dashed line denotes the transition between subinertial and superinertial regime placed at a convective Rossby number of |

6. Differential rotation and magnetic field in the convective core
Rotational properties of convective cores can in principle be probed thanks to subinertial gravito-inertial modes, which become propagative inertial modes (Ouazzani et al. 2020; Saio et al. 2021). Following this recently discovered potential, it is interesting to discuss the expected differential rotation and magnetic states of convective cores. For stars with convective Rossby numbers below unity, turbulent (magneto-)convection should be strongly constrained by rotation. In such a configuration, the differential rotation is expected to be mostly cylindrical because of the so-called Taylor-Proudman constraint (cf. Garaud & Acevedo Arreguin 2009). In addition, the degree of differential rotation should decrease with increasing strength of the magnetic field (Brun et al. 2005; Augustson et al. 2016).
Adopting such a framework, we provide estimates of the strength of the magnetic field triggered by the dynamo action due to the turbulent interaction of rotating convection and the magnetic field. On the one hand, in the regime where the convective Rossby number is below unity, we expect the field to be generated in the magnetostrophic regime, where the Lorentz force balances the Coriolis acceleration as formalised by Augustson et al. (2019). This is seen in numerical simulations such as those by Featherstone et al. (2009) and Augustson et al. (2016), as well as in the simulations of rotating convective dynamos described in Augustson et al. (2019), Calkins et al. (2021), and Orvedahl et al. (2021). On the other hand, the dynamos could be in a subequipartition or equipartition regime, where the magnetic and kinetic energies are proportional to each other, that is a state like the one in which the Sun appears to be (Brown et al. 2011; Augustson et al. 2015; Brun & Browning 2017).
Applying dynamo scaling laws as derived by Augustson et al. (2019), that is  and
and  , we find peak magnetic field intensities driven by a sconvective dynamo action in the stellar cores ranging from 20 to 400 kG in the SPB stars and from 0.1 to 3 MG in the γ Dor stars, as illustrated in Fig. 8. Such core magnetic fields are likely hidden from the surface for two reasons: (a) rapid drop off of the magnetic field is expected to be induced by small-scale currents, which decay approximately as
  , where rcc is the convective core radius, r the local radius outside the core, and ℓ the angular degree of the sectoral mode approximating the morphology of the convection. This result is obtained via a multipolar expansion of the integral form of the Maxwell equations (e.g., Jefimenko 1992); (b) even if loops of the field can escape, they will take a significant fraction of the lifetime of the star to reach the surface (e.g., MacGregor & Cassinelli 2003). However, pulsations propagating in the core are expected to be impacted by such a field and may offer the opportunity to get detected via magnetically induced frequency splittings (Prat et al. 2019; Mathis et al. 2021), which is the subject of an ongoing study (Augustson & Mathis, in prep.).
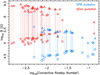 |
Fig. 8. Estimates of the magnetic field following equipartition ( |

7. Conclusions
Our work provides stringent asteroseismic calibrations of key quantities that are usually included as free parameters in 3D numerical simulations of stellar interiors. The asteroseismic calibrations are delivered by detected and identified low-frequency prograde gravito-inertial modes deduced from Kepler space photometry. These modes are direct and unique probes of the core/envelope interface region in rotating dwarfs. Previous studies of asteroseismic calibrations for Rossby numbers so far focused on pressure modes detected in slowly rotating low-mass sun-like stars. The latest study by Corsaro et al. (2021) revealed envelope convective turnover time scales of low-mass dwarfs between ∼10 and ∼55 days. These estimates resulted from taking averages over the entire slowly rotating convective envelope and using asteroseismic scalings by mass, radius, and luminosity while also relying on colours of the stars. This led to convective Rossby numbers roughly between 0.05 and 0.5 (we note that we use a different definition of Rossby numbers by a factor two in this paper, as we rely on the expression and definition derived from the momentum equation). Our study focused on a completely different regime of the parameter space. Moreover, we provide a direct localised estimate of Rossby numbers from identified prograde modes, which probe the physical properties in the transition region between the convective core and the radiative envelope of rapidly rotating stars. Our sample, covering masses from 1.3 to 9 M⊙ and rotation rates from almost zero to the critical rate, leads to convective Rossby numbers roughly between 0.002 for the fastest rotators and 0.15 for the slowest rotators.
Asteroseismic modelling so far revealed that γ Dor stars have lower levels of envelope mixing than SPB stars (Aerts 2021, Table 1, for a summary). While this result needs further scrutiny by including both shear mixing (as has been done for the SPB stars, see Pedersen et al. 2021) and radiative levitation (Mombarg et al. 2020) in the envelope of γ Dor stars, this result is consistent with our current findings. Indeed, the inferred Rossby numbers derived from asteroseismic modelling reveals that the local GIW flux at the convective core boundary expected for SPB stars can reach higher values than the ones anticipated for γ Dor stars (see Fig. 7 and also Augustson et al. 2020, Fig. 6). If, aside from angular momentum transport, GIWs are also (partly) responsible for the transport of chemical elements in the stellar envelope as derived by Rogers & McElwaine (2017), it is more efficient for SPB stars than for γ Dor stars. This is exactly what asteroseismic inferences from observations show. In addition, we have demonstrated that the convective penetration length as a function of the convective Rossby number as predicted in Augustson & Mathis (2019) is in good agreement with the results found from the best forward asteroseismic models for the 17 SPB stars in our sample for which Pedersen et al. (2021) found penetration to be the better explanation than diffusive exponentially decaying core overshooting.
Augustson & Mathis (2019) provided the first coherent theoretical description of convective penetration while taking into account the Coriolis acceleration. This formalism meanwhile provided a good explanation for the mixing of light elements such as Lithium in low-mass stars (Dumont et al. 2021a,b). Here, we conclude in addition that this theory of rotating convection along with its accompanied predictions for convective penetration (Augustson & Mathis 2019) and GIW stochastic excitation (Augustson et al. 2020) is also in agreement with asteroseismically calibrated Rossby numbers, stiffness values, and levels of envelope mixing inferred from gravity-mode pulsators (Mombarg et al. 2021; Pedersen et al. 2021). Our results clearly demonstrate the need to take into account the Coriolis acceleration in stellar modelling, while it has so far mostly been ignored in state-of-the-art structure and evolution models of rotating stars. We therefore suggest to include these theories and their asteroseismically calibrated parameter values as provided here in new generations of stellar evolution models (e.g., Rieutord & Espinosa Lara 2013; Gagnier et al. 2019).
Finally, thanks to the convective Rossby numbers calibrated from GIW asteroseismology as done in this work, we open new windows to probe the rotational and magnetic properties of rotating convective cores. Indeed, it is highly probable that rapid rotators have cylindrical differential rotation whose contrast will depend on the strength of dynamo-generated magnetic fields. We predict amplitudes for such fields ranging from 20 to 400 kG for SPB stars and from 0.1 to 3 MG for γ Dor stars. Such high-amplitude magnetic fields should be detectable via asteroseismology (Prat et al. 2020; Van Beeck et al. 2020; Mathis et al. 2021; Bugnet et al. 2021).
We recall that the TAR assumes the restoring buoyancy force to be much stronger than the Coriolis acceleration in the direction of the stable entropy and chemical stratifications. This allows the wave equation to become separable while this is not the case in general (e.g., Dintrans & Rieutord 2000; Mathis et al. 2014). The TAR has been confronted with direct 2D computations of adiabatic oscillation modes (Ouazzani et al. 2017). This has proven its robustness when probing the rotation of the radiative envelope, while it should be abandoned when determining the rotation inside the convective core (Ouazzani et al. 2020; Saio et al. 2021) and evaluating stochastically excited GIWs (Mathis et al. 2014; Neiner et al. 2020).
Acknowledgments
The research leading to these results has received funding from the European Research Council (ERC) under the European Union’s Horizon 2020 research and innovation programme (grant agreements N°670519: MAMSIE with PI Aerts and N°647383: SPIRE with PI Mathis) and from the KU Leuven Research Council (grant C16/18/005: PARADISE). C.A. acknowledges support from the BELgian federal Science Policy Office (BELSPO) through a PRODEX grant for the ESA space mission PLATO, while S.M. acknowledges support from the CNES PLATO grant at CEA/DAP. This research was supported in part by the National Science Foundation under Grant No. NSF PHY-1748958. T.V.R. and J.S.G.M. gratefully acknowledge support from the Research Foundation Flanders (FWO) under grant agreements 12ZB620N and V429020N, respectively. The authors are thankful to Tami Rogers and her group for interesting and stimulating discussions during biannual informal workshops among the Leuven, Saclay, and Newcastle teams the past years. C.A. also acknowledges useful discussions with Raphael Hirschi, Dave Arnett, Daniel Lecoanet, and Matteo Cantiello, as well as helpful comments on the draft paper prior to submission from Dominic Bowman and Cole Johnston. We appreciate the positive comments received from the referee and the suggestion to use a more appropriate terminology for the gravito-inertial mode identification.
References
- Aerts, C. 2021, Rev. Mod. Phys., 93, 015001 [Google Scholar]
- Aerts, C., Christensen-Dalsgaard, J., & Kurtz, D. W. 2010, Asteroseismology (Heidelberg: Springer-Verlag) [Google Scholar]
- Aerts, C., Van Reeth, T., & Tkachenko, A. 2017, ApJ, 847, L7 [Google Scholar]
- Aerts, C., Molenberghs, G., Michielsen, M., et al. 2018, ApJS, 237, 15 [Google Scholar]
- Aerts, C., Mathis, S., & Rogers, T. M. 2019, ARA&A, 57, 35 [Google Scholar]
- Alvan, L., Brun, A. S., & Mathis, S. 2014, A&A, 565, A42 [NASA ADS] [CrossRef] [EDP Sciences] [Google Scholar]
- Alvan, L., Strugarek, A., Brun, A. S., Mathis, S., & Garcia, R. A. 2015, A&A, 581, A112 [NASA ADS] [CrossRef] [EDP Sciences] [Google Scholar]
- André, Q. 2019, PhD Thesis, Université Paris-Saclay, Université Paris Diderot, Sorbonne Paris Cité, France [Google Scholar]
- Augustson, K. C., & Mathis, S. 2019, ApJ, 874, 83 [Google Scholar]
- Augustson, K., Brun, A. S., Miesch, M., & Toomre, J. 2015, ApJ, 809, 149 [Google Scholar]
- Augustson, K. C., Brun, A. S., & Toomre, J. 2016, ApJ, 829, 92 [Google Scholar]
- Augustson, K. C., Brun, A. S., & Toomre, J. 2019, ApJ, 876, 83 [Google Scholar]
- Augustson, K. C., Mathis, S., & Astoul, A. 2020, ApJ, 903, 90 [NASA ADS] [CrossRef] [Google Scholar]
- Auvergne, M., Bodin, P., Boisnard, L., et al. 2009, A&A, 506, 411 [NASA ADS] [CrossRef] [EDP Sciences] [Google Scholar]
- Böhm-Vitense, E. 1958, ZAp, 46, 108 [NASA ADS] [Google Scholar]
- Bouabid, M. P., Dupret, M. A., Salmon, S., et al. 2013, MNRAS, 429, 2500 [Google Scholar]
- Bowman, D. M., Aerts, C., Johnston, C., et al. 2019a, A&A, 621, A135 [NASA ADS] [CrossRef] [EDP Sciences] [Google Scholar]
- Bowman, D. M., Burssens, S., Pedersen, M. G., et al. 2019b, Nat. Astron., 3, 760 [Google Scholar]
- Bowman, D. M., Burssens, S., Simón-Díaz, S., et al. 2020, A&A, 640, A36 [NASA ADS] [CrossRef] [EDP Sciences] [Google Scholar]
- Brown, B. P., Miesch, M. S., Browning, M. K., Brun, A. S., & Toomre, J. 2011, ApJ, 731, 69 [Google Scholar]
- Browning, M. K., Brun, A. S., & Toomre, J. 2004, ApJ, 601, 512 [Google Scholar]
- Brun, A. S., & Browning, M. K. 2017, Liv. Rev. Sol. Phys., 14, 4 [Google Scholar]
- Brun, A. S., Browning, M. K., & Toomre, J. 2005, ApJ, 629, 461 [Google Scholar]
- Buchler, J. R., Goupil, M. J., & Hansen, C. J. 1997, A&A, 321, 159 [NASA ADS] [Google Scholar]
- Bugnet, L., Prat, V., Mathis, S., et al. 2021, A&A, 650, A53 [NASA ADS] [CrossRef] [EDP Sciences] [Google Scholar]
- Buysschaert, B., Aerts, C., Bowman, D. M., et al. 2018, A&A, 616, A148 [NASA ADS] [CrossRef] [EDP Sciences] [Google Scholar]
- Calkins, M. A., Orvedahl, R. J., & Featherstone, N. A. 2021, Geophys. J. Int., 227, 1228 [NASA ADS] [Google Scholar]
- Choi, J., Dotter, A., Conroy, C., et al. 2016, ApJ, 823, 102 [Google Scholar]
- Christophe, S., Ballot, J., Ouazzani, R. M., Antoci, V., & Salmon, S. J. A. J. 2018, A&A, 618, A47 [NASA ADS] [CrossRef] [EDP Sciences] [Google Scholar]
- Claeskens, G., & Hjort, N. L. 2008, Model Selection and Model Averaging, Cambridge Series in Statistical and Probabilistic Mathematics [Google Scholar]
- Corsaro, E., Bonanno, A., Mathur, S., et al. 2021, A&A, 652, L2 [NASA ADS] [CrossRef] [EDP Sciences] [Google Scholar]
- Cristini, A., Hirschi, R., Meakin, C., et al. 2019, MNRAS, 484, 4645 [NASA ADS] [CrossRef] [Google Scholar]
- Degroote, P., Aerts, C., Baglin, A., et al. 2010, Nature, 464, 259 [Google Scholar]
- Dhouib, H., Prat, V., Van Reeth, T., & Mathis, S. 2021a, A&A, 652, A154 [NASA ADS] [CrossRef] [EDP Sciences] [Google Scholar]
- Dhouib, H., Prat, V., Van Reeth, T., & Mathis, S. 2021b, A&A, in press, https://doi.org/10.1051/0004-6361/202141152 [Google Scholar]
- Dintrans, B., & Rieutord, M. 2000, A&A, 354, 86 [NASA ADS] [Google Scholar]
- Dumont, T., Charbonnel, C., Palacios, A., & Borisov, S. 2021a, A&A, 654, A46 [NASA ADS] [CrossRef] [EDP Sciences] [Google Scholar]
- Dumont, T., Palacios, A., Charbonnel, C., et al. 2021b, A&A, 646, A48 [EDP Sciences] [Google Scholar]
- Dupret, M. A., Grigahcène, A., Garrido, R., Gabriel, M., & Scuflaire, R. 2005, A&A, 435, 927 [NASA ADS] [CrossRef] [EDP Sciences] [Google Scholar]
- Edelmann, P. V. F., Ratnasingam, R. P., Pedersen, M. G., et al. 2019, ApJ, 876, 4 [NASA ADS] [CrossRef] [Google Scholar]
- Featherstone, N. A., Browning, M. K., Brun, A. S., & Toomre, J. 2009, ApJ, 705, 1000 [Google Scholar]
- Fuller, J. 2017, MNRAS, 472, 1538 [Google Scholar]
- Gagnier, D., Rieutord, M., Charbonnel, C., Putigny, B., & Espinosa Lara, F. 2019, A&A, 625, A89 [NASA ADS] [CrossRef] [EDP Sciences] [Google Scholar]
- Garaud, P., & Acevedo Arreguin, L. 2009, ApJ, 704, 1 [NASA ADS] [CrossRef] [Google Scholar]
- Gebruers, S., Straumit, I., Tkachenko, A., et al. 2021, A&A, 650, A151 [NASA ADS] [CrossRef] [EDP Sciences] [Google Scholar]
- Georgy, C., Ekström, S., Granada, A., et al. 2013, A&A, 553, A24 [NASA ADS] [CrossRef] [EDP Sciences] [Google Scholar]
- Goupil, M.-J., & Buchler, J. R. 1994, A&A, 291, 481 [NASA ADS] [Google Scholar]
- Guzik, J. A., Kaye, A. B., Bradley, P. A., Cox, A. N., & Neuforge, C. 2000, ApJ, 542, L57 [Google Scholar]
- Henneco, J., Van Reeth, T., Prat, V., et al. 2021, A&A, 648, A97 [EDP Sciences] [Google Scholar]
- Horst, L., Edelmann, P. V. F., Andrássy, R., et al. 2020, A&A, 641, A18 [NASA ADS] [CrossRef] [EDP Sciences] [Google Scholar]
- Jefimenko, O. D. 1992, Am. J. Phys., 60, 899 [NASA ADS] [CrossRef] [Google Scholar]
- Johnston, C., Tkachenko, A., Aerts, C., et al. 2019, MNRAS, 482, 1231 [Google Scholar]
- Koch, D. G., Borucki, W. J., Basri, G., et al. 2010, ApJ, 713, L79 [Google Scholar]
- Kurtz, D. W., Saio, H., Takata, M., et al. 2014, MNRAS, 444, 102 [Google Scholar]
- Lecoanet, D., Cantiello, M., Quataert, E., et al. 2019, ApJ, 886, L15 [Google Scholar]
- Lee, U. 2021, MNRAS, 505, 1495 [NASA ADS] [CrossRef] [Google Scholar]
- Lee, U., & Saio, H. 1987, MNRAS, 224, 513 [Google Scholar]
- Lee, U., & Saio, H. 1997, ApJ, 491, 839 [Google Scholar]
- Lee, U., & Saio, H. 2020, MNRAS, 497, 4117 [CrossRef] [Google Scholar]
- Li, G., Bedding, T. R., Murphy, S. J., et al. 2019, MNRAS, 482, 1757 [Google Scholar]
- Li, G., Van Reeth, T., Bedding, T. R., et al. 2020, MNRAS, 491, 3586 [Google Scholar]
- MacGregor, K. B., & Cassinelli, J. P. 2003, ApJ, 586, 480 [NASA ADS] [CrossRef] [Google Scholar]
- Mathis, S. 2009, A&A, 506, 811 [CrossRef] [EDP Sciences] [Google Scholar]
- Mathis, S., & Prat, V. 2019, A&A, 631, A26 [NASA ADS] [CrossRef] [EDP Sciences] [Google Scholar]
- Mathis, S., Neiner, C., & Tran Minh, N. 2014, A&A, 565, A47 [NASA ADS] [CrossRef] [EDP Sciences] [Google Scholar]
- Mathis, S., Bugnet, L., Prat, V., et al. 2021, A&A, 647, A122 [EDP Sciences] [Google Scholar]
- Michielsen, M., Pedersen, M. G., Augustson, K. C., Mathis, S., & Aerts, C. 2019, A&A, 628, A76 [NASA ADS] [CrossRef] [EDP Sciences] [Google Scholar]
- Miglio, A., Montalbán, J., Noels, A., & Eggenberger, P. 2008, MNRAS, 386, 1487 [Google Scholar]
- Mombarg, J. S. G., Van Reeth, T., Pedersen, M. G., et al. 2019, MNRAS, 485, 3248 [NASA ADS] [CrossRef] [Google Scholar]
- Mombarg, J. S. G., Dotter, A., Van Reeth, T., et al. 2020, ApJ, 895, 51 [Google Scholar]
- Mombarg, J. S. G., Van Reeth, T., & Aerts, C. 2021, A&A, 650, A58 [NASA ADS] [CrossRef] [EDP Sciences] [Google Scholar]
- Moravveji, E., Townsend, R. H. D., Aerts, C., & Mathis, S. 2016, ApJ, 823, 130 [NASA ADS] [CrossRef] [Google Scholar]
- Neiner, C., Floquet, M., Samadi, R., et al. 2012, A&A, 546, A47 [NASA ADS] [CrossRef] [EDP Sciences] [Google Scholar]
- Neiner, C., Lee, U., Mathis, S., et al. 2020, A&A, 644, A9 [EDP Sciences] [Google Scholar]
- Orvedahl, R. J., Featherstone, N. A., & Calkins, M. A. 2021, MNRAS, 507, L67 [NASA ADS] [CrossRef] [Google Scholar]
- Ouazzani, R.-M., Salmon, S. J. A. J., Antoci, V., et al. 2017, MNRAS, 465, 2294 [Google Scholar]
- Ouazzani, R. M., Marques, J. P., Goupil, M. J., et al. 2019, A&A, 626, A121 [NASA ADS] [CrossRef] [EDP Sciences] [Google Scholar]
- Ouazzani, R. M., Lignières, F., Dupret, M. A., et al. 2020, A&A, 640, A49 [NASA ADS] [CrossRef] [EDP Sciences] [Google Scholar]
- Pamyatnykh, A. A. 1999, Acta Astron., 49, 119 [Google Scholar]
- Pápics, P. I., Tkachenko, A., Van Reeth, T., et al. 2017, A&A, 598, A74 [Google Scholar]
- Pedersen, M. G. 2021, ApJ, submitted [Google Scholar]
- Pedersen, M. G., Aerts, C., Pápics, P. I., & Rogers, T. M. 2018, A&A, 614, A128 [NASA ADS] [CrossRef] [EDP Sciences] [Google Scholar]
- Pedersen, M. G., Aerts, C., Pápics, P. I., et al. 2021, Nat. Astron., 5, 715 [NASA ADS] [CrossRef] [Google Scholar]
- Prat, V., Mathis, S., Buysschaert, B., et al. 2019, A&A, 627, A64 [NASA ADS] [CrossRef] [EDP Sciences] [Google Scholar]
- Prat, V., Mathis, S., Neiner, C., et al. 2020, A&A, 636, A100 [NASA ADS] [CrossRef] [EDP Sciences] [Google Scholar]
- Rieutord, M., & Espinosa Lara, F. 2013, in EAS Publications Series, eds. G. Alecian, Y. Lebreton, O. Richard, & G. Vauclair, EAS Pub. Ser., 63, 385 [CrossRef] [EDP Sciences] [Google Scholar]
- Rogers, T. M., & McElwaine, J. N. 2017, ApJ, 848, L1 [CrossRef] [Google Scholar]
- Rogers, T. M., Lin, D. N. C., McElwaine, J. N., & Lau, H. H. B. 2013, ApJ, 772, 21 [NASA ADS] [CrossRef] [Google Scholar]
- Saio, H., Kurtz, D. W., Takata, M., et al. 2015, MNRAS, 447, 3264 [Google Scholar]
- Saio, H., Kurtz, D. W., Murphy, S. J., Antoci, V. L., & Lee, U. 2018, MNRAS, 474, 2774 [Google Scholar]
- Saio, H., Takata, M., Lee, U., Li, G., & Van Reeth, T. 2021, MNRAS, 502, 5856 [Google Scholar]
- Samadi, R., Belkacem, K., Goupil, M. J., et al. 2010, Ap&SS, 328, 253 [NASA ADS] [CrossRef] [Google Scholar]
- Schmid, V. S., & Aerts, C. 2016, A&A, 592, A116 [NASA ADS] [CrossRef] [EDP Sciences] [Google Scholar]
- Scott, L. J. A., Hirschi, R., Georgy, C., et al. 2021, MNRAS, 503, 4208 [NASA ADS] [CrossRef] [Google Scholar]
- Szewczuk, W., & Daszyńska-Daszkiewicz, J. 2017, MNRAS, 469, 13 [NASA ADS] [CrossRef] [Google Scholar]
- Szewczuk, W., & Daszyńska-Daszkiewicz, J. 2018, MNRAS, 478, 2243 [Google Scholar]
- Szewczuk, W., Walczak, P., & Daszyńska-Daszkiewicz, J. 2021, MNRAS, 503, 5894 [NASA ADS] [CrossRef] [Google Scholar]
- Takata, M., Ouazzani, R. M., Saio, H., et al. 2020, A&A, 635, A106 [NASA ADS] [CrossRef] [EDP Sciences] [Google Scholar]
- Tassoul, M. 1980, ApJS, 43, 469 [Google Scholar]
- Tkachenko, A., Aerts, C., Yakushechkin, A., et al. 2013, A&A, 556, A52 [NASA ADS] [CrossRef] [EDP Sciences] [Google Scholar]
- Townsend, R. H. D. 2003, MNRAS, 340, 1020 [Google Scholar]
- Townsend, R. H. D. 2020, MNRAS, 497, 2670 [NASA ADS] [CrossRef] [Google Scholar]
- Triana, S. A., Moravveji, E., Pápics, P. I., et al. 2015, ApJ, 810, 16 [Google Scholar]
- Unno, W., Osaki, Y., Ando, H., Saio, H., & Shibahashi, H. 1989, Nonradial oscillations of stars, 1989, 2nd edn. (Tokyo: University of Tokyo Press) [Google Scholar]
- Van Beeck, J., Prat, V., Van Reeth, T., et al. 2020, A&A, 638, A149 [NASA ADS] [CrossRef] [EDP Sciences] [Google Scholar]
- Van Beeck, J., Bowman, D. M., Pedersen, M. G., et al. 2021, A&A, 655, A59 [NASA ADS] [CrossRef] [EDP Sciences] [Google Scholar]
- Van Reeth, T., Tkachenko, A., Aerts, C., et al. 2015, ApJS, 218, 27 [Google Scholar]
- Van Reeth, T., Tkachenko, A., & Aerts, C. 2016, A&A, 593, A120 [NASA ADS] [CrossRef] [EDP Sciences] [Google Scholar]
- Wu, T., & Li, Y. 2019, ApJ, 881, 86 [Google Scholar]
- Wu, T., Li, Y., & Deng, Z.-M. 2018, ApJ, 867, 47 [NASA ADS] [CrossRef] [Google Scholar]
All Figures
|
Fig. 1. Near-core rotation frequencies versus the maxima of the buoyancy frequency profile in the transition region region between the convective core and the radiative envelope (cf. Fig. 2) for a sample of 37 γ Dor (red squares) and 26 SPB (blue circles) pulsators. |
| In the text | |
|
Fig. 2. Profiles of the cyclic buoyancy frequency (in black; right y axis) and of the cyclic characteristic convective turnover frequency (coloured; left y axis) in the transition region between the core and the radiative envelope of the 37 γ Dor stars (upper panel) and 26 SPB stars (lower panel) plotted as a function of fractional mass. |
| In the text | |
|
Fig. 3. Wave Rossby numbers computed as the inverse of the spin parameters for the sample stars. For each of the stars, the minimal and maximal wave Rossby numbers of the identified low-frequency prograde modes of each star are connected by a dotted vertical line. The horizontal dashed line distinguishes the superinertial and the subinertial regime of the waves. |
| In the text | |
|
Fig. 4. Wave Rossby numbers plotted against the convective Rossby numbers computed as |
| In the text | |
|
Fig. 5. Ratio of the buoyancy frequency in the stable region to the convective turnover frequency in the convective core (interface stiffness) plotted as a function of the near-core rotation frequency for the sample of gravito-inertial pulsators. |
| In the text | |
|
Fig. 6. Size of the penetration zone plotted as a function of convective Rossby number for the 17 SPB pulsators in Pedersen et al. (2021) whose best forward asteroseismic model is based on convective penetration (the symbol sizes scale linearly with the near-core rotation frequency, where the legends list the lowest and highest values). The full line represents the expected relationship according to the theory by Augustson & Mathis (2019), with a slope fixed at 3/10 and the intercept calibrated by the 17 observed stars. The dotted line represents the best linear fit, with its uncertainty region indicated in grey. |
| In the text | |
|
Fig. 7. Scaling of the gravito-inertial wave flux Fz, normalised by the gravity wave flux for the non-rotating case F0, when excited by columnar convection at the equator for waves. The stiffness adopted in the theory by Augustson et al. (2020), defined as the ratio of the buoyancy frequency to the convective overturning frequency (S = NR/N0 in their notation) is approximated here by Nmax/2νrot from Fig. 1 and taken to be (a) 103 for the SPB stars (left panel), (b) 104 for the γ Dor stars (right panel) as found from Fig. 5. The vertical dashed line denotes the transition between subinertial and superinertial regime placed at a convective Rossby number of |
| In the text | |
|
Fig. 8. Estimates of the magnetic field following equipartition ( |
| In the text | |
Current usage metrics show cumulative count of Article Views (full-text article views including HTML views, PDF and ePub downloads, according to the available data) and Abstracts Views on Vision4Press platform.
Data correspond to usage on the plateform after 2015. The current usage metrics is available 48-96 hours after online publication and is updated daily on week days.
Initial download of the metrics may take a while.