Free Access
Fig. 4.
Download original image
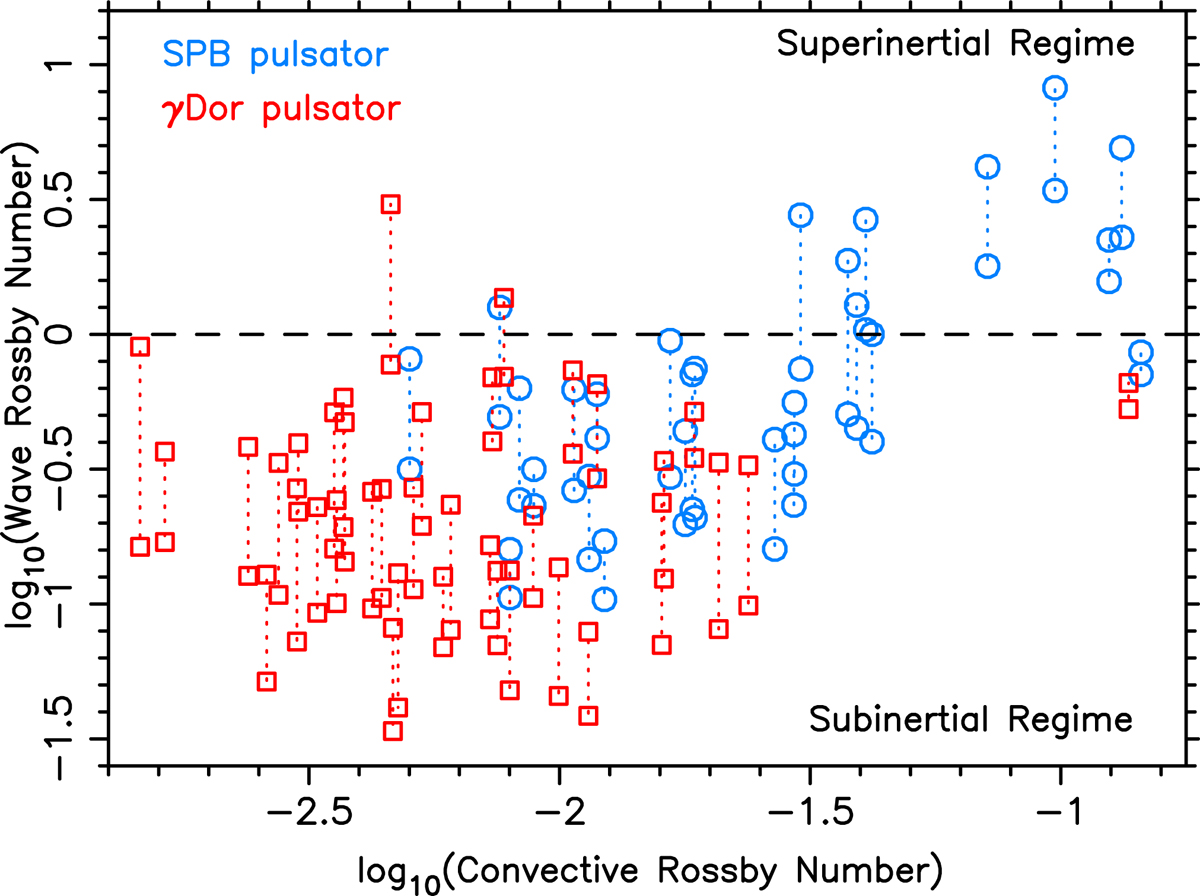
Wave Rossby numbers plotted against the convective Rossby numbers computed as ![]() deduced from the maxima inside the convective cores shown in Fig. 2. The horizontal dashed line distinguishes the superinertial and the subinertial regime of the waves.
deduced from the maxima inside the convective cores shown in Fig. 2. The horizontal dashed line distinguishes the superinertial and the subinertial regime of the waves.
Current usage metrics show cumulative count of Article Views (full-text article views including HTML views, PDF and ePub downloads, according to the available data) and Abstracts Views on Vision4Press platform.
Data correspond to usage on the plateform after 2015. The current usage metrics is available 48-96 hours after online publication and is updated daily on week days.
Initial download of the metrics may take a while.