| Issue |
A&A
Volume 652, August 2021
|
|
|---|---|---|
| Article Number | A133 | |
| Number of page(s) | 24 | |
| Section | Interstellar and circumstellar matter | |
| DOI | https://doi.org/10.1051/0004-6361/202039802 | |
| Published online | 23 August 2021 | |
What happened before?
Disks around the precursors of young Herbig Ae/Be stars
1
Anton Pannekoek Institute for Astronomy (API), University of Amsterdam,
Science park 904,
1098 XH
Amsterdam,
The Netherlands
e-mail: This email address is being protected from spambots. You need JavaScript enabled to view it.
2
Institute for Mathematics, Astrophysics & Particle Physics, Radboud University,
PO Box 9010, MC 62,
6500 GL
Nijmegen,
The Netherlands
3
SRON,
Sorbonnelaan 2,
3484CA
Utrecht,
The Nederlands
Received:
30
October
2020
Accepted:
14
April
2021
Abstract
Context. Planets form in circumstellar disks around pre-main-sequence stars. A key question is, how do the formation and evolution of protoplanetary disks depend on stellar mass? Studies of circumstellar disks at infrared and submillimeter wavelengths around intermediate-mass Herbig Ae/Be stars have revealed disk structures such as cavities, gaps, and spiral arms. The Herbig Ae/Be stars represent an older population of intermediate-mass pre-main-sequence stars. Since these evolve toward the main sequence on timescales comparable to those of typical disk dissipation, a full picture of disk dispersal in intermediate-mass pre-main-sequence stars must include the intermediate-mass T Tauri (IMTT) stars.
Aims. We seek to find the precursors of the Herbig Ae/Be stars in the solar vicinity within 500 pc from the Sun. We do this by creating an optically selected sample of IMTT stars from the literature, here defined as stars of masses 1.5 M⊙≤ M*≤ 5 M⊙ and with a spectral type between F and K3.
Methods. We used literature optical photometry (0.4–1.25 μm) and distances determined from Gaia DR2 parallax measurements together with Kurucz stellar model spectra to place the stars in a HR diagram. We employed Siess evolutionary tracks to identify IMTT stars from the literature and derived masses and ages. We used Spitzer spectra to classify the disks around the stars into Meeus Group I and Group II disks based on their [F30/F13.5] spectral index. We also examined the 10 μm silicate dust grain emission and identified emission from polycyclic aromatic hydrocarbons (PAH). From this, we built a qualitative picture of the disks around the IMTT stars and compared this with available spatially resolved images at infrared and submillimeter wavelengths to confirm our classification.
Results. We find 49 IMTT stars with infrared excess. The identified disks are similar to the older Herbig Ae/Be stars in disk geometries and silicate dust grain population. The detection frequency of PAHs is higher than from disks around lower mass T Tauri stars but less frequent than from Herbig Ae/Be disks. Spatially resolved images at infrared and submillimeter wavelengths suggest gaps, and spirals are also present around the younger precursors to the Herbig Ae/Be stars.
Conclusions. Comparing the timescale of stellar evolution toward the main sequence and current models of protoplanetary disk evolution, the similarity between Herbig Ae/Be stars and the IMTT stars points toward an evolution of Group I and Group II disks that are disconnected and represent two different evolutionary paths.
Key words: protoplanetary disks / stars: evolution / stars: variables: T Tauri, Herbig Ae/Be / stars: pre-main sequence / stars: statistics
© ESO 2021
1 Introduction
Planets are formed in circumstellar disks around young pre-main-sequence (PMS) stars or perhaps even in the earlier protostellar phase (Segura-Cox et al. 2020). Angular momentum conservation during the collapse of the molecular cloud around the protostellar core forces material to form a disk around the forming star. The disk material dissipates over a few Myr as the material is accreted onto the star, lost in space by disk winds and/or jets, and accreted into planets. The circumstellar disk evolves from a gas-rich disk into a transitional disk and eventually a gas-poor debris disk. This general scenario has gained substantial observational support over the last ten years, as more spatially resolved observations around PMS stars have become available. Observations at millimeter and submillimeter wavelengths with instruments such as ALMA, SPHERE, GPI, and SUBARU have revealed circumstellar disks with spiral arms, central cavities, concentric circular gaps, and warps in the disk, which are indicative of interactions with planetary bodies (Andrews 2020; Garufi et al. 2017, 2020; Andrews et al. 2018; Huang et al. 2018a,b; Benisty et al. 2018; Monnier et al. 2019). Other explanations for these features have also been suggested, such as gravitational instabilities, snow lines, and binary interactions (Andrews 2020; van der Marel et al. 2019).
A key point is to understand how the formation and evolution of planetary systems depends on stellar mass. Can we connect the properties of planet-forming disks to those of mature planetary systems, and what role does the stellar mass play? When do the features seen in observations of planetary disks, spirals, gaps, and cavities form, and what do they say about the planetary formation process?
Two main types of PMS stars have traditionally been observed to study the circumstellar disks and their evolution. The T Tauri stars (spectral class F and later) (Joy 1945; Herbig 1962; Bastian et al. 1983) and the Herbig Ae/Be (hereafter HAeBe) stars of spectral class A and B. (Herbig 1960; Bastian et al. 1983). Overlapping in mass, the T Tauri stars with masses M ≥ 1.5 M⊙ will evolve through the Hertzsprung-Russel diagram (HR diagram) to become HAeBe stars. Studies of circumstellar disks using HAeBe stars only, however, have introduced a bias in our view of planet formation and disk dissipation in this mass range (see also Vioque et al. 2018).
In order to have a full observational view of disk evolution and planet formation for intermediate-mass stars, samples must be constructed that contain both HAeBe stars and their precursors. Several papers have mentioned these T Tauri stars as a separate group. Herbig & Bell (1988) used a special category called ‘su’ T Tau stars, defined as stars with a spectral appearance similar to the T Tauri star SU Aur. Herbst et al. (1994) used the term early type T Tauri stars (ETTS), containing both HAeBe stars and T Tauri stars. To our knowledge, Calvet et al. (2004) was the first paper dedicated to (and to name) the intermediate-mass T Tauri stars (hereafter IMTT stars). Lavail et al. (2017) studied magnetic fields in IMTT stars and defined the class as PMS stars with masses 1 M⊙ ≤ M ≤ 4 M⊙. These papers contain a relatively small number of objects and use different mass ranges. The IMTT stars have so far been discussed as a part of a much larger sample of T Tauri stars. For the HAeBe stars, samples exist and are widely studied (e.g. Herbig 1960; The et al. 1994; Acke & van den Ancker 2006; Juhász et al. 2010; Garufi et al. 2017; Varga et al. 2018; Vioque et al. 2018). It is therefore useful to construct a sample of IMTT stars from existing literature and study their properties so that a more complete picture of planetary formation and disk evolution for intermediate-mass PMS stars can be constructed and compared to the lower mass stars.
In this work, we identified IMTT stars by searching the literature for luminous T Tauri stars in the solar neighborhood that may be of intermediate mass, defined by their mass 1.5 M⊙≤ M ≤ 5 M⊙ and spectral type later than F. We constructed spectral energy distributions (SEDs) and used literature values of spectral types and effective temperatures, together with Gaia DR2 data, in order to place the stars in the HR diagram. We discuss the properties of the stars and their disks in the context of what is known for the HAeBe stars by examining disk geometry, silicate dust grains, and polycyclic aromatic hydrocarbons (PAHs). Meeus et al. (2001) used the shape of the infrared and the millimeter spectrum to classify the protoplanetary disks around HAeBe stars into two groups. Group I (transitional disks) and Group II disks based on the shape of their SED. Since then, many papers have used this classification and noted differences between the two groups. In this paper, we also use the Meeus classification so that a meaningful comparison with the HAeBe literature can be made.
This paper is organized as follows. In Sect. 2, we discuss the construction and refining of the sample. In Sect. 3, we describe our analysis of the disk properties, focusing on spatially unresolved data. Section 4 discusses the properties of IMTT disks in the context of disk evolution and dissipation in intermediate-mass PMS stars, and in Sect. 5 we summarize the main conclusions of our study.
2 Sample selection
2.1 Approach
The optically selected sample was constructed by searching literature for IMTT stars in the solar neighborhood. The selection procedure consists of four steps. First, an initial search for T Tauri stars in the SIMBAD database. Then, in a second step, we remove stars that lie beyond a chosen distance maximum. We use a simple method to obtain a first estimate of luminosity in the third step in order to remove most of the low-mass T Tauri stars (< 1.5 M⊙). Finally, in a fourth step, the luminosities of the remaining stars are then determined more precisely by fitting a Kurucz stellar model to the photometry, allowing an accurate placement in the HR diagram.
2.2 Initial selection of stars from the literature
We searched the SIMBAD database for T Tauri stars (keyword TT*) with spectral types from F0 − K3. Earlier type stars one would contaminate the sample by including the Herbig stars; with later type stars than K3 estimating the mass correctly is challenging with our methodology because of the proximity of the pre-main sequence evolutionary tracks which run close together and are almost vertical in the particular luminosity range we are interested in. The search turned up 623 stars. We also included HAeBe stars of spectral types F and G from Vioque et al. (2018; two stars) as well as the IMTT stars in the work by Villebrun et al. (2019; 14 stars) and Calvet et al. (2004; two stars).
2.3 Distance determination and distance limit
The disks around the stars should be observable in scattered light in the hope that disk features such as gaps, spirals, and shadows in the disk can be observed. Gaps in the disk typically have an average width of ≤ 10 AU (Andrews et al. 2018). With the current resolution of scattered light instruments such as VLT-SPHERE, that have a resolution limit of 22–27 mas (Beuzit et al. 2019), these features would not be easily detected at distances beyond 450 pc. Since disks themselves can be detected in scattered light at greater distances and the number of high-mass star-forming regions in the vicinity of the Sun is low, we decided to include the Orion star-forming region. Therefore, we extended the distance limit to 500 pc, keeping in mind that features in the most distant disks will be difficult to resolve. In the second step, we obtained the distances to each star byBayesian inference from Gaia DR2 parallaxes by Bailer-Jones et al. (2018). This is an important asset for our method determining stellar parameters because of the high precision in the parallaxes measured by Gaia. The distance uncertainties by Bayesian inference presented in Bailer-Jones et al. (2018) are typically from 2–4% for the final sample of stars. The uncertainties in luminosity for the stars is therefore dominated by the uncertainty in the determined Teff. If no distance was available, we used Hipparcos parallaxes. Concerning stars for which none of these options were available, we searched the literature for a distance measurement or estimate using associations of stars. Stars for which no distance reference could be found or that were further away than 500 pc were then removed from the sample. We used all Gaia parallaxes in our selection steps, including those with RUWE above 1.4. We revisit this point in Sect. 2.5 when discussing the final sample.
2.4 Removal of lower mass T Tauri stars
The third step in the selection process aims to remove the bulk of the low mass T Tauri stars. We first searched for an accurate spectral class classification in literature or an accurate determination of Teff. Stars that have a classification as FU Ori stars were immediately removed because of their high variability from outbursts and because the flux at optical wavelengths is dominated by their accretion disks.
Pre-main-sequence evolutionary tracks partially overlap with post-main-sequence tracks. Stars identified as post main sequence in the literature in this step were therefore removed from the sample. The remaining number of post-main-sequence stars in our sample would then be very small. Infrared excess is not expected for single intermediate-mass stars that have evolved to sub-giants, as these stars do not yet have dusty stellar winds.
We then collected optical B- and V-band photometry using catalogs with good coverage. These catalogs included the following: NOMAD (Zacharias et al. 2005), UCAC4 (Zacharias et al. 2012), APASS DR2 (Henden et al. 2016), UBVRIJKLMNH photoelectric catalog (Morel & Magnenat 1978), Tycho2 catalog (Hog et al. 2000), EPIC (Huber et al. 2017), and Manoj et al. (2006). Using the table of standard stars from Pecaut & Mamajek (2013), we obtain the intrinsic (B− V) for each spectral class and temperature as well as the bolometric corrections (BC) in the V-band, BCV. Assuming an Rv = 3.1, we estimated the extinction, Av, and the luminosity from the V-band magnitude using the distance modulus. We then set a lower luminosity limit of 2.1 L⊙ based on the lowest luminosity of a Siess et al. (2000) stellar evolutionary track for a star of 1.5 M⊙ with solar type metallicity (Z = 0.01). Stars that are likely to be low mass T Tauri stars were removed this way. This cut the sample to 122 candidates.
2.5 Final selection
The fourth and final step in our source selection procedure involves placing the stars accurately in the HR diagram by means of SED fitting.In order to do so, the extinction and luminosity needs to be accurately determined. Together with Teff, the mass can bedetermined from evolutionary tracks in the HR diagram. Photometry used in this process covered 0.4–1.25 μm to avoid excessfrom accretion in the UV and infrared excess from circumstellar material.
We used Gaia DR2 G-band photometry to examine the relative error in magnitude from the Gaia database (Gaia Collaboration 2018) and conclude that most stars have low to moderate variability (at least during the Gaia measurement period) of typically around 1%, with a few exceptions up to around 6%. Some variability has to be expected because of the presence of possibly occulting circumstellar material. Therefore, we used the maximum measured brightness at each wavelength.
A Kurucz model spectrum was fit to the optical photometry using the iterative method of Woitke et al. (2016) (see Appendix A in said paper). The method requires the following starting input parameters: M*, distance, Teff, L*, Rv, and Av. We used (as derived in the previous subsection) the estimates for Av, L* and the literature values for Teff. The initial M* was set to 2 M⊙ and the Rv =3.1 for all stars (except three highly reddened sources, EM*SR 21, Haro 1–6, and LkHα 310, where Rv = 5 gave a better stellar photospheric fit in the end). The routine starts with the calculation of a log (g) assuming said starting parameters. This log(g) value is used to choose a Kurucz stellar spectrum. The spectrum is then reddened and fit to the observed photometry, convolving the model spectrum with the filter transmission curves for each of the photometric bands to produce the integrated model flux in each band (Woitke et al. 2019). The resulting L* and Av is then fed back into the program, keeping Teff fixed. The stellar mass is refined for each iteration by deriving the value using Siess et al. (2000) pre-main-sequence stellar evolution models. This process leads to a more accurate log(g) value and therefore a better model spectrum selection for the following iteration. The routine converges very quickly (typically in 2-3 iterations) to determine M*, L*, and E(B − V)1. We ran this procedure not only for the Teff value, but also for the Teff range allowed by the uncertainty, in order to derive the corresponding range in luminosity.
Stars that were found to be below 1.5 M⊙ or where no fit could be made with the available photometry were removed. We also removed stars with no infrared excess; that is, the photometry follows the expected stellar photospheric emission. We did not apply a strict upper bound for the luminosity as a selection criterion.
Some of the Gaia parallaxes in our final sample are less reliable. We consider the parallaxes with a renormalized unit weight error (RUWE) ≤ 1.4 as “good2 ”. As a final step in our procedure, we therefore carefully checked the distances for ten stars in our final sample for which the Gaia RUWE was found to be >1.4. In Appendix A, a comparison is presented between the Gaia distance of these ten stars and other distance determinations in the literature. Appendix A also presents our final value adopted for the distances of these stars.
We make a few notes concerning specific targets:
Two stars in the sample are classified as late type A stars (HD 142666 and HD 144432). They remain in the sample because their uncertainty in Teff overlaps with our sample criteria.
We note that the 70 μm and submillimeter fluxes measured for HBC 502 (Flaherty & Muzerolle 2008; Mitchell et al. 2001) are very high. Muzerolle et al. (2010) suggested that this may be due a spatial coincidence with a class 0/I object. However, the optical and infrared photometries are dominated by the IMTT star, and therefore we kept this object on our list.
For UX Tau, we were unable to fit a model spectra. We adopted stellar parameters from the literature (Akeson et al. 2019; Csépány et al. 2017; Espaillat et al. 2010; Kraus & Hillenbrand 2009). Using these values, we kept it in the analysis because of its position in the HR diagram.
We also removed BP Psc, which is discussed as a potential T Tau star (~ 80 pc) or a post-main-sequence giant (~300 pc) (de Boer et al. 2017). The distance from Bailer-Jones et al. (2018) release puts it at ~360 pc, suggesting a post-main-sequence nature.
2.6 Final sample
We find 49 sources matching our selection criteria for IMTT stars that also show evidence of infrared excess. An overview of the sample can be seen in Table 1, together with the literature reference for their spectral class. The HR diagram for the full sample is presented in Fig. 1. The majority of the IMTT stars found are located in the Orion star-forming complex. Other regions include Cepheus, Chameleon, Lupus, Ophiucus, Perseus, and the Taurus-Auriga star-forming region. The richness of sources in Orion may be due to a high abundance of these IMTT stars in this type of star-foming region. Moreover, other star-forming regions have ages that imply that intermediate-mass PMS stars have already lost their disks. Ten of the stars have previously been described as T Tau stars, while the remaining ones have previously been identified asintermediate-mass stars (IMTT or HAeBe stars) (see Table 2). We present the stellar parameters for these stars as found by the method described in the previous subsections in Table 3.
The majority of the stars have masses ≤2 M⊙, and only four stars have masses ≥3 M⊙ (Fig. 2, lower panel), which is in contrast with the sample of Vioque et al. (2018). This is consistent with the fact that stars of higher mass are rarer, and also that higher mass stars evolve faster into A and B stars and leave our predefined temperature range in the HR diagram more quickly. In addition, the higher mass stars in the F-K temperature region may not yet have cleared their envelope and may still be embedded. They therefore fall outside our optical selection criteria and do not show in our sample.
Compared with the Vioque et al. (2018) sample, the stellar age in each mass bin is on average younger (Fig. 2, upper panel). This means, for example, if we look at stars with masses from 1.5–2.0 M⊙, the average age is lower than the typical age of the Herbig stars. This shows that we indeed have possible candidate progenitors of the Herbig starsin the sample. As expected, the stellar age increases at lower mass, because PMS evolutionary timescales decrease with increasing stellar mass. The median age for the sample is 4 Myr.
With the help of the fit photospheric spectrum, the infrared excess can be determined. Infrared, millimeter, and submillimeter photometry were collected for this sample from the AllWISE, AKARI, Spitzer, and Herschel point sourcecatalogs, as well as from other publications (see Table 4 for details on each source star) to build up the SEDs so that the disk could be analysed. In gas-rich disks, we expect to see a near-infrared excess in the SED in contrast to debris disks where the infrared excess first becomes visible beyond 10 μm. In the sample, we can identify six disks where the SED resembles that of a debris disk (HBC 415, Brun 252, Brun 555, Brun 656, Ass Cha T2-21, Ass Cha T2-54). Since we are interested in gas-rich disks, these stars remain in our presented sample of sources but are removed from the disk analysis.
Final IMTT star sample.
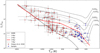 |
Fig. 1 HR diagram showing the IMTT stars sample (blue) and the HAeBe sample from Vioque et al. (2018) (red) that lies within the same mass range as the IMTT stars. The pre-main-sequence evolutionary tracks (gray-solid) are from Siess et al. (2000). The isochrones shown are for 1 Myr (dotted), 2 Myr (dash-dotted), 3 Myr (red-solid), and 7 Myr (black-solid). The ZAMS (thick-dashed) is defined by the location when the nuclear luminosity provides 99% of the total stellar luminosity. |
3 Qualitative disk analysis
In this section, we examine the SED and describe how we used archived low-resolution mid-infrared spectra from the Combined Atlas of Sources with Spitzer Infrared Spectra (CASSIS) (Lebouteiller et al. 2011) to perform a comparison of the HAeBe and T Tauri population in a qualitative analysis of the disks (see Table 4 for CASSIS AOR key). The spectra of three stars, HD 142666, HD 142527, and HD 144432, were taken from Juhász et al. (2010). Using the spectral slope between 13 and 30 μm, we classified the disks into disk geometries and compared the distribution with samples of HAeBe stars. We obtained the strength of the 10 μm silicate feature from archived low-resolution Spitzer spectra to examine the state of the silicate grain evolution in the disks with those around HAeBe stars. We inspected the mid-infrared spectra for evidence of PAH emission and compared the detection frequency with the HAeBe and lower mass T Tauri stars. We performed a comparison between the spectral slope and the near-infrared excess in order to examine the inner disk opacity. All values measured in the Spitzer spectra for the sources are available in Table 5.
3.1 Group I versus Group II
Spatially resolved observations in scattered light, the infrared, and submillimeter wavelengths have given rise to the Meeus Group I and GroupII classification (Meeus et al. 2001) to represent two different disk geometries (e.g., see Garufi et al. 2018). A similar approach to classifying disks in terms of disk geometry (full, pre-tansitional, and transitional disk) based on their SED, has also been used in T Tauri literature (Luhman & Mamajek 2012; Esplin et al. 2014; Espaillat et al. 2014). Ideally, imaging data is used to establish the geometry of the disks in our sample. Unfortunately, such data are not available for all stars. We can nevertheless use the Group I/Group II classification to infer the disk geometry for our sample. In Appendix C, we verify if our classification in transitional disks (Group I) and self-shadowed or compact disks (Group II) is supported by published imaging data. We find that for 16 of 18 sources, where spatially resolved image data is available, our classification is supported.
In Group I disks, the upper layers of the (flared) disk at spatial scales of tens of AU are directly irradiated by the central star. Almost all Group I disks have a large gap where the dust has been cleared out. That allows the central star to irradiate the outer disk (Khalafinejad et al. 2016). The inner rim of the outer disk scatters stellar radiation and significantly contributes to the SED in the mid- to far-infrared (Honda et al. 2012). In Group II disks, the inner rim of the disk casts a shadow on the outer disk (Dullemond & Dominik 2004). The outer disk, if present, does not receive direct stellar photons and therefore usually shows no or weak emission in scattered light (Garufi et al. 2017), and a “blue” mid- to far-IR SED. Other effects that can strongly influence the SED are the disk outer radius (a small outer radius results in a Group II SED, see Dominik et al. 2003), or a misalignment between the inner and outer disk (Marino et al. 2015).
We used the method of Acke et al. (2009) to classify the disks into Group I and Group II objects based on the infrared slope of the continuum between 13 μm and 30 μm using the Spitzer spectra obtained from CASSIS, averaging the flux values in a 0.2 μm wide window around 13 μm and 30 μm separately. The slope of the spectrum is defined as the ratio between the fluxes, [F30∕F13]. We define the dividing line between the two groups to be at 2.1, as suggested by Khalafinejad et al. (2016), where Group I disks are identified with a flux ratio [F30∕F13] ≥ 2.1.
For seven sources without Spitzer spectra at 13 and 30 μm, the classification is instead based on the photometric infrared excess at 60 μm, E60. Acke et al. (2009) suggested that for HAeBe stars there is a strong correlation between the disk geometries as determined by the 60 μm excess and the 13–30 μm spectral slope. Therefore, we employed a method used by Acke & van den Ancker (2006), where for HAeBe stars they defined a Group I source having an excess of E60 ≥ 10 mag. However, this limit was set for stars of typical Teff of ~ 8000−10000K. The stars in our sample are cooler (and therefore redder). Since this leads to less excess (see also Appendix A), the ten magnitude excess limit set for the Herbig stars needs to be adjusted. Using BC for PMS stars produced by Pecaut & Mamajek (2013), we see that there is a difference in bolometric correction of BCJ ~ 0.75 between HAeBE and IMTTS stars. We therefore used the excess limit E60 ≥ 9.25 mag for Group I disks around the cooler IMTT stars. We measured the flux above the photosphere at 60 μm and used the fit model spectrum to calculate the excess expressed in magnitudes.
We find that 20 sources fall into the Group I category and 19 fall in the Group II category. In addition, we have three stars that fall in-between Group I and Group II due to the uncertainty in their spectral index and one source, HD 288313A, where the lack of data makes it impossible to use any of these direct methods to determine group membership. This result can be compared to Juhász et al. (2010), where 53 HAeBe stars were categorized into the two Meeus groups using the classification of van Boekel et al. (2005). In comparison, the HAeBe disk distributions between Group I and Group II are 20 and 33, respectively.
Classification as T Tau star or HAeBe star to confirm the PMS nature of the star and list weather or not this star has previously been referred to as an intermediate-mass PMS star.
Stellar parameters and disk types for the sample.
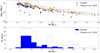 |
Fig. 2 Comparison between the sample of IMTT stars in this paper with the HAeBe star sample from Vioque et al. (2018). Only stars up to 5 M⊙ are shown for the HAeBe stars in these panels. Upper panel: age-mass relation among the IMTT star sample in comparison with the Herbig star sample. The IMTT star sample is on average younger than the HAeBe stars with each mass bin. Lower panel: mass distribution in the IMTT star sample compared to the mass distribution among the HAeBe stars. |
3.2 Inner disk and disk flaring
Acke et al. (2009) discovered a correlation between the excess at 7 μm and the spectral slope between 13 and 30 μm. This relationship was found for both Group I and Group II disks. The correlation was interpreted as a result of an inner disk casting a shadow on the outer disk. A larger near-infrared excess implies a higher inner scale height, resulting in a more shadowed disk with a “bluer” spectral slope. We wanted to investigate if such a correlation is also present in the IMTT star sample. We therefore measured the excess at 7 μm by subtracting the fit Kurucz model flux from the observed SED at 7 μm and then calculated the difference expressed in magnitudes. The results are compared with the HAeBe stars from Acke et al. (2009) and can be seen in Fig. 3 (left panel).
The IMTT stars occupy a similar region in Fig. 3 (left panel). The trend that stars with a larger near-infrared excess have a lower [F30∕F13.5] index also holds for the IMTT stars. There is one difference: the maximum 7 μm excess is 4.5 mag for IMTT stars and 6 mag for HAeBe stars. In Appendix A, we show that this difference can simply be explained by the changes in luminosity and temperature of an evolving intermediate-mass PMS star, without the need for differences in inner disk structure.
The correlation between the [F30∕F13.5] and [F13.5∕F7] flux ratios described by Acke et al. (2009) for the Group II disks in HAeBe stars is also present among the IMTT stars (Fig. 3, right panel). The Group II disks are concentrated in a similar fashion in color and there is less of a spread among the Group I disks in the [F13.5∕F7] ratio than for the HAeBe stars. There is one exception, the Group II disk of V2149 Ori, which is redder, has a lower [F13.5∕F7] flux ratio, and lies somewhat outside toward lower 7 μm excess than the rest of the Group II concentration. It is marked in both panels in Fig. 3.
References to photometry used for the SED.
3.3 10 μm silicate feature
The bulk of dust in protoplanetary disks is made up of silicate grains. The 10 μm silicate feature is sensitive to the size of the dust grains, the chemical composition, and the lattice structure in the grains. The shape and strength of the feature can be used as a signpost of dust processing in the disk (van Boekel et al. 2003).
The shape of the silicate emission feature can be measured by the flux ratio at 11.3 and 9.8 μm, [F11.3∕F9.8] and the peak strength of the feature by the continuum divided flux at 9.8 μm (see van Boekel et al. 2003). As small silicate grains (0.1 μm) are removed from the inner disk, primarily by grain growth, the strength of the 10 μm band weakens. The evolution also leads to a flatter band shape and a higher [F11.3∕F9.8] (van Boekel et al. 2003; Przygodda et al. 2003). The ratio is also sensitive to the presence of a strong crystalline olivine emission band at 11.3 μm.
To measure the strength and shape of the 10 μm silicate feature, we first measured the continuum flux at 7 μm and at 13.5 μm, where no prominent emission or absorption bands are present. The underlying continuum was then approximated to be linear between these two points and used to normalize the spectra. We defined the strength of the 10 μm band by measuring the continuum divided flux at 9.8 μm (F9.8) and the shape by the ratio of the continuum divided flux at 11.3 and at 9.8 μm (F11.3/F9.8). We set the threshold for a detectable silicate feature to a peak over a continuum strength of 1.2 to clearly separate the emission from the noise in the spectra. In Fig. 4, we show the relationship between shape of the 10 μm silicate feature and the peak strength at 9.8 μm. In Figs. 5 and 6, we show the shape of the 10 μm silicate feature as a function of rising peak strength for Group I and Group II sources, respectively. The three sources that are challenging to put into any of the Group I and II categories are shown together with the group to which their spectral index, [F30∕F13.5], lies closest. The absence of a 10 μm silicate feature means that there are no small grains of the correct temperature for the emission to be formed. This can come from either a gap in the disk where no silicate grains are present, or that the small grains have grown to a size where the emission is no longer present.
Following the HAeBe star classification (Meeus et al. 2001), we call the disks with silicate feature present Ia and IIa and the disks showing no silicate feature Ib and IIb. Using the Spitzer spectra, we were able to make this subcategorization for 15 Group I disks and 17 Group II disks. We find nine Group Ia disks versus six Group Ib disks and 17 Group IIa disks, and no group IIb disk. The three disks with a spectral index that puts them in-between Group I and Group II 2 are Group Ia/IIa disks and one Group Ib/IIb disk. Among the HAeBe stars, the distribution is similar, with 15 Group Ia versus five Group Ib disks, and 29 Group IIa versus four Group IIb disks (Juhász et al. 2010).
We find the relationship between the flux ratio [F11.3∕F9.8] and the peak over continuum flux at 9.8 μm in Group Iaand Group IIa disks follows the same relationship as is found among HAeBe and T Tauri stars by other authors (Varga et al. 2018; van Boekel et al. 2003; Bouwman et al. 2008; Przygodda et al. 2003; Furlan et al. 2009). However, the peak-over-continuum strength distribution of the 10 μm silicate feature is more similar to the HAeBe stars than the T Tauri star distribution (see Fig. 7), where the T Tauri stars lack the tail toward higher emission band strength visible in both the IMTT stars and HAeBe stars. Such a trend extends over a much wider stellar and substellar mass range (e.g. Pascucci et al. 2009), and it is interpreted in terms of an increase in the degree of inner disk settling with decreasing stellar mass, extending to the brown dwarf regime.
We also note that the distribution of disks in the [F11.3∕F9.8] flux ratio clusters around two values: one with low peak-over-continuum intensity at 9.8 μm (weak feature) and with [F11.3∕F9.8] flux ratio of around 0.9–1.1, consistently with larger grains (around 2 μm), and one region with high peak-over-continuum intensity (strong feature) and low [F11.3∕F9.8] flux ratio (0.6–0.7), consistently with smaller grains (around 0.1 μm). This could be related to changes in the characteristic grain size from submicron to a few microns and the corresponding nonlinear change in grain opacity.
Maaskant et al. (2013) showed that HAeBe stars with weak or no silicate emission have a [F30∕F13.5] ≳ 5 (see also Varga et al. 2018). These disks have large cavities and a corresponding lack of small warm silicate grains that are responsible for the 10 μm silicate band. This aspect is also reflected in the IMTT star sample (Table 5). The majority of IMTT stars with strong silicate features have [F30∕F13.5] flux ratios well below 5. We can therefore conclude that the emission from silicate grains around 10 μm behaves as it does in the HAeBe stars, where the small warm silicate grains are much less abundant in the inner disk due to large cavities.
If the hot innermost disk contains small silicate grains, it should still produce a weak silicate band. In two cases, HD 135344B (Varga et al. 2018) and the lower mass T Tauri star T Cha (which hosts a transitional disk, see Olofsson et al. 2013), interferometric observations suggest that such small hot silicate grains are absent. Therefore, the lack of silicate emission in some Group I disks is likely due to a combination of a large disk gap and a depletion of small grains in the inner disk.
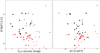 |
Fig. 3 Crosses: HAeBe sample from Acke et al. (2009) and solid circles: IMTT stars in our sample. Black indicates a Group I source and red a Group II source. The average uncertainty in the measurement is displayed in the top right corner of the panel. Left panel: relationship between the spectral slope from 13–30 μm and the 7 μm excess. Compared to the HAeBe stars, there is a lack of IMTT stars with a 7 μm excess above 4 magnitudes. Right panel: color comparison with the Herbig stars reveal that the distribution is similar to the HAeBe population. The location of V2149 Ori is marked. |
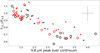 |
Fig. 4 Degree of processing for the silicate grains in the disks around the IMTT star sample (open circles) and for the HAeBe sample from Juhász et al. (2010) (crosses). Group I disks are black and Group II disks are red. Smaller grains lead to a high peak-over-continuum intensity and a low [F11.3 ∕F9.8] ratio. As grains grow, the [F11.3∕F9.8] ratio increases and the peak-over-continuum intensity weakens. |
3.4 Polycyclic aromatic hydrocarbons
We used low-resolution Spitzer spectra between 6 and 13 μm to detect the presence of any PAH emission. The PAH emission bands in this wavelength range are at 6.2, 7.7, 8.6, 11.3, and 12.7 μm. We visually inspected the Spitzer spectra, and if we saw two clear PAH bands in the spectra, we counted this as a detection. In the cases where we could only see one clear band, we defined the PAH detection as tentative. The result is presented in Table 6. The spectral features at 7.7 and 8.6 μm sometimes blend into the blue edge of 10 μm silicate features and are therefore often hard to distinguish. The same situation happens on the red edge of the 10 μm silicate feature with the 11.3 μm PAH band, which can even disappear with strong amorphous silicate emission.
We find that the PAH detection rate among the IMTT stars is 27%. When also considering tentative detections, the detection rate becomes 44%. In comparison, the detection rate of PAH emission among HAeBe stars is 70% (Acke et al. 2010), and it is only 8% among T Tauri stars (Geers et al. 2006). This positions the IMTT stars, with a higher average luminosity and temperature than the low-mass T Tauri stars but a weaker UV field than the HAeBe stars, in-between these two groups in terms of detection rate. The infrared emission from PAH molecules, for isolated stars, is caused by stellar UV photons that excite electronic states in the PAH molecule, which subsequently de-excites through vibrational emission in stretching and bending mode resonances. The PAH detection rate correlates with the Teff of the star since the UV radiation field is stronger the hotter the star is (Furlan et al. 2006; Acke et al. 2010).
In order for PAHs to be excited, they need be in a region optically thin of UV radiation. This could be in the surface of a flaring disk (e.g., HD 97048, Lagage et al. 2006), the inner rim of the disk, or in a region where small dust grains are removed while PAHs are still present (e.g. disk gaps or in settled disks, Geers et al. 2007; Woitke et al. 2016). It is therefore interesting to consider the PAH detection rate and strength as a function of disk geometry. In the HAeBe sample, the PAH detection rates for group Group I and Group II sources are 80 and 64%, respectively, and PAH emission is generally stronger in Group I disks. Both observations can be understood because Group I sources show large gaps and/or dust-depleted inner disk regions where the UV photons can freely propagate. In contrast, in Group II disks the PAH emission is likely to come from a decoupling of the gas from the dust where the dust has settled toward the mid-plane but the gas is still flaring (Acke et al. 2010); alternatively, the disk is small.
We find that the PAH detection rate in the IMTT Group I and Group II sources are 47 and 17%, respectively. Adding the tentative rate, it becomes 73% for Group I and 29% for Group II. We find that the Group I disks around IMTT stars have on average stronger PAH bands than in Group II disks, as is the case for the HAeBe stars. We conclude that the main difference between HAeBe stars and IMTT is the smaller strength of the PAH bands in the IMTT spectra, but that otherwise both samples show more frequent detection in Group I disks.
Some the most prominent PAH features are seen in SR 21, Haro 1-6, and V2149 Ori. The PAH emission around V2149 Ori, which is classified as a Group I/II disk, is likely to arise from the disk (Kim et al. 2013), but due to its location 9 arcmin away from M42s center and just outside the HII region, the radiation exiting the PAH might come from the surrounding hotter stars and not from the binary itself.
The intensity of UV radiation also affects the chemistry of the PAH molecules (Acke et al. 2010). In our sample, we find that the peak of the 6.2 and 7.7 micron PAH bands are often shifted to 6.3 and 7.8 μm. One explanation for this could be that stronger UV radiation field increases the ratio of aromatic to aliphatic hydrocarbons (Sloan et al. 2007; Keller et al. 2008). When the UV radiation field decreases, the 6.2 and 7.7 μm emission band shifts toward the red. It can be observed that when Teff decreases, these emission bands experience this shift that is consistent with lower UV flux from the central star. The emission at 6.2 and 7.7 μm emission is redshifted in many of the spectra, which can also be seen in cooler T Tauri stars (Acke et al. 2010).
4 Discussion
We constructed a sample of nearby stars, the IMTT stars, that we consider to be likely progenitors of the class of well-studied HAeBe stars. The SEDs for the sample can be seen in Fig. 8. We did so in order to facilitate a better understanding of the evolution of gas-rich protoplanetary disks. Here, we discuss our findings and try to give them an interpretation.
4.1 Sample and stellar parameters
The masses of the IMTT stars found using our method of selection are predominately located in the lower region of the selection mass interval. The median mass of the sample is 1.87 M⊙. This is partly because of the IMF but mostly because we created an optically selected sample of the most massive T Tauri stars. The method only includes stars that have already cleared their stellar envelope, which is confirmed by the fact that most stars in the sample show a low to moderate reddening (see Table 3). This means we do not have the very youngest and more massive stars in our sample. The lack of higher mass stars (≥ 4 M⊙) in our specified spectral type range is consistent with a shorter evolutionary timescale for higher mass stars and the fact that they are less frequent. Within our distance limit of 500 pc, we expect very young and massive PMS stars to be present only in the Orion SFR. For stars with a high extinction (e.g., a high inclination, near edge-on disk, or remaining cloud material in a Lada class 0/I object), our luminosity and mass estimates could be lower than the real values.
The Gaia DR2 parallaxes for the final sample where compared with the new EDR3 release parallaxes. No significant differences were found for stars with RUWE ≤ 1.4. To determine the mass and age, we used Siess et al. (2000) pre-main-sequence stellar evolutionary tracks using a solar-like metallicity (z = 0.01). We note that stellar evolution is dependent on metallicity and that in turn masses and ages are affected by the choice of metallicity in the stellar models. A higher metallicity results in higher masses and older stars. However, assuming a solar metallicity in the solar neighborhood corresponds well with G, F, and early B-type stars (Sofia & Meyer 2001; Przybilla et al. 2008).
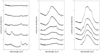 |
Fig. 5 Continuum-divided normalized peak strength over the 10 μm feature for those sources classified as Group I. The continuum between 7.5 and 13.5 μm has been normalized to 1. Leftmost panel: spectra of sources were no detection of a silicate feature is found: (a) Haro 1-6, (b) EM*SR 21, (c) V815 Ori, (d) UX Tau, and (e) HBC 502. From the second from left panel: disks with detected silicate features are shown in ascending order of peak strength: (f) HBC 338, (g) LkHα 330, (h) V395 Cep, (i) HD 142527, (j) GW Ori, (k) DI Cep, (l) BX Ari, (m) EZ Ori, (n) AK Sco, (o) LkHα 310, and (p) V1044 Ori. The scale is indicated in the leftmost panel and is the same for all sources. Spectra are shifted to allow comparison. |
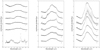 |
Fig. 6 Continuum-divided normalized peak strength over the 10 μm feature for those sources classified as Group II. The continuum between 7.5 and 13.5 μm has been normalized to 1. Only (a) V2149 Ori does not have a detectable silicate feature. The other sources then follow in ascendingorder of peak strength: (b) HD 294260, (c) CO Ori, (d) PR Ori, (e) HD 35929, (f) DI Cha, (g) BE Ori, (h) HT Lup, (i) HD 142666, (j) GX Ori, (k) HBC 442 (l) V1650 Ori, (m) CR Cha, (n) CV Cha, (o) RY Ori, (p) RY Tau, and (q) HD 144432.The scale is indicated in the leftmost panel and is the same for all sources. Spectra are shifted to allow comparison. |
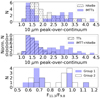 |
Fig. 7 Upper panel: 10 μm peak-over-continuum distribution among the HAeBe stars (Juhász et al. 2010) in comparison with the IMTT star sample. Middle panel: 10 μm peak-over-continuum distribution among T Tauri stars (Furlan et al. 2011) in comparison with the intermediate-mass star samples (IMTTs+HAeBe). Because of the large difference in sample size, the distributions have been normalized so that their peak value equals 1. Lower panel: distribution in the F11.3 /F9.8 ratio clearlyshowing the separation between the large grain group and the smaller grain group among the IMTT stars, as well as the fact that Group 1 disks more commonly have smaller grains. |
4.2 The disks
We show that we find similar disks to the HAeBe sample of Juhász et al. (2010), where the Group I disks represent 38% of the population. Among the IMTT stars, there is a more even distribution of 51% Group I, which is not too different from the HAeBe stars given the sample size. Comparing the SEDs we see that they are similar except for the most extreme 7μm excess cases that can be understood by bolometric correction effects. Comparing the spatially resolved data in the literature for the IMTT star sample to that of the HAeBe stars, we see that the disks around IMTT stars also show gaps, rings, and spirals, suggesting disks around IMTT stars are not very different from those around the HAeBe stars.
Sixty percent of the Group I disks and all Group II disks show silicate emission at 10μm in our sample. In the HAeBe sample (Juhász et al. 2010), silicate emission is present in 75% of the Group I disks and 87% of the Group II disks. The relationship between the strength and shape of the 10 μm silicate feature (Figs. 4 and 7, top and middle panel, respectively) is consistent with the relationship found among the HAeBe stars (van Boekel et al. 2005), which suggests that in terms of silicate grain size and growth the grains in IMTT disks are very similar to the HAeBe disks. The emission from silicate dust grains at 10 μm in the IMTT sample can be seen in more than half the Group I disks, with a wide silicate strength distribution from PAH-dominated disks without a silicate feature to those with very strongly peaked features. A silicate emission feature at 10 μm is present in all Group II disks (with the exception of V2149 Ori) with on average lower peak strength than in the Group I sources. This may be explained in the following way: the small silicate grains that give rise to the solid state feature at 10 μm are missing from some Group I disks, either because they have grown to a distribution above ~5 μm (Olofsson et al. 2013) or because the disk has a cleared-out cavity at the desired temperature and location where the emission normally comes from (Maaskant et al. 2013). In terms of shape and strength, the IMTT silicate features are clustered in two groups: one with small pristine grains (strong, peaked feature) and one consistent with more processed grains (weak, broad feature); this can be seen in Fig. 7. This grouping is not present in the silicate emission feature distribution for the T Tauri stars (Furlan et al. 2009) or for the HAeBe stars (Juhász et al. 2010). About twice as many Group I sources show signs of more pristine small silicate grains, while for the Group II disks, the opposite seems to be the case, with more disks having a more processed grain population with larger silicate grains.
The detection rate for emission of PAH molecules in the sample is 27%. This puts the IMTT stars in-between the HAeBe (about 70%) and the T Tauri stars (about 8%). The PAH bands are generally weak with only a few exceptions. This is most likely because IMTT stars are cooler than the HAeBe stars and therefore have a lower UV flux, which is needed to excite the PAHs. As luminosity and temperature decrease, so does the relative contrast of the PAH emission to the continuum, and the PAHs disappear among the classical T Tauri stars. The relatively weak PAH emission could also be a reason why we find weaker silicate emission in our sample and why the Group Ib disks are less frequent in the IMTT star sample than among the HAeBe stars, since weaker PAH emission would make any level silicate emission easier to distinguish.
We find that spatially resolved data available in the literature (see Appendix C) confirm our classification in most cases. Disk features such as spirals and gaps are also present among the IMTT stars, suggesting that the disks are already evolved. There are indications that planets form at early stages of disk dissipation and that the process happens quickly (Andrews et al. 2018; Long et al. 2018; Zhang et al. 2018; van der Marel et al. 2019), and the transition disk lifetime is thought to be short at ~0.5 Myr (Cieza et al. 2007). Looking at the similarity between IMTT and HAeBe disks, this suggests that disk dissipation and planet formation starts early in some disks and later in others. Considering that disk lifetimes are typically on the order of a few Myr (Alexander et al. 2014; Cieza et al. 2007), it is interesting that the disks around IMTT stars are so similar to the HAeBe stars given that the timescale over which the IMTT star evolves into a HAeBe star is considerably longer.
If there were a evolutionary link between the pre-transitional Group I and Group II disks, one would expect the Group II disks to be the dominant disk type at this earlier stage in the evolution since disk dispersal happens from the inside out in the disk (Koepferl et al. 2013), something that is not apparent in the sample presented here. For these disks to show up in both the HAeBe and IMTT star sample, they need to have a significant lifetime.
Disk gaps can form early in the IMTT stars as well as late in the HAeBe stars, or maybe even earlier, and persist for a long time. In order to prevent the inner disk in a gapped disk from quickly emptying onto the star, it needs to be continuously replenished by the outer disk’s gas and some dust that crosses the gap to the inner disk. If the disk dissipation can be postponed to the later stages of HAeBe stars, one may expect to find a higher fraction of IMTT stars with gapless disks. But our sample contains roughly equal amounts of Group I (gapped) and Group II (self-shadowed) disks. In addition, the ratio is not very different from that in the HAeBe stars. This may point to a lifetime of gapped disks, which is significant. It is hard to imagine a scenario where small Group II disks evolve into large Group I disks. It suggests that Group I and Group II disk evolution are disconnected from each other. Perhaps Group I and Group II disks evolve from different parent populations whose parameters are set by the environment at a very early stage.
Index of PAH detections in the Spitzer spectra. The “x” indicates where a detectable feature is identified.
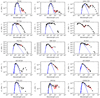 |
Fig. 8 SED with fit Kurucz model. The Kurucz model is in blue, literature photometry is in black (see references in Table 4), and Spitzer spectra are in red. |
5 Conclusions
The constructed list will serve as a basis for further studies of the IMTT stars and their disks. The sample is not an exhaustive or finalised list and is likely to grow as more of these stars are identified.
- 1.
With our selection method and criteria, we find 49 IMTT stars with infrared excess out of which six are debris disks and 44 are gas-rich disks. Some have been studied earlier as lower mass HAeBe stars and 10 are new IMTT stars previously classified as T Tauri stars.
- 2.
The sample disks show a more even distribution between Group I and Group II disk geometries than HAeBe samples.
- 3.
The frequency of detected silicate emission is about the same as in the HAeBe samples per disk group and the relationship between strength and shape of the 10 μm emissionfollow the same anticorrelation as the HAeBe stars and points toward grain sizes that are comparable to those of the HAeBe stars.
- 4.
The reddest disks we find, [F30∕F13.5] ≥ 5, are consistent with Group I disks with large central cavities and weak or zero silicate emission.
- 5.
The presence of PAH emission is less frequent in the IMTT star spectra in the sample than among the HAeBe stars, but it is more frequent than among the T Tauri stars. This is probably caused by an on average decreasing effective temperature of HAeBe stars, IMTT stars, and lower mass T Tauri stars, respectively, and the corresponding lower UV flux.
- 6.
Disk dissipation (and therefore planetary formation) seems to takes place early in some disks but not in others.
- 7.
Implications are that Group I and Group II disks represent two different evolutionary paths a disk can take; this is determined at a very early stage of evolution. This is consistent with the conclusion drawn by Garufi et al. (2017).
As we have seen, the youngest disks in our sample already show many of the features familiar to older disks. It seems that disk evolution and structure formation happen very early and that catching disks in an undisturbed state may remain difficult.
Acknowledgements
This publication makes use of data products from the Wide-field Infrared Survey Explorer, which is a joint project of the University of California, Los Angeles, and the Jet Propulsion Laboratory/California Institute of Technology, funded by the National Aeronautics and Space Administration. This work has made use of data from the European Space Agency (ESA) mission Gaia (https://www.cosmos.esa.int/Gaia), processed by the Gaia Data Processing and Analysis Consortium (DPAC, https://www.cosmos.esa.int/web/Gaia/dpac/consortium). Funding for the DPAC has been provided by national institutions, in particular the institutions participating in the Gaia Multilateral Agreement. This research has made use of the SIMBAD database, operated at CDS, Strasbourg, France. This research has made use of the VizieR catalogue access tool, CDS, Strasbourg, France (DOI: 10.26093/cds/vizier). The original description of the VizieR service was published in A&AS 143, 23. We would also like to thank MSc. Erik Gisolf for his contribution to this paper. Finally we thank the anonymous referee for constructive comments that improved the paper significantly.
Appendix A High RUWE in the final sample
Here, we describe the distance determination for those sources where the Gaia RUWE is larger than 1.4 or where no Gaia parallax was available.
A.1 LkHα 330
For LkHα 330, we confirmed the parallax using the early Gaia DR3 release and compare the proper motion with stars in a 10 arc minute radius around the star with similar parallaxes. LkHα 330, locatedin Perseus, has a distance of 308 pc (Bailer-Jones et al. 2018). Examining the DR3 propermotion puts it in a group of 34 stars. The average proper motion of this group is RA 4.19 mas yr−1 (σ = 0.37) and Dec −6.00 mas yr−1 (σ = 0.61), compared to the proper motion of LkHα 330, RA 4.58 mas yr−1 and Dec −5.66 mas yr−1, respectively. Within the group the range of parallaxes are 2.96–3.99 mas. The DR2 parallax of LkHα 330 is 3.22. We find that this strengthens the estimated distance from Bailer-Jones et al. (2018).
A.2 HQ Tau
Using the same approach for HQ Tau, we find a similar proper motion, RA 10.87 mas yr−1 Dec −18.98 mas yr−1, as a small group of 7 stars with an average proper motion of RA 10.68 mas yr−1 (σ = 0.5) and Dec −17.55 mas yr−1 (σ = 1.38). The spread of parallaxes of these stars range from 6.09 to 6.71 with HQ Tau parallax at 6.2. We consider it likely that these stars are a small co-moving group. This is also strengthened by the fact that the Gaia DR2 parallax lies within 1σ of the parallax determined from very-long-baseline interferometry (VLBI), which associates HQ Tau with the HP Tau/G2 group (Rizzuto et al. 2020). HQ Tau association with this group further strengthens the parallax and we therefore used the distance according to Bailer-Jones et al. (2018) despite the large RUWE.
A.3 RY Tau
The distance for RY Tau differs greatly between Gaia DR1 and DR2 measurements (corresponding to 176 pc and 442 pc, respectively). The previous HIPPARCOS measurement puts RY Tau at a distance of 133 pc. The inverted EDR3 parallax suggests that the distance is 138 pc, but the RUWE is still very high (~13). Using the proper motion of RY Tau, Garufi et al. (2019) argued that it is most likely a member of the Taurus star-forming region and that a distance based on the inverted HIPPARCOS PARALLAX of 133 pc is likely correct. We therefore used the HIPPARCOS distance for RY Tau.
A.4 HT Lup
Due to the similarity between the Gaia DR2 and HIPPARCOS parallax for HT Lup 6.48 and 6.29 mas, respectively, we decided to use the value from Bailer-Jones et al. (2018).
A.5 GW Ori
GW Ori lies in the λ Ori association and comparing the distance of the association,  pc with that of Bailer-Jones et al. (2018),
  pc, strengthens the Gaia measurement despite the high RUWE. We decided to use the Gaia- based distance.
A.6 EZ Ori
EZ Ori was identified by radial velocity as a member of ONC-23 group of stars ( pc) (Kounkel et al. 2018). This confirms the distance from Bailer-Jones et al. (2018) (
 ) pc.
) pc.
A.7 Ass Cha-T2 21 and Ass Cha-T2
The stars Ass Cha-T2 21 and Ass Cha-T2 54 are members of the Chameleon I molecular cloud. The estimated distances from the Gaia parallax by Bailer-Jones et al. (2018),  and
and  respectively, both overlap with the determined distance to Chameleon I
  (Voirin et al. 2018). We therefore use the distances in Bailer-Jones et al. (2018) for both stars.
A.8 PR Ori
PR Ori is a member of the Lynds 1641 molecular cloud (Mader et al. 1999). A distance determination to Lynds 1641 was made by Yan et al. (2019) using Gaia DR2 parallaxes. The cloud distance  pc is slightly larger than that derived by Bailer-Jones et al. (2018) (~374 pc). We choose to adapt the cloud distance rather then the Gaia derived distance as the distance to PR Ori.
A.9 T Tau
The parallax of T Tau was measured by Galli et al. (2018) using the VLBI indicating a distance of 148.7(± 1.0) pc, which corresponds well to the Gaia- based distance of 143.74 pc.
pc.
A.10 V2149 Ori, UX Tau and HD 288313A
For three stars, no Gaia DR2 parallaxes were available, and we searched the literature for distances. V2149 Ori is a member of the Orion Nebula Complex, and we used the distance 388 ± 5 pc (Villebrun et al. 2019). For UX Tau, we used the distance given in Akeson et al. (2019), 139.4 ± 1.96 pc. HD 288313A is located in Lynds 1622 at a distance of 418 ± 17 (Zucker et al. 2020).
Appendix B Model SEDs
A key difference between the classical HAeBe stars and the precursors we identify in this paper is the temperature of the start itself. In order to check what difference in the measured disk quantities is down to this change only, and how this compares to the effects of a variation in the scale height of the inner disk, we computed a simple grid of SEDs. For this purpose, we considered a 2 M⊙ PMS star using calculated model SEDs for a passively irradiated disk using stellar parameters taken from the Siess et al. (2000) evolutionary tracks (see Table B.1). We used the temperature range between Teff = 4900K and Teff = 9000K. We used theMonte Carlo radiative transfer code MCMax (Min et al. 2009) and the DIANA model setup (Woitke et al. 2019) to calculate the SEDs (Table B.2). We fixed the inner rim dust temperature to 1500 K, which means that the disk inner radius increases with increasing stellar luminosity as the star approaches the zero age main sequence. We ignored the possible effects of an evolving dust grain population, such as grain settling that may vary in time, inward drift, gaps, holes, and planet formation on the dust distribution. We chose two values for the disk scale height at 0.4 AU (0.041 and 0.08 AU) tostudy the effect of the inner disk scale height on the resulting SED. We derived model values for the [F30 ∕F13.5] flux ratio and the 7 μm excess.
Stellar parameters following the evolutionary track of a 2 M⊙ PMS star (Siess et al. 2000).
Disk parameters used for the evolution model SED.
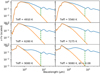 |
Fig. B.1 SEDs of a 2 M⊙ PMS star surrounded by a passively heated gas/dust disk. We used a range of luminosities and temperatures (see Table B.1) representative of the evolution along a Siess et al. (2000) evolutionary track. The vertical flux scale is normalized to its maximum value for each model. Disk parameters are listed in Table B.2. The dashed line indicates the 7 μm excess point. Lower right panel: effect of increasing the disk scale height at 0.4 AU from 0.041 to 0.08 AU for the Teff = 9080 K model. |
Figure B.1 shows our small model grid, for which 7 μm excess values increase from 2.7 to 4.6 magnitudes as Teff increases from 4910 to 9080 K. Increasing the 0.4 AU disk scale height from 0.041 to 0.08 AU changes these numbers to 3.6 and 5.6 magnitudes, respectively.The [F30∕F13.5] remains relatively constant at values between 1.7 and 2.1 for all models. We conclude that an increase in Teff results in a blueward shift of the stellar SED and therefore an increase in 7 μm excess of about 2 magnitudes. There seems no need for changes in the inner disk structure to explain the difference in the maximum 7 μm excess between IMTT and HAeBe stars. At the same time, these (gapless) models, as expected, do not account for the wide range in observed [F30 ∕F13.5]. We refer the reader to Acke et al. (2009) for a full discussion on the effect of model parameters on the [F30 ∕F13.5] flux ratio.
Appendix C Individual sources
In this section, we discuss the gas-rich disks of stars in the sample for which we have found publicly available spatially resolved data, in scattered light or at millimeter wavelengths. For each star, we checked if the spatially resolved data support the Group I or Group II classification based on the SED (Sect. 5). In scattered light and at millimeter wavelengths, the Group I disks can be identified as having large disk cavities (≥ 5 AU), while GroupII disks are smaller continuous disks lacking large cavities (Garufi et al. 2017).
C.1 LkHα 330
The first detection of the disk was made in IRAS survey data (Weintraub 1990; Weaver & Jones 1992). The disk has an inner cavity first detected by Brown et al. (2007). Using submillimeter imaging, the cavity was determined to be ~50–70 AU (Brown et al. 2009; Andrews et al. 2011), with the outer disk extending to ~125AU (Brown et al. 2009). This is consistent with our SED classification for the disk as a Group I source. Using millimeter-wave interferometry, Isella et al. (2013) found a lopsided ring of ~100 AU in the 1.3 mm dust continuum, the cause of which they suggested to be planet-disk interaction. Observations with the SUBARU in H-band and at 0.87 mm revealed a spiral structure in the disk (Akiyama et al. 2016) explained by the possibility of an unseen planet companion in the disk. Revisiting the star with SUBARU, Uyama et al. (2018) found the gap in scattered light to be ~54 AU and also clearly detected the spiral arms.
C.2 RY Tau
An active X-ray source (Skinner et al. 2016) with a visible jet (Agra-Amboage et al. 2009; Garufi et al. 2020), RY Tau has a spectral slope of a Group II disk. ALMA observations reveal a 60 AU disk with a small central cavity with two rings (at ~18 AU and ~50 AU) and a gap (~43 AU) (Pinilla et al. 2018; Long et al. 2018), while Francis & van der Marel (2020) reported an inner cavity of 27 AU. In H-band observations with SUBARU, a disk similar in size to the ALMA observations was detected, but the cavity, rings, and gap were not detected (Takami et al. 2013).
C.3 UX Tau
UX Tau is atriple system with components A, B, and C. The B component is also a binary. The disk around UX Tau A based on its SED is a Group Ia disk. This was already classified as pre-transitional by Tanii et al. (2012). The disk is strongly polarized, geometrically thin, and it extends to 120AU (Tanii et al. 2012). An inner cavity was detected by Espaillat et al. (2007) and later determined to measure 25–30AU (Andrews et al. 2011; Tanii et al. 2012; Pinilla et al. 2014), which is consistent with our classification. The disk has a spiral structure visible both in scattered light and in gas continuum (Zapata et al. 2020; Ménard et al. 2020). The spiral arms likely come from tidal interaction with UX Tau C toward which one of the arms also extend (Zapata et al. 2020). Zapata et al. also further detected a disk around UX Tau C, and material they suggest is probably coming from the interaction with the disk of the A component.
C.4 HQ Tau
The dusk around HQ Tau was first classified as a possible debris disk (Andrews & Williams 2005) later reclassified as a transitional disk (Furlan et al. 2009; Luhman et al. 2010). ALMA observations of the disk (Long et al. 2019) reveal a compact disk with indications of dust depletion toward the inner disk. Our classification as a Group IIa disk fits well with this observation.
C.5 SU Aur
Hartmann et al. (2005) used IRAC and was the first to detect the infrared excess of SU Aur. Akeson et al. (2005) determined the inner diameter of the dusty disk to be ~0.2 AU based on modeling using the observations of 2MASS J, H, and K band. The disk was studied with both ALMA (de Leon et al. 2015) and SUBARU (Uyama et al. 2017; Akiyama et al. 2019), which shows the disk to be disturbed and have a long tail-like structure extending a thousand AU possibly caused by the interaction of a flyby substellar companion or the ejection of a small object from the disk. Labdon et al. (2019) used the CHARA array to perform interferometric observations of SU Aur. They found the disk started at 0.15 AU extended out to 100 AU with an inclination of 50°. Based on the SED, we find this disk to be a Group I source.
C.6 HD 34700
HD 34700 is a multiple system where the A component a intermediate binary system, 2 M⊙ + 2 M⊙ with a separation of 0.69 AU. (Arellano Ferro & Giridhar 2003; Sterzik et al. 2005; Monnier et al. 2019). The separations of the B and C components to the A component are 5.18″ and 9.17″, respectively (Sterzik et al. 2005). HD 34700A was imaged by the Gemini Planet Imager (GPI; Monnier et al. 2019), which showed a very prominent transition disk inclined at 41°, with a series of spiral arms, surrounding the binary (Monnier et al. 2019). This is consistent with our classification from the SED as a Group I disk. The disk (as a large cavity) and begins at 175 AU from the center of the system and extends out to 500 AU. The cavity is too large to be a consequence of only the two stellar components and could be the effect of a massive planet companion (Monnier et al. 2019).
C.7 GW Ori
GW Ori s a triple system (Berger et al. 2011) consisting of a spectroscopic binary (GW Ori AB) with a separation of ~1 AU (Mathieu 1994) and a C component, separated by ~8 AU (Berger et al. 2011). The disk is a circumtriple disk with a dust component extending to ~400 AU and a gas component extending to ~1400 AU. The disk is gapped at 25–55 AU (Fang et al. 2014), and spatially resolved ALMA observations show it to have three dust rings at 46, 188, and 338 AU (Bi et al. 2020), the latter being the largest dust ring presently known in a protoplanetary disk. Our Group I SED classification fit well with this data. The CO kinematics of the disks suggests that there is a misalignment of the inner disk’s spin axis with respect to the outer disk plane (Bi et al. 2020).
C.8 V2149 Ori
V2149 is a known binary star (Köhler et al. 2006), G0+F7 (Daemgen et al. 2012). Kim et al. (2013) classified the disk, based on the fact that the SED was indicative of a central cavity, as transitional and estimated the radius of the disk to 138 AU. We find V2149 Ori to be a Group II disk, but the uncertainty of the spectral index puts it in the border between Group I and Group II disks. Recent scattered light observations with the SPHERE instrument (Valegard et al., in prep.) do not detect any disk. This either means the disk is small or self-shadowed suggesting the Group II classification to be correct.
C.9 CR Cha
The first detection of a disk around CR Cha was made by Henning et al. (1993), classifying the disk as Lada Class II. Espaillat et al. (2010) found that the IRS spectra best fit a pretran- sitional disk model, which is consistent with our classification. A cavity in the disk was suggested by Pinilla et al. (2014) using SED modeling. Varga et al. (2018) used interferometric fitting from MIDI observations to derive an inner disk radius of ~1.3 AU. Observations by Kim et al. (2020) with ALMA Band 6 show no cavity but a gap in the dust continuum at ~90 AU with a width of ~8 AU and a dust ring at ~120 AU. The SED of CR Cha has a spectral slope that places it as a Group IIa source, which is consistent with this continuous inner disk.
C.10 DI Cha
DI Cha is a quadruple system with two binaries, one with a G2 and M 6 star (the latter possibly a brown dwarf), and the second binary consisting of two M 5.5 dwarfs (Schmidt et al. 2013). The angular separation between the two sets of binary stars is 4.6 arcsec. Hendler et al. (2020) found an upper limit of 0.12 arcsec from ALMA continuum imaging (90% light radius) for the millimeter continuum emission centered on the G star, and Menu et al. (2015) derived a size of 14.1 milliarcsec from N-band interferometry. The ALMA and MIDI data taken together suggest a compact disk. From N-band interferometry, Varga et al. (2018) found that the inner disk size is not compatible with a continuous disk but may contain a disk gap on AU spatial scales. The available imaging is consistent with a classification as a GII source.
C.11 CV Cha
CV Cha is a visual binary with an M1 companion at a distance of 11.4 arcsec (Reipurth & Zinnecker 1993). Hendler et al. (2020) resolved the disk in millimeter dust continuum with ALMA and find a size of 0.14 arcsec (90% light radius). Menu et al. (2015) resolve the inner disk in the N band and find a half light radius of 6.1 milliarcsec. The photosphere of CV Cha is heavily veiled, with the accretion shock covering 20–40% of the stellar surface (Herczeg & Hillenbrand 2014). This may introduce some uncertainty in the derived stellar parameters. The available spatial information is consistent with a classification as a GII source.
C.12 HD 135344B
HD135344B is a visual binary with the A0 star HD135344A (angular separation: 21 arcseconds). Many studies are devoted to the geometry of its circumstellar disk. Andrews et al. (2011) spatially resolved the disk at millimeter wavelengths using the SMA and found a dust cavity with a radius of 46 AU. Muto et al. (2012) resolved the disk in scattered light and found two spiral arms at 70 AU fromthe star. Garufi et al. (2013) used NACO at the VLT to measure the radius of the dust in scattered light (probing small grains in the disk surface) and found a radius of 28 AU, much smaller than the 46 AU radius found for the large mid-plane grains. Stolker et al. (2016) and Stolker et al. (2017) found time-variable shadows cast on the outer disk, probably resulting from changes in the inner disk structure. van der Marel et al. (2016) resolved the millimeter dust into a ring at 50 AU and an asymmetric structure at 70 AU (see also Cazzoletti et al. (2018)). These observations convincingly show that HD135344B is a transitional disk (GI), in which planet formation is the likely cause of the observed disk geometry.
C.13 HT Lup
HT Lup is atriple system: HT Lup A, B, and C. We classify the disk as Group II, which is consistent with DSHARP ALMA continuum images that show a small disk with spiral arm structure around the A component that spans roughly 30 AU (Andrews et al. 2018; Kurtovic et al. 2018). The B and C components have disks of 5 and 9 AU, respectively (Kurtovic et al. 2018). The disk has also been observed by SPHERE (Garufi et al. 2020), and the scattered light signal is consistent with the disk being observed by ALMA for HT Lup A. The disks around the B and C components are not resolved in the scattered light images, neither is the spiral arm structure around the primary component.
C.14 HD 142666
DSHARP ALMA continuum images of HD 142666 reveal the presence of relatively narrow rings at distances between 6 and 40 AU, and an outer radius of about 90 AU (Andrews et al. 2018; Huang et al. 2018a). The innermost 6 AU seem devoid of large, cold grains (Rubinstein et al. 2018). The disk is detected In scattered light, although weakly (Garufi et al. 2017). This star was classified as Group II by Meeus et al. (2001). Schegerer et al. (2009) found evidence from near-infrared interferometry for a gap at 0.5 AU. A comparison of disk size in the near- and mid-infrared by Gravity Collaboration (2019) strongly suggests that there is a substantial inner disk structure. The classification of HD 142666 as a Group II source can still be understood by the fact that the gap dimension is too small to cause a significant imprint on the SED, which was the basis for the classification. The case of HD 142666 illustrates that the Group I and Group II classification by Meeus et al. (2001), while providing a useful separation between “self-shadowed” disks and (pre)transitional disks with gaps on scales of 10 AU or more, fails to identify inner disk gaps on AU scales. Nevertheless, the outer disk does not receive much direct stellar light, as evidenced by the weak signal detected with SPHERE (Garufi et al. 2017).
C.15 HD 142527
HD 142527 is perhaps the prototypical GI disk source with a large (~130 AU) gap (Fukagawa et al. 2006; Fujiwara et al. 2006; Ohashi 2008; Casassus et al. 2013; Avenhaus et al. 2014; Rodigas et al. 2014). The prominent shadows detected in scattered light are explained by a highly inclined inner disk (Marino et al. 2015). SMA and ALMA data reveal a horseshoe distribution of dust in the outer disk, usually interpreted as a dust trap Ohashi 2008; Casassus et al. 2013; see van der Marel et al. 2013). A stellar mass companion was detected close to the outer radius of the inner disk (Biller et al. 2012; Lacour et al. 2016), which itself is surrounded by an accretion disk. Our SED-based classification is confirmed by these observations.
C.16 Haro 1-6
Haro 1-6 is a Group I disk based on its SED with one of the highest [F30/F13.5] in the sample. Images in scattered light taken by SPHERE only marginally detect a disk signal around the edges of the coronograph(Garufi et al. 2020) with several bright filaments extending around the star. Garufi et al. (2020) suggested that these filaments do not have anything to do with the formation of Haro 1-6. No millimeter emission is detected around Haro 1-6 (Cieza et al. 2019). Loinard et al. (2008) suggested Haro 1-6 to be a spectroscopic binary. The PAH emission could have its source either from the strong far-UV and X-ray radiation coming from the binary, which excites the PAHs in a disk in its last stages of clearing or from a small-scale photodissociation region (Jensen et al. 2009).
C.17 EM*SR 21
SR21, at a distance of  pc (Gaia Collaboration 2018) has a binary companion in a wide orbit (Barsony et al. 2003). It might also be a compact binary with the projected distance of about 0.1″ (Eisner et al. 2009). SR21 has been classified as a transition disk already based on the shape of the spectrum seen by Spitzer (Brown et al. 2007). Andrews et al. (2011) and Pérez et al. (2014) showed the presence of a large cavity in submillimeter continuum emission, again consistent with a transitional disk. Recently, Muro-Arena et al. (2020) presented combined data from ALMA in Band 3 and SPHERE polarimetric images in the H band showing a large cavity, a bright ring peaking at 53 AU, and spiral structure visible in the scattered light observation inside the main ring, making SR21 a rather unique object. They also show the presence of a kinked spiral connecting the inner and outer disk, matching hydrodynamical predictions of a planet carving the gap and pinpointing its likely position.
C.18 AK Sco
AK Sco is a double-lined spectroscopic binary Andersen et al. (1989) comprised of an F6+F6 couple with a separation of ~0.16 AU (Anthonioz et al. 2015). The circumbinary disk around AK Sco was detected for the first time by Jensen et al. (1996). The overall shape of the SED points toward a Group II disk, but with its steep mid-infrared spectral slope, with [F30∕F13] ~ 3.3, our criteria classify it as a Group Ia disk. It has a strong silicate feature (see Fig. 5) that requires either a different dust opacity or an extreme grain distribution. It is one of the smallest disks detected in polarized light (Garufi et al. 2017). The inner rim of the disk is located at ~0.58 AU (Anthonioz et al. 2015). The polarized light observations show the radius of the disk to be ~13–40 AU (Janson et al. 2016) with sharp features either from an eccentric ring or a spiral arm structure. It also confirms the disk’s compact nature of ~14 AU determined from previous observations by ALMA (Czekala et al. 2015).
References
- Abrahamyan, H. V., Mickaelian, A. M., & Knyazyan, A. V. 2015, Astron. Comput., 10, 99 [Google Scholar]
- Acke, B., & van den Ancker, M. E. 2006, A&A, 457, 171 [NASA ADS] [CrossRef] [EDP Sciences] [Google Scholar]
- Acke, B., Min, M., van den Ancker, M. E., et al. 2009, A&A, 502, L17 [NASA ADS] [CrossRef] [EDP Sciences] [Google Scholar]
- Acke, B., Bouwman, J., Juhász, A., et al. 2010, ApJ, 718, 558 [NASA ADS] [CrossRef] [Google Scholar]
- Agra-Amboage, V., Dougados, C., Cabrit, S., Garcia, P. J. V., & Ferruit, P. 2009, A&A, 493, 1029 [NASA ADS] [CrossRef] [EDP Sciences] [Google Scholar]
- Akeson, R. L., Walker, C. H., Wood, K., et al. 2005, ApJ, 622, 440 [NASA ADS] [CrossRef] [Google Scholar]
- Akeson, R. L., Jensen, E. L. N., Carpenter, J., et al. 2019, ApJ, 872, 158 [Google Scholar]
- Akiyama, E., Hashimoto, J., Liu, H. B., et al. 2016, AJ, 152, 222 [NASA ADS] [CrossRef] [Google Scholar]
- Akiyama, E., Vorobyov, E. I., Baobabu Liu, H., et al. 2019, AJ, 157, 165 [NASA ADS] [CrossRef] [Google Scholar]
- Alexander, R., Pascucci, I., Andrews, S., Armitage, P., & Cieza, L. 2014, in Protostars and Planets VI, eds. H. Beuther, R. S. Klessen, C. P. Dullemond, & T. Henning (Tucson: University of Arizona Press), 475 [Google Scholar]
- Alfonso-Garzón, J., Domingo, A., Mas-Hesse, J. M., & Giménez, A. 2012, A&A, 548, A79 [NASA ADS] [CrossRef] [EDP Sciences] [Google Scholar]
- Ammons, S. M., Robinson, S. E., Strader, J., et al. 2006, ApJ, 638, 1004 [NASA ADS] [CrossRef] [Google Scholar]
- Andersen, J., Lindgren, H., Hazen, M. L., & Mayor, M. 1989, The Messenger, 55, 45 [NASA ADS] [Google Scholar]
- Andrews, S. M. 2020, ARA&A, 58, 483 [CrossRef] [Google Scholar]
- Andrews, S. M., & Williams, J. P. 2005, ApJ, 631, 1134 [Google Scholar]
- Andrews, S. M., Wilner, D. J., Espaillat, C., et al. 2011, ApJ, 732, 42 [Google Scholar]
- Andrews, S. M., Rosenfeld, K. A., Kraus, A. L., & Wilner, D. J. 2013, ApJ, 771, 129 [Google Scholar]
- Andrews, S. M., Huang, J., Pérez, L. M., et al. 2018, ApJ, 869, L41 [Google Scholar]
- Andruk, V. M., Pakuliak, L. K., Golovnia, V. V., et al. 2016, Kinemat. Physi. Celest. Bodies, 32, 260 [Google Scholar]
- Ansdell, M., Williams, J. P., Trapman, L., et al. 2018, ApJ, 859, 21 [Google Scholar]
- Anthonioz, F., Ménard, F., Pinte, C., et al. 2015, A&A, 574, A41 [NASA ADS] [CrossRef] [EDP Sciences] [Google Scholar]
- Arellano Ferro, A., & Giridhar, S. 2003, A&A, 408, L29 [NASA ADS] [CrossRef] [EDP Sciences] [Google Scholar]
- Avenhaus, H., Quanz, S. P., Schmid, H. M., et al. 2014, ApJ, 781, 87 [Google Scholar]
- Azimlu, M., Martínez-Galarza, J. R., & Muench, A. A. 2015, AJ, 150, 95 [Google Scholar]
- Bailer-Jones, C. A. L. 2011, MNRAS, 411, 435 [NASA ADS] [CrossRef] [Google Scholar]
- Bailer-Jones, C. A. L., Rybizki, J., Fouesneau, M., Mantelet, G., & Andrae, R. 2018, AJ, 156, 58 [NASA ADS] [CrossRef] [Google Scholar]
- Barsony, M., Koresko, C., & Matthews, K. 2003, ApJ, 591, 1064 [NASA ADS] [CrossRef] [Google Scholar]
- Bastian, U., Finkenzeller, U., Jaschek, C., & Jaschek, M. 1983, A&A, 126, 438 [NASA ADS] [Google Scholar]
- Benedettini, M., Pezzuto, S., Schisano, E., et al. 2018, A&A, 619, A52 [NASA ADS] [CrossRef] [EDP Sciences] [Google Scholar]
- Benisty, M., Juhász, A., Facchini, S., et al. 2018, A&A, 619, A171 [NASA ADS] [CrossRef] [EDP Sciences] [Google Scholar]
- Berger, J. P., Monnier, J. D., Millan-Gabet, R., et al. 2011, A&A, 529, L1 [NASA ADS] [CrossRef] [EDP Sciences] [Google Scholar]
- Beuzit, J. L., Vigan, A., Mouillet, D., et al. 2019, A&A, 631, A155 [NASA ADS] [CrossRef] [EDP Sciences] [Google Scholar]
- Bi, J., van der Marel, N., Dong, R., et al. 2020, ApJ, 895, L18 [Google Scholar]
- Biller, B., Lacour, S., Juhász, A., et al. 2012, ApJ, 753, L38 [Google Scholar]
- Bouwman, J., Henning, T., Hillenbrand, L. A., et al. 2008, ApJ, 683, 479 [NASA ADS] [CrossRef] [Google Scholar]
- Brown, J. M., Blake, G. A., Dullemond, C. P., et al. 2007, ApJ, 664, L107 [NASA ADS] [CrossRef] [Google Scholar]
- Brown, J. M., Blake, G. A., Qi, C., et al. 2009, ApJ, 704, 496 [NASA ADS] [CrossRef] [Google Scholar]
- Calvet, N., Muzerolle, J., Briceño, C., et al. 2004, AJ, 128, 1294 [Google Scholar]
- Casassus, S., van der Plas, G. M., Perez, S., et al. 2013, Nature, 493, 191 [NASA ADS] [CrossRef] [Google Scholar]
- Cazzoletti, P., van Dishoeck, E. F., Pinilla, P., et al. 2018, A&A, 619, A161 [NASA ADS] [CrossRef] [EDP Sciences] [Google Scholar]
- Cieza, L., Padgett, D. L., Stapelfeldt, K. R., et al. 2007, ApJ, 667, 308 [NASA ADS] [CrossRef] [Google Scholar]
- Cieza, L. A., Swift, J. J., Mathews, G. S., & Williams, J. P. 2008, ApJ, 686, L115 [NASA ADS] [CrossRef] [Google Scholar]
- Cieza, L. A., Ruíz-Rodríguez, D., Hales, A., et al. 2019, MNRAS, 482, 698 [Google Scholar]
- Cohen, M., & Kuhi, L. V. 1979, ApJS, 41, 743 [NASA ADS] [CrossRef] [Google Scholar]
- Coulson, I. M., & Walther, D. M. 1995, MNRAS, 274, 977 [NASA ADS] [Google Scholar]
- Csépány, G., van den Ancker, M., Ábrahám, P., et al. 2017, A&A, 603, A74 [EDP Sciences] [Google Scholar]
- Cutri, R. M., Skrutskie, M. F., van Dyk, S., et al. 2003, VizieR Online Data Catalog: II/246 [Google Scholar]
- Cutri, R. M., et al. 2012, VizieR Online Data Catalog: II/311 [Google Scholar]
- Cutri, R. M., et al. 2014, VizieR Online Data Catalog: II/328 [Google Scholar]
- Czekala, I., Andrews, S. M., Jensen, E. L. N., et al. 2015, ApJ, 806, 154 [NASA ADS] [CrossRef] [Google Scholar]
- Daemgen, S., Correia, S., & Petr-Gotzens, M. G. 2012, A&A, 540, A46 [NASA ADS] [CrossRef] [EDP Sciences] [Google Scholar]
- Da Rio, N., Tan, J. C., Covey, K. R., et al. 2016, ApJ, 818, 59 [NASA ADS] [CrossRef] [Google Scholar]
- de Boer, J., Girard, J. H., Canovas, H., et al. 2017, MNRAS, 466, L7 [NASA ADS] [CrossRef] [Google Scholar]
- de Leon, J., Takami, M., Karr, J. L., et al. 2015, ApJ, 806, L10 [NASA ADS] [CrossRef] [Google Scholar]
- Dominik, C., Dullemond, C. P., Waters, L. B. F. M., & Walch, S. 2003, A&A, 398, 607 [NASA ADS] [CrossRef] [EDP Sciences] [Google Scholar]
- Duchêne, G. 2010, ApJ, 709, L114 [NASA ADS] [CrossRef] [Google Scholar]
- Dullemond, C. P., & Dominik, C. 2004, A&A, 417, 159 [NASA ADS] [CrossRef] [EDP Sciences] [Google Scholar]
- Dunham, M. M., Allen, L. E., Evans, Neal J., I., et al. 2015, ApJS, 220, 11 [Google Scholar]
- Dzib, S. A., Loinard, L., Mioduszewski, A. J., et al. 2013, ApJ, 775, 63 [NASA ADS] [CrossRef] [Google Scholar]
- Dzib, S. A., Loinard, L., Rodríguez, L. F., et al. 2015, ApJ, 801, 91 [NASA ADS] [CrossRef] [Google Scholar]
- Eisner, J. A., Monnier, J. D., Tuthill, P., & Lacour, S. 2009, ApJ, 698, L169 [NASA ADS] [CrossRef] [Google Scholar]
- Espaillat, C., Calvet, N., D’Alessio, P., et al. 2007, ApJ, 670, L135 [Google Scholar]
- Espaillat, C., D’Alessio, P., Hernández, J., et al. 2010, ApJ, 717, 441 [Google Scholar]
- Espaillat, C., Furlan, E., D’Alessio, P., et al. 2010, ApJ, 728, 49 [Google Scholar]
- Espaillat, C., Muzerolle, J., Najita, J., et al. 2014, in Protostars and Planets VI, eds. H. Beuther, R. S. Klessen, C. P. Dullemond, & T. Henning (Tucson: University of Arizona Press), 497 [Google Scholar]
- Esplin, T. L., & Luhman, K. L. 2019, AJ, 158, 54 [Google Scholar]
- Esplin, T. L., Luhman, K. L., & Mamajek, E. E. 2014, ApJ, 784, 126 [Google Scholar]
- Evans, Neal J., I., Allen, L. E., Blake, G. A., et al. 2003, PASP, 115, 965 [NASA ADS] [CrossRef] [Google Scholar]
- Fairlamb, J. R., Oudmaijer, R. D., Mendigutía, I., Ilee, J. D., & van den Ancker, M. E. 2015, MNRAS, 453, 976 [Google Scholar]
- Fang, M., van Boekel, R., Wang, W., et al. 2009, A&A, 504, 461 [NASA ADS] [CrossRef] [EDP Sciences] [Google Scholar]
- Fang, M., Kim, J. S., van Boekel, R., et al. 2013, ApJS, 207, 5 [NASA ADS] [CrossRef] [Google Scholar]
- Fang, M., Sicilia-Aguilar, A., Roccatagliata, V., et al. 2014, A&A, 570, A118 [NASA ADS] [CrossRef] [EDP Sciences] [Google Scholar]
- Fedele, D., van den Ancker, M. E., Acke, B., et al. 2008, A&A, 491, 809 [NASA ADS] [CrossRef] [EDP Sciences] [MathSciNet] [Google Scholar]
- Flaherty, K. M., & Muzerolle, J. 2008, AJ, 135, 966 [NASA ADS] [CrossRef] [Google Scholar]
- Francis, L., & van der Marel, N. 2020, ApJ, 892, 111 [Google Scholar]
- Frasca, A., Guillout, P., Klutsch, A., et al. 2018, A&A, 612, A96 [NASA ADS] [CrossRef] [EDP Sciences] [Google Scholar]
- Fujiwara, H., Honda, M., Kataza, H., et al. 2006, ApJ, 644, L133 [Google Scholar]
- Fukagawa, M., Tamura, M., Itoh, Y., et al. 2006, ApJ, 636, L153 [Google Scholar]
- Furlan, E., Hartmann, L., Calvet, N., et al. 2006, ApJS, 165, 568 [NASA ADS] [CrossRef] [MathSciNet] [Google Scholar]
- Furlan, E., Watson, D. M., McClure, M. K., et al. 2009, ApJ, 703, 1964 [NASA ADS] [CrossRef] [Google Scholar]
- Furlan, E., Luhman, K. L., Espaillat, C., et al. 2011, ApJS, 195, 3 [NASA ADS] [CrossRef] [EDP Sciences] [Google Scholar]
- Gaia Collaboration (Brown, A. G. A., et al.) 2018, A&A, 616, A1 [NASA ADS] [CrossRef] [EDP Sciences] [Google Scholar]
- Galli, P. A. B., Loinard, L., Ortiz-Léon, G. N., et al. 2018, ApJ, 859, 33 [NASA ADS] [CrossRef] [Google Scholar]
- Garufi, A., Quanz, S. P., Avenhaus, H., et al. 2013, A&A, 560, A105 [NASA ADS] [CrossRef] [EDP Sciences] [Google Scholar]
- Garufi, A., Meeus, G., Benisty, M., et al. 2017, A&A, 603, A21 [NASA ADS] [CrossRef] [EDP Sciences] [Google Scholar]
- Garufi, A., Benisty, M., Pinilla, P., et al. 2018, A&A, 620, A94 [NASA ADS] [CrossRef] [EDP Sciences] [Google Scholar]
- Garufi, A., Podio, L., Bacciotti, F., et al. 2019, A&A, 628, A68 [NASA ADS] [CrossRef] [EDP Sciences] [Google Scholar]
- Garufi, A., Avenhaus, H., Pérez, S., et al. 2020, A&A, 633, A82 [CrossRef] [EDP Sciences] [Google Scholar]
- Geers, V. C., Augereau, J. C., Pontoppidan, K. M., et al. 2006, A&A, 459, 545 [NASA ADS] [CrossRef] [EDP Sciences] [Google Scholar]
- Geers, V. C., Pontoppidan, K. M., van Dishoeck, E. F., et al. 2007, A&A, 469, L35 [NASA ADS] [CrossRef] [EDP Sciences] [Google Scholar]
- Getman, K. V., Broos, P. S., Kuhn, M. A., et al. 2017, ApJS, 229, 28 [NASA ADS] [CrossRef] [Google Scholar]
- Girard, T. M., van Altena, W. F., Zacharias, N., et al. 2011, AJ, 142, 15 [NASA ADS] [CrossRef] [Google Scholar]
- Gravity Collaboration (Perraut, K., et al.) 2019, A&A, 632, A53 [NASA ADS] [CrossRef] [EDP Sciences] [Google Scholar]
- Harris, R. J., Andrews, S. M., Wilner, D. J., & Kraus, A. L. 2012, ApJ, 751, 115 [Google Scholar]
- Hartmann, L., Megeath, S. T., Allen, L., et al. 2005, ApJ, 629, 881 [Google Scholar]
- Helou, G., & Walker, D. W. 1988, Infrared Astronomical Satellite (IRAS) Catalogs and Atlases. Volume 7: The Small Scale Structure Catalog [Google Scholar]
- Hein Bertelsen, R. P., Kamp, I., van der Plas, G., et al. 2016, A&A, 590, A98 [NASA ADS] [CrossRef] [EDP Sciences] [Google Scholar]
- Henden, A. A., Levine, S., Terrell, D., & Welch, D. L. 2015, AAS Meeting Abs., 225, 336.16 [Google Scholar]
- Henden, A. A., Templeton, M., Terrell, D., et al. 2016, VizieR Online Data Catalog: II/336 [Google Scholar]
- Hendler, N., Pascucci, I., Pinilla, P., et al. 2020, ApJ, 895, 126 [Google Scholar]
- Henning, T., Pfau, W., Zinnecker, H., & Prusti, T. 1993, A&A, 276, 129 [NASA ADS] [Google Scholar]
- Herbig, G. H. 1960, ApJS, 4, 337 [Google Scholar]
- Herbig, G. H. 1962, Adv. Astron. Astrophys., 1, 47 [NASA ADS] [CrossRef] [Google Scholar]
- Herbig, G. H., & Bell, K. R. 1988, Third Catalog of Emission-Line Stars of the Orion Population (Santa Cruz: Lick Observatory), 3 [Google Scholar]
- Herbst, W., & Shevchenko, V. S. 1999, AJ, 118, 1043 [NASA ADS] [CrossRef] [Google Scholar]
- Herbst, W., Herbst, D. K., Grossman, E. J., & Weinstein, D. 1994, AJ, 108, 1906 [Google Scholar]
- Herczeg, G. J., & Hillenbrand, L. A. 2014, ApJ, 786, 97 [Google Scholar]
- Herschel Point Source Catalogue Working Group (Marton, G., et al.) 2020, VizieR Online Data Catalog: VIII/106 [Google Scholar]
- Hessman, F. V., & Guenther, E. W. 1997, A&A, 321, 497 [NASA ADS] [Google Scholar]
- Hog, E., Fabricius, C., Makarov, V. V., et al. 2000, VizieR Online Data Catalog: I/259 [Google Scholar]
- Honda, M., Maaskant, K., Okamoto, Y. K., et al. 2012, ApJ, 752, 143 [Google Scholar]
- Hsu, W.-H., Hartmann, L., Allen, L., et al. 2012, ApJ, 752, 59 [NASA ADS] [CrossRef] [Google Scholar]
- Hsu, W.-H., Hartmann, L., Allen, L., et al. 2013, ApJ, 764, 114 [NASA ADS] [CrossRef] [Google Scholar]
- Huang, J., Andrews, S. M., Dullemond, C. P., et al. 2018a, ApJ, 869, L42 [Google Scholar]
- Huang, J., Andrews, S. M., Pérez, L. M., et al. 2018b, ApJ, 869, L43 [NASA ADS] [CrossRef] [Google Scholar]
- Huber, D., Bryson, S. T., et al. 2017, VizieR Online Data Catalog: IV/34 [Google Scholar]
- Isella, A., Pérez, L. M., Carpenter, J. M., et al. 2013, ApJ, 775, 30 [NASA ADS] [CrossRef] [MathSciNet] [Google Scholar]
- Ishihara, D., Onaka, T., Kataza, H., et al. 2010, A&A, 514, A1 [NASA ADS] [CrossRef] [EDP Sciences] [Google Scholar]
- Janson, M., Thalmann, C., Boccaletti, A., et al. 2016, ApJ, 816, L1 [Google Scholar]
- Jensen, E. L. N., Mathieu, R. D., & Fuller, G. A. 1996, ApJ, 458, 312 [Google Scholar]
- Jensen, E. L. N., Cohen, D. H., & Gagné, M. 2009, ApJ, 703, 252 [NASA ADS] [CrossRef] [Google Scholar]
- Joy, A. H. 1945, ApJ, 102, 168 [NASA ADS] [CrossRef] [Google Scholar]
- Juhász, A., Bouwman, J., Henning, T., et al. 2010, ApJ, 721, 431 [NASA ADS] [CrossRef] [Google Scholar]
- Keller, L. D., Sloan, G. C., Forrest, W. J., et al. 2008, ApJ, 684, 411 [NASA ADS] [CrossRef] [Google Scholar]
- Kervella, P., Arenou, F., Mignard, F., & Thévenin, F. 2019, A&A, 623, A72 [NASA ADS] [CrossRef] [EDP Sciences] [Google Scholar]
- Khalafinejad, S., Maaskant, K. M., Mariñas, N., & Tielens, A. G. G. M. 2016, A&A, 587, A62 [NASA ADS] [CrossRef] [EDP Sciences] [Google Scholar]
- Kim, K. H., Watson, D. M., Manoj, P., et al. 2013, ApJ, 769, 149 [NASA ADS] [CrossRef] [Google Scholar]
- Kim, S., Takahashi, S., Nomura, H., et al. 2020, ApJ, 888, 72 [Google Scholar]
- King, J. R. 1993, AJ, 105, 1087 [NASA ADS] [CrossRef] [Google Scholar]
- Koepferl, C. M., Ercolano, B., Dale, J., et al. 2013, MNRAS, 428, 3327 [NASA ADS] [CrossRef] [Google Scholar]
- Köhler, R., Petr-Gotzens, M. G., McCaughrean, M. J., et al. 2006, A&A, 458, 461 [NASA ADS] [CrossRef] [EDP Sciences] [Google Scholar]
- Kounkel, M., Hartmann, L., Loinard, L., et al. 2014, ApJ, 790, 49 [NASA ADS] [CrossRef] [Google Scholar]
- Kounkel, M., Megeath, S. T., Poteet, C. A., Fischer, W. J., & Hartmann, L. 2016, VizieR Online Data Catalog, J/ApJ/821/52 [Google Scholar]
- Kounkel, M., Hartmann, L., Loinard, L., et al. 2017, ApJ, 834, 142 [Google Scholar]
- Kounkel, M., Covey, K., Suárez, G., et al. 2018, AJ, 156, 84 [NASA ADS] [CrossRef] [Google Scholar]
- Kraus, A. L., & Hillenbrand, L. A. 2009, ApJ, 704, 531 [Google Scholar]
- Kunder, A., Kordopatis, G., Steinmetz, M., et al. 2017, AJ, 153, 75 [Google Scholar]
- Kurtovic, N. T., Pérez, L. M., Benisty, M., et al. 2018, ApJ, 869, L44 [Google Scholar]
- Labdon, A., Kraus, S., Davies, C. L., et al. 2019, A&A, 627, A36 [EDP Sciences] [Google Scholar]
- Lacour, S., Biller, B., Cheetham, A., et al. 2016, A&A, 590, A90 [NASA ADS] [CrossRef] [EDP Sciences] [Google Scholar]
- Lagage, P.-O., Doucet, C., Pantin, E., et al. 2006, Science, 314, 621 [NASA ADS] [CrossRef] [PubMed] [Google Scholar]
- Lasker, B. M., Lattanzi, M. G., McLean, B. J., et al. 2008, AJ, 136, 735 [NASA ADS] [CrossRef] [PubMed] [Google Scholar]
- Lavail, A., Kochukhov, O., Hussain, G. A. J., et al. 2017, A&A, 608, A77 [NASA ADS] [CrossRef] [EDP Sciences] [Google Scholar]
- Laws, A. S. E., Harries, T. J., Setterholm, B. R., et al. 2020, ApJ, 888, 7 [Google Scholar]
- Lebouteiller, V., Barry, D. J., Spoon, H. W. W., et al. 2011, ApJS, 196, 8 [NASA ADS] [CrossRef] [Google Scholar]
- Loinard, L., Torres, R. M., Mioduszewski, A. J., & Rodríguez, L. F. 2008, Rev. Mex. Astron. Astrofís. Conf. Ser., 34, 14 [Google Scholar]
- Long, F., Pinilla, P., Herczeg, G. J., et al. 2018, ApJ, 869, 17 [NASA ADS] [CrossRef] [Google Scholar]
- Long, F., Herczeg, G. J., Harsono, D., et al. 2019, ApJ, 882, 49 [Google Scholar]
- Luhman, K. L., & Mamajek, E. E. 2012, ApJ, 758, 31 [NASA ADS] [CrossRef] [Google Scholar]
- Luhman, K. L., & Muench, A. A. 2008, ApJ, 684, 654 [Google Scholar]
- Luhman, K. L., Allen, L. E., Allen, P. R., et al. 2008, ApJ, 675, 1375 [NASA ADS] [CrossRef] [Google Scholar]
- Luhman, K. L., Allen, P. R., Espaillat, C., Hartmann, L., & Calvet, N. 2010, ApJS, 186, 111 [NASA ADS] [CrossRef] [Google Scholar]
- Maaskant, K. M., Honda, M., Waters, L. B. F. M., et al. 2013, A&A, 555, A64 [NASA ADS] [CrossRef] [EDP Sciences] [Google Scholar]
- Mader, S. L., Zealey, W. J., Parker, Q. A., & Masheder, M. R. W. 1999, MNRAS, 310, 331 [NASA ADS] [CrossRef] [Google Scholar]
- Maheswar, G., Manoj, P., & Bhatt, H. C. 2003, A&A, 402, 963 [NASA ADS] [CrossRef] [EDP Sciences] [Google Scholar]
- Manara, C. F., Testi, L., Herczeg, G. J., et al. 2017, A&A, 604, A127 [NASA ADS] [CrossRef] [EDP Sciences] [Google Scholar]
- Manoj, P., Bhatt, H. C., Maheswar, G., & Muneer, S. 2006, ApJ, 653, 657 [NASA ADS] [CrossRef] [Google Scholar]
- Marino, S., Perez, S., & Casassus, S. 2015, ApJ, 798, L44 [NASA ADS] [CrossRef] [Google Scholar]
- Mathieu, R. D. 1994, ARA&A, 32, 465 [NASA ADS] [CrossRef] [Google Scholar]
- Matthews, B. C., Fiege, J. D., & Moriarty-Schieven, G. 2002, ApJ, 569, 304 [NASA ADS] [CrossRef] [Google Scholar]
- McDonald, I., Zijlstra, A. A., & Watson, R. A. 2017, MNRAS, 471, 770 [NASA ADS] [CrossRef] [Google Scholar]
- Meeus, G., Waters, L. B. F. M., Bouwman, J., et al. 2001, A&A, 365, 476 [NASA ADS] [CrossRef] [EDP Sciences] [Google Scholar]
- Megeath, S. T., Gutermuth, R., Muzerolle, J., et al. 2012, AJ, 144, 192 [NASA ADS] [CrossRef] [Google Scholar]
- Ménard, F., Cuello, N., Ginski, C., et al. 2020, A&A, 639, L1 [EDP Sciences] [Google Scholar]
- Meng, H. Y. A., Rieke, G. H., Su, K. Y. L., & Gáspár, A. 2017, ApJ, 836, 34 [CrossRef] [Google Scholar]
- Menu, J., van Boekel, R., Henning, T., et al. 2015, A&A, 581, A107 [NASA ADS] [CrossRef] [EDP Sciences] [Google Scholar]
- Merín, B., Jørgensen, J., Spezzi, L., et al. 2008, ApJS, 177, 551 [Google Scholar]
- Min, M., Dullemond, C. P., Dominik, C., de Koter, A., & Hovenier, J. W. 2009, A&A, 497, 155 [NASA ADS] [CrossRef] [EDP Sciences] [Google Scholar]
- Mitchell, G. F., Johnstone, D., Moriarty-Schieven, G., Fich, M., & Tothill, N. F. H. 2001, ApJ, 556, 215 [NASA ADS] [CrossRef] [Google Scholar]
- Mohanty, S., Greaves, J., Mortlock, D., et al. 2013, ApJ, 773, 168 [NASA ADS] [CrossRef] [Google Scholar]
- Monnier, J. D., Harries, T. J., Bae, J., et al. 2019, ApJ, 872, 122 [Google Scholar]
- Mora, A., Merín, B., Solano, E., et al. 2001, A&A, 378, 116 [NASA ADS] [CrossRef] [EDP Sciences] [Google Scholar]
- Morel, M., & Magnenat, P. 1978, A&AS, 34, 477 [NASA ADS] [Google Scholar]
- Muro-Arena, G. A., Ginski, C., Dominik, C., et al. 2020, A&A, 636, L4 [NASA ADS] [CrossRef] [EDP Sciences] [Google Scholar]
- Muto, T., Grady, C. A., Hashimoto, J., et al. 2012, ApJ, 748, L22 [NASA ADS] [CrossRef] [Google Scholar]
- Muzerolle, J., Allen, L. E., Megeath, S. T., Hernández, J., & Gutermuth, R. A. 2010, ApJ, 708, 1107 [NASA ADS] [CrossRef] [Google Scholar]
- Myers, J. R., Sande, C. B., Miller, A. C., Warren, W. H., J., & Tracewell, D. A. 2015, VizieR Online Data Catalog: V/145 [Google Scholar]
- Nascimbeni, V., Piotto, G., Ortolani, S., et al. 2016, MNRAS, 463, 4210 [Google Scholar]
- Nguyen, D. C., Brandeker, A., van Kerkwijk, M. H., & Jayawardhana, R. 2012, ApJ, 745, 119 [Google Scholar]
- Oelkers, R. J., Rodriguez, J. E., Stassun, K. G., et al. 2018, AJ, 155, 39 [NASA ADS] [CrossRef] [Google Scholar]
- Ohashi, N. 2008, Ap&SS, 313, 101 [NASA ADS] [CrossRef] [Google Scholar]
- Olofsson, J., Benisty, M., Le Bouquin, J. B., et al. 2013, A&A, 552, A4 [NASA ADS] [CrossRef] [EDP Sciences] [Google Scholar]
- Pascucci, I., Apai, D., Luhman, K., et al. 2009, ApJ, 696, 143 [NASA ADS] [CrossRef] [Google Scholar]
- Pascucci, I., Testi, L., Herczeg, G. J., et al. 2016, ApJ, 831, 125 [Google Scholar]
- Pecaut, M. J., & Mamajek, E. E. 2013, ApJS, 208, 9 [Google Scholar]
- Pérez, L. M., Isella, A., Carpenter, J. M., & Chandler, C. J. 2014, ApJ, 783, L13 [NASA ADS] [CrossRef] [Google Scholar]
- Perryman, M. A. C., Lindegren, L., Kovalevsky, J., et al. 1997, A&A, 500, 501 [NASA ADS] [Google Scholar]
- Pillitteri, I., Wolk, S. J., Megeath, S. T., et al. 2013, ApJ, 768, 99 [NASA ADS] [CrossRef] [Google Scholar]
- Pinilla, P., Benisty, M., Birnstiel, T., et al. 2014, A&A, 564, A51 [NASA ADS] [CrossRef] [EDP Sciences] [Google Scholar]
- Pinilla, P., Tazzari, M., Pascucci, I., et al. 2018, ApJ, 859, 32 [Google Scholar]
- Pinzón, G., Seifahrt, A., & de, R. 2006, Rev. Mex. Astron. Astrofís. Conf. Ser., 26, 41 [Google Scholar]
- Pouilly, K., Bouvier, J., Alecian, E., et al. 2020, A&A, 642, A99 [CrossRef] [EDP Sciences] [Google Scholar]
- Prato, L., Greene, T. P., & Simon, M. 2003, ApJ, 584, 853 [NASA ADS] [CrossRef] [Google Scholar]
- Przybilla, N., Nieva, M.-F., & Butler, K. 2008, ApJ, 688, L103 [Google Scholar]
- Przygodda, F., van Boekel, R., Àbrahàm, P., et al. 2003, A&A, 412, L43 [NASA ADS] [CrossRef] [EDP Sciences] [Google Scholar]
- Rebollido, I., Merín, B., Ribas, Á., et al. 2015, A&A, 581, A30 [NASA ADS] [CrossRef] [EDP Sciences] [Google Scholar]
- Rebull, L. M., Padgett, D. L., McCabe, C. E., et al. 2010, ApJS, 186, 259 [Google Scholar]
- Reipurth, B., & Zinnecker, H. 1993, A&A, 278, 81 [NASA ADS] [Google Scholar]
- Reipurth, B., Herbig, G., & Aspin, C. 2010, AJ, 139, 1668 [NASA ADS] [CrossRef] [Google Scholar]
- Reipurth, B., Herbig, G. H., Bally, J., et al. 2018, AJ, 156, 25 [Google Scholar]
- Ribas, Á., Espaillat, C. C., Macías, E., et al. 2017, ApJ, 849, 63 [Google Scholar]
- Rizzuto, A. C., Dupuy, T. J., Ireland, M. J., & Kraus, A. L. 2020, ApJ, 889, 175 [Google Scholar]
- Rodigas, T. J., Follette, K. B., Weinberger, A., Close, L., & Hines, D. C. 2014, ApJ, 791, L37 [NASA ADS] [CrossRef] [Google Scholar]
- Rojas, G., Gregorio-Hetem, J., & Hetem, A. 2008, MNRAS, 387, 1335 [NASA ADS] [CrossRef] [Google Scholar]
- Rubinstein, A. E., Macías, E., Espaillat, C. C., et al. 2018, ApJ, 860, 7 [NASA ADS] [CrossRef] [Google Scholar]
- Sandell, G., Weintraub, D. A., & Hamidouche, M. 2011, ApJ, 727, 26 [Google Scholar]
- Sartori, M. J., Lépine, J. R. D., & Dias, W. S. 2003, A&A, 404, 913 [NASA ADS] [CrossRef] [EDP Sciences] [Google Scholar]
- Schegerer, A. A., Wolf, S., Hummel, C. A., Quanz, S. P., & Richichi, A. 2009, A&A, 502, 367 [NASA ADS] [CrossRef] [EDP Sciences] [Google Scholar]
- Schmidt, T. O. B., Vogt, N., Neuhäuser, R., Bedalov, A., & Roell, T. 2013, A&A, 557, A80 [NASA ADS] [CrossRef] [EDP Sciences] [Google Scholar]
- Segura-Cox, D. M., Schmiedeke, A., Pineda, J. E., et al. 2020, Nature, 586, 228 [Google Scholar]
- Siess, L., Dufour, E., & Forestini, M. 2000, A&A, 358, 593 [Google Scholar]
- Skinner, S. L., Audard, M., & Güdel, M. 2016, ApJ, 826, 84 [NASA ADS] [CrossRef] [Google Scholar]
- Sloan, G. C., Jura, M., Duley, W. W., et al. 2007, ApJ, 664, 1144 [NASA ADS] [CrossRef] [Google Scholar]
- Sofia, U. J., & Meyer, D. M. 2001, ApJ, 554, L221 [NASA ADS] [CrossRef] [Google Scholar]
- Sterzik, M. F., Melo, C. H. F., Tokovinin, A. A., & van der Bliek, N. 2005, A&A, 434, 671 [NASA ADS] [CrossRef] [EDP Sciences] [Google Scholar]
- Stolker, T., Dominik, C., Avenhaus, H., et al. 2016, A&A, 595, A113 [NASA ADS] [CrossRef] [EDP Sciences] [Google Scholar]
- Stolker, T., Sitko, M., Lazareff, B., et al. 2017, ApJ, 849, 143 [NASA ADS] [CrossRef] [Google Scholar]
- Takami, M., Karr, J. L., Hashimoto, J., et al. 2013, ApJ, 772, 145 [Google Scholar]
- Tanii, R., Itoh, Y., Kudo, T., et al. 2012, PASJ, 64, 124 [NASA ADS] [Google Scholar]
- The, P. S., de Winter, D., & Perez, M. R. 1994, A&AS, 104, 315 [NASA ADS] [Google Scholar]
- Tisserand, P., Clayton, G. C., Welch, D. L., et al. 2013, A&A, 551, A77 [NASA ADS] [CrossRef] [EDP Sciences] [Google Scholar]
- Uyama, T., Hashimoto, J., Kuzuhara, M., et al. 2017, AJ, 153, 106 [Google Scholar]
- Uyama, T., Hashimoto, J., Muto, T., et al. 2018, AJ, 156, 63 [NASA ADS] [CrossRef] [Google Scholar]
- van Boekel, R., Waters, L. B. F. M., Dominik, C., et al. 2003, A&A, 400, L21 [NASA ADS] [CrossRef] [EDP Sciences] [Google Scholar]
- van Boekel, R., Min, M., Waters, L. B. F. M., et al. 2005, A&A, 437, 189 [NASA ADS] [CrossRef] [EDP Sciences] [Google Scholar]
- van der Marel, N., van Dishoeck, E. F., Bruderer, S., et al. 2013, Science, 340, 1199 [Google Scholar]
- van der Marel, N., Cazzoletti, P., Pinilla, P., & Garufi, A. 2016, ApJ, 832, 178 [Google Scholar]
- van der Marel, N., Dong, R., di Francesco, J., Williams, J. P., & Tobin, J. 2019, ApJ, 872, 112 [Google Scholar]
- Varga, J., Ábrahám, P., Chen, L., et al. 2018, A&A, 617, A83 [NASA ADS] [CrossRef] [EDP Sciences] [Google Scholar]
- Vieira, S. L. A., Corradi, W. J. B., Alencar, S. H. P., et al. 2003, AJ, 126, 2971 [Google Scholar]
- Villebrun, F., Alecian, E., Hussain, G., et al. 2019, A&A, 622, A72 [NASA ADS] [CrossRef] [EDP Sciences] [Google Scholar]
- Vioque, M., Oudmaijer, R. D., Baines, D., Mendigutía, I., & Pérez-Martínez, R. 2018, A&A, 620, A128 [NASA ADS] [CrossRef] [EDP Sciences] [Google Scholar]
- Voirin, J., Manara, C. F., & Prusti, T. 2018, A&A, 610, A64 [NASA ADS] [CrossRef] [EDP Sciences] [Google Scholar]
- Wahhaj, Z., Cieza, L., Koerner, D. W., et al. 2010, ApJ, 724, 835 [Google Scholar]
- Walker, M. F. 1969, ApJ, 155, 447 [NASA ADS] [CrossRef] [Google Scholar]
- Watson, D. M., Leisenring, J. M., Furlan, E., et al. 2009, ApJS, 180, 84 [Google Scholar]
- Weaver, W. B., & Jones, G. 1992, ApJS, 78, 239 [NASA ADS] [CrossRef] [Google Scholar]
- Weintraub, D. A. 1990, ApJS, 74, 575 [NASA ADS] [CrossRef] [Google Scholar]
- Woitke, P., Min, M., Pinte, C., et al. 2016, A&A, 586, A103 [NASA ADS] [CrossRef] [EDP Sciences] [Google Scholar]
- Woitke, P., Kamp, I., Antonellini, S., et al. 2019, PASP, 131, 064301 [Google Scholar]
- Yan, Q.-Z., Zhang, B., Xu, Y., et al. 2019, A&A, 624, A6 [NASA ADS] [CrossRef] [EDP Sciences] [Google Scholar]
- Yasui, C., Hamano, S., Fukue, K., et al. 2019, ApJ, 886, 115 [Google Scholar]
- Yuldoshev, Q. X., Ehgamberdiev, S. A., Muminov, M. M., et al. 2017, Kinemat. Phys. Celest. Bodies, 33, 250 [Google Scholar]
- Zacharias, N., Monet, D. G., Levine, S. E., et al. 2005, VizieR Online Data Catalog: I/297 [Google Scholar]
- Zacharias, N., Finch, C. T., Girard, T. M., et al. 2012, VizieR Online Data Catalog: fI/322A [Google Scholar]
- Zapata, L. A., Rodríguez, L. F., Fernández-López, M., et al. 2020, ApJ, 896, 132 [Google Scholar]
- Zhang, S., Zhu, Z., Huang, J., et al. 2018, ApJ, 869, L47 [NASA ADS] [CrossRef] [Google Scholar]
- Zucker, C., Speagle, J. S., Schlafly, E. F., et al. 2020, A&A, 633, A51 [CrossRef] [EDP Sciences] [Google Scholar]
We found that for HD 34700 the iteration finished with a negative extinction. It was kept in the sample by adjusting the spectral type by a half subclass (i.e., we reran the fit using a spectral type of F9 from Pecaut & Mamajek 2013).
See technical note Gaia-C3-TN-LU-LL-124-01 in the Gaia DR2 release documentation.
All Tables
Classification as T Tau star or HAeBe star to confirm the PMS nature of the star and list weather or not this star has previously been referred to as an intermediate-mass PMS star.
Index of PAH detections in the Spitzer spectra. The “x” indicates where a detectable feature is identified.
Stellar parameters following the evolutionary track of a 2 M⊙ PMS star (Siess et al. 2000).
All Figures
|
Fig. 1 HR diagram showing the IMTT stars sample (blue) and the HAeBe sample from Vioque et al. (2018) (red) that lies within the same mass range as the IMTT stars. The pre-main-sequence evolutionary tracks (gray-solid) are from Siess et al. (2000). The isochrones shown are for 1 Myr (dotted), 2 Myr (dash-dotted), 3 Myr (red-solid), and 7 Myr (black-solid). The ZAMS (thick-dashed) is defined by the location when the nuclear luminosity provides 99% of the total stellar luminosity. |
| In the text | |
|
Fig. 2 Comparison between the sample of IMTT stars in this paper with the HAeBe star sample from Vioque et al. (2018). Only stars up to 5 M⊙ are shown for the HAeBe stars in these panels. Upper panel: age-mass relation among the IMTT star sample in comparison with the Herbig star sample. The IMTT star sample is on average younger than the HAeBe stars with each mass bin. Lower panel: mass distribution in the IMTT star sample compared to the mass distribution among the HAeBe stars. |
| In the text | |
|
Fig. 3 Crosses: HAeBe sample from Acke et al. (2009) and solid circles: IMTT stars in our sample. Black indicates a Group I source and red a Group II source. The average uncertainty in the measurement is displayed in the top right corner of the panel. Left panel: relationship between the spectral slope from 13–30 μm and the 7 μm excess. Compared to the HAeBe stars, there is a lack of IMTT stars with a 7 μm excess above 4 magnitudes. Right panel: color comparison with the Herbig stars reveal that the distribution is similar to the HAeBe population. The location of V2149 Ori is marked. |
| In the text | |
|
Fig. 4 Degree of processing for the silicate grains in the disks around the IMTT star sample (open circles) and for the HAeBe sample from Juhász et al. (2010) (crosses). Group I disks are black and Group II disks are red. Smaller grains lead to a high peak-over-continuum intensity and a low [F11.3 ∕F9.8] ratio. As grains grow, the [F11.3∕F9.8] ratio increases and the peak-over-continuum intensity weakens. |
| In the text | |
|
Fig. 5 Continuum-divided normalized peak strength over the 10 μm feature for those sources classified as Group I. The continuum between 7.5 and 13.5 μm has been normalized to 1. Leftmost panel: spectra of sources were no detection of a silicate feature is found: (a) Haro 1-6, (b) EM*SR 21, (c) V815 Ori, (d) UX Tau, and (e) HBC 502. From the second from left panel: disks with detected silicate features are shown in ascending order of peak strength: (f) HBC 338, (g) LkHα 330, (h) V395 Cep, (i) HD 142527, (j) GW Ori, (k) DI Cep, (l) BX Ari, (m) EZ Ori, (n) AK Sco, (o) LkHα 310, and (p) V1044 Ori. The scale is indicated in the leftmost panel and is the same for all sources. Spectra are shifted to allow comparison. |
| In the text | |
|
Fig. 6 Continuum-divided normalized peak strength over the 10 μm feature for those sources classified as Group II. The continuum between 7.5 and 13.5 μm has been normalized to 1. Only (a) V2149 Ori does not have a detectable silicate feature. The other sources then follow in ascendingorder of peak strength: (b) HD 294260, (c) CO Ori, (d) PR Ori, (e) HD 35929, (f) DI Cha, (g) BE Ori, (h) HT Lup, (i) HD 142666, (j) GX Ori, (k) HBC 442 (l) V1650 Ori, (m) CR Cha, (n) CV Cha, (o) RY Ori, (p) RY Tau, and (q) HD 144432.The scale is indicated in the leftmost panel and is the same for all sources. Spectra are shifted to allow comparison. |
| In the text | |
|
Fig. 7 Upper panel: 10 μm peak-over-continuum distribution among the HAeBe stars (Juhász et al. 2010) in comparison with the IMTT star sample. Middle panel: 10 μm peak-over-continuum distribution among T Tauri stars (Furlan et al. 2011) in comparison with the intermediate-mass star samples (IMTTs+HAeBe). Because of the large difference in sample size, the distributions have been normalized so that their peak value equals 1. Lower panel: distribution in the F11.3 /F9.8 ratio clearlyshowing the separation between the large grain group and the smaller grain group among the IMTT stars, as well as the fact that Group 1 disks more commonly have smaller grains. |
| In the text | |
|
Fig. 8 SED with fit Kurucz model. The Kurucz model is in blue, literature photometry is in black (see references in Table 4), and Spitzer spectra are in red. |
| In the text | |
|
Fig. B.1 SEDs of a 2 M⊙ PMS star surrounded by a passively heated gas/dust disk. We used a range of luminosities and temperatures (see Table B.1) representative of the evolution along a Siess et al. (2000) evolutionary track. The vertical flux scale is normalized to its maximum value for each model. Disk parameters are listed in Table B.2. The dashed line indicates the 7 μm excess point. Lower right panel: effect of increasing the disk scale height at 0.4 AU from 0.041 to 0.08 AU for the Teff = 9080 K model. |
| In the text | |
Current usage metrics show cumulative count of Article Views (full-text article views including HTML views, PDF and ePub downloads, according to the available data) and Abstracts Views on Vision4Press platform.
Data correspond to usage on the plateform after 2015. The current usage metrics is available 48-96 hours after online publication and is updated daily on week days.
Initial download of the metrics may take a while.