Fig. 7
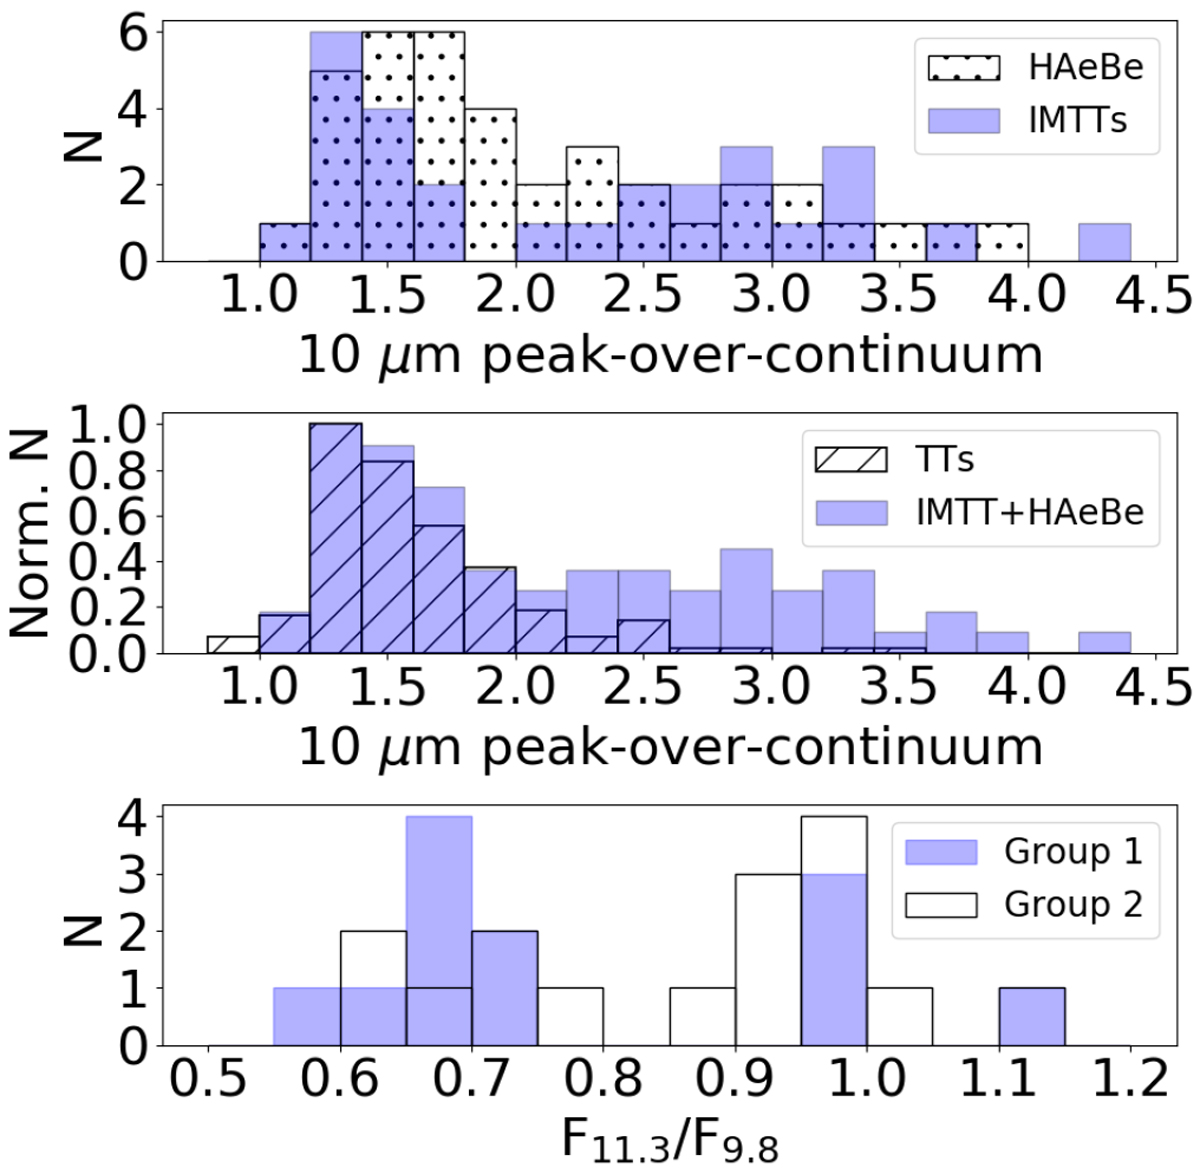
Upper panel: 10 μm peak-over-continuum distribution among the HAeBe stars (Juhász et al. 2010) in comparison with the IMTT star sample. Middle panel: 10 μm peak-over-continuum distribution among T Tauri stars (Furlan et al. 2011) in comparison with the intermediate-mass star samples (IMTTs+HAeBe). Because of the large difference in sample size, the distributions have been normalized so that their peak value equals 1. Lower panel: distribution in the F11.3 /F9.8 ratio clearlyshowing the separation between the large grain group and the smaller grain group among the IMTT stars, as well as the fact that Group 1 disks more commonly have smaller grains.
Current usage metrics show cumulative count of Article Views (full-text article views including HTML views, PDF and ePub downloads, according to the available data) and Abstracts Views on Vision4Press platform.
Data correspond to usage on the plateform after 2015. The current usage metrics is available 48-96 hours after online publication and is updated daily on week days.
Initial download of the metrics may take a while.