Fig. 3
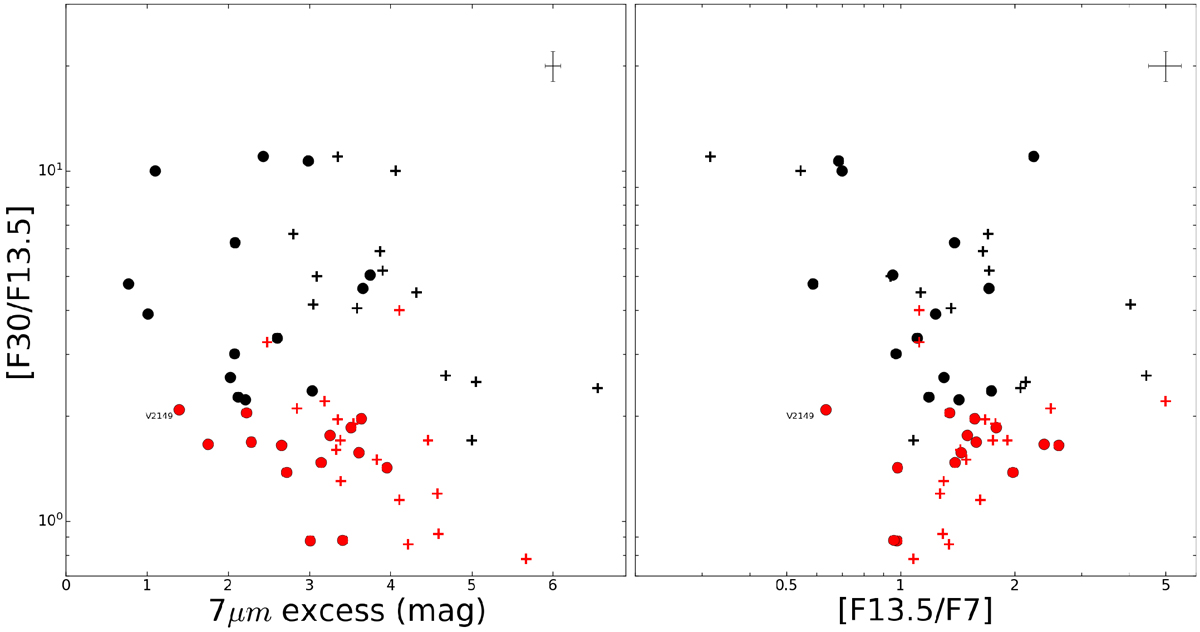
Crosses: HAeBe sample from Acke et al. (2009) and solid circles: IMTT stars in our sample. Black indicates a Group I source and red a Group II source. The average uncertainty in the measurement is displayed in the top right corner of the panel. Left panel: relationship between the spectral slope from 13–30 μm and the 7 μm excess. Compared to the HAeBe stars, there is a lack of IMTT stars with a 7 μm excess above 4 magnitudes. Right panel: color comparison with the Herbig stars reveal that the distribution is similar to the HAeBe population. The location of V2149 Ori is marked.
Current usage metrics show cumulative count of Article Views (full-text article views including HTML views, PDF and ePub downloads, according to the available data) and Abstracts Views on Vision4Press platform.
Data correspond to usage on the plateform after 2015. The current usage metrics is available 48-96 hours after online publication and is updated daily on week days.
Initial download of the metrics may take a while.