| Issue |
A&A
Volume 649, May 2021
|
|
|---|---|---|
| Article Number | A21 | |
| Number of page(s) | 17 | |
| Section | Interstellar and circumstellar matter | |
| DOI | https://doi.org/10.1051/0004-6361/201731208 | |
| Published online | 03 May 2021 | |
ATLASGAL-selected massive clumps in the inner Galaxy
IX. Deuteration of ammonia★
1
Max-Planck-Institut für Radioastronomie,
Auf dem Hügel 69,
53121
Bonn,
Germany
e-mail: mwienen@mpifr-bonn.mpg.de
2
Osservatorio Astrofisico di Arcetri,
Largo E. Fermi, 5,
50125
Firenze, Italy
3
Dublin Institute of Advanced Studies,
Fitzwilliam Place 31,
Dublin 2, Ireland
4
Institute for Astrophysical Research, Boston University,
725 Commonwealth Avenue,
02215
Boston MA, USA
5
INAF - Istituto di Radioastronomia,
Via Gobetti 101,
40129
Bologna, Italy
Received:
20
May
2017
Accepted:
5
January
2021
Context. Deuteration has been used as a tracer of the evolutionary phases of low- and high-mass star formation. The APEX Telescope Large Area Survey (ATLASGAL) provides an important repository for a detailed statistical study of massive star-forming clumps in the inner Galactic disc at different evolutionary phases.
Aims. We study the amount of deuteration using NH2D in a representative sample of high-mass clumps discovered by the ATLASGAL survey covering various evolutionary phases of massive star formation. The deuterium fraction of NH3 is derived from the NH2D 111−101 ortho transition at ~86 GHz and NH2D 111−101 para line at ~110 GHz. This is refined for the first time by measuring the NH2D excitation temperature directly with the NH2D 212–202 para transition at ~74 GHz. Any variation of NH3 deuteration and ortho-to-para ratio with the evolutionary sequence is analysed.
Methods. Unbiased spectral line surveys at 3 mm were conducted towards ATLASGAL clumps between 85 and 93 GHz with the Mopra telescope and from 84 to 115 GHz using the IRAM 30m telescope. A subsample was followed up in the NH2D transition at 74 GHz with the IRAM 30m telescope. We determined the deuterium fractionation from the column density ratio of NH2D and NH3 and measured the NH2D excitation temperature for the first time from the simultaneous modelling of the 74 and 110 GHz line using MCWeeds. We searched for trends in NH3 deuteration with the evolutionary sequence of massive star formation. We derived the column density ratio from the 86 and 110 GHz transitions as an estimate of the NH2D ortho-to-para ratio.
Results. We find a large range of the NH2D to NH3 column density ratio up to 1.6 ± 0.7 indicating a high degree of NH3 deuteration in a subsample of the clumps. Our analysis yields a clear difference between NH3 and NH2D rotational temperatures for a fraction. We therefore advocate observation of the NH2D transitions at 74 and 110 GHz simultaneously to determine the NH2D temperature directly. We determine a median ortho-to-para column density ratio of 3.7 ± 1.2.
Conclusions. The high detection rate of NH2D confirms a high deuteration previously found in massive star-forming clumps. Using the excitation temperature of NH2D instead of NH3 is needed to avoid an overestimation of deuteration. We measure a higher detection rate of NH2D in sources at early evolutionary stages. The deuterium fractionation shows no correlation with evolutionary tracers such as the NH3 (1,1) line width, or rotational temperature.
Key words: surveys / submillimeter: ISM / radio lines: ISM / ISM: molecules / stars: massive / stars: formation
Full Tables 2–6, and 9 are only available at the CDS via anonymous ftp to cdsarc.u-strasbg.fr (130.79.128.5) or via http://cdsarc.u-strasbg.fr/viz-bin/cat/J/A+A/649/A21
© M. Wienen et al. 2021
 Open Access article, published by EDP Sciences, under the terms of the Creative Commons Attribution License (https://creativecommons.org/licenses/by/4.0), which permits unrestricted use, distribution, and reproduction in any medium, provided the original work is properly cited.
Open Access funding provided by Max Planck Society.
1 Introduction
High-mass stars are known to form in dense clusters. They are much rarer than low-mass stars according to the stellar initial mass function (Kroupa et al. 2013) and are therefore located at greater distances. Massive protostars evolve embedded in dense cores (~ 105 − 108 cm−3, Garay & Lizano 1999; Kurtz et al. 2000) within high-mass star-forming complexes. These are more crowded than low-mass star-forming regions and have a short evolutionary timescale of ~ 105 yr (McKee & Tan 2002). These constraints restrict observations of the early phases of high-mass star formation. However, a key issue preventing a more complete understanding of the formation process of massive stars is the difficulty in revealing their initial conditions.
The abundance of deuterium bound in molecules is orders of magnitude higher in cold molecular clouds than the primordial D/H ratio (~ 10−5, Oliveira et al. 2003). Rising deuteration is expected from chemical models even into the gravitational collapse phase of the molecular cloud core (Caselli 2002; Körtgen et al. 2017). Deuterated molecules can form through reactions between gaseous species as well as through the depletion of those onto grains with subsequent deuteration on the surfaces followed by the evaporation of icy grain mantles by the radiation from protostars back into the gas. At low temperatures (<20 K) and for low ortho-to-para H2 ratios, deuterium fractionation is primarily regulated by reactive collisions
 (1)
(1)
The production of H2D+ is essential for the deuterium chemistry, representing the first stage of deuterium enrichment (“deuteration”, Roberts & Millar 2000b; Wu & Yang 2005; Pillai et al. 2007). Gas-grain models comparing deuteration of H at gas and dust temperatures of 10 and 20 K by Sipilä et al. (2015a) lead to a decrease in deuteration at the higher temperature, at which the reaction given in Eq. (1) proceeds more efficiently in the backward direction. This trend is favoured by a high ortho-to-para H2 ratio as well. Moreover, neutral molecules such as CO and H2 destroy H2D+ at temperatures above 25 K and thus reduce the deuterium fraction (Roberts & Millar 2000b). According to the gas-grain models from Sipilä et al. (2015a), a total depletion of ammonia from the gas phase also occurs after ~ 106 yr at a density of 106 cm−3 and a temperature of 20 K. In addition to ammonia, various forms of deuterated ammonia are also depleted onto grain surfaces with deuterium being trapped onto the surfaces (Sipilä et al. 2015b). This leads to HD depletion and the decrease of the overall gas-phase deuteration efficiency (Sipilä et al. 2015a).
It is known from observations and theory that C-bearing molecules such as CO freeze out onto dust grains in the cold and dense environment of molecular cores (Caselli et al. 1999; Kramer et al. 1999; Tafalla et al. 2002; Flower et al. 2005; Bergin & Tafalla 2007; Giannetti et al. 2014) and therefore increase the [H2D+]/[H ] ratio, which results in an enhanced abundance of deuterated species in the very early evolutionary phase. Csengeri et al. (2014) estimated that 25% of the embedded sources in the ATLASGAL (Schuller et al. 2009) sample with a peak intensity > 5 Jy are in the coldest stage of high-mass star formation. Such dense and cold clumps are therefore ideal targets to investigate their deuteration.
The amount of deuteration depends on the H2 ortho-to-para ratio as well. If ortho instead of para H2 is present, the backward reaction destroying H2D+ will be faster because of the four-times-larger ortho than para H2 rate coefficients (Pagani et al. 1992). In addition, if the abundance of ortho H2 is high, it will efficiently destroy H2D+ at low temperatures. A lower H2 ortho-to-para ratio, as found in cold cores (Pagani et al. 1992), consequently leads to a higher deuterium enrichment.
NH2D has been detected in low- and high-mass star-forming regions: it was observed in cold dark clouds by Saito et al. (2000), in low-mass protostellar cores by Shah & Wootten (2001), and in low-mass protostars by Hatchell (2003). These authors measured NH3 deuteration factors between 0.001 and 0.3 withsimilar errors of ~25% on average, while interferometric observations with high angular resolution of NH2D and NH3 by Crapsi et al. (2007) found an enhanced deuterium fractionation of 0.5 ± 0.2 at high densities of 106 cm−3 in the centre of a nearby Taurus core. In massive star-forming regions, NH2D was observed for example in pre- and protocluster clumps by Pillai et al. (2007) with half of the sample exhibiting a high deuterium fraction of ≥ 13%.
Analysis of the N2 D+/N2H+ ratio in low-mass starless cores and protostars shows the predicted relation of a decreasing deuterium fractionation from the youngest objects immediately after the beginning of collapse to the more advanced evolutionary state of a Class 0 protostar (Crapsi et al. 2005; Emprechtinger et al. 2009). It is suggested that the NH3 deuteration increases in low-mass cores up to 20 K and is constant at higher temperatures (Shah & Wootten 2001). However, these authors only observed a small sample with large errors in the deuteration factors. Moreover, an enhanced N2 D+/N2H+ ratio was also measured at the earliest evolutionary stages of high-mass star formation and a decline from high-mass starless core candidates to high-mass protostellar objects and ultracompact (UC) HII regions was found by Fontani et al. (2011). Busquet et al. (2010) were able to use the [NH2D]/[NH3] ratio as an evolutionary indicator in the environment of an ultracompact HII region (UCHIIR). Fontani et al. (2015) compared NH3 deuteration in high-mass cores with the evolutionary sequence and found that the [NH2D]/[NH3] ratio determined in massive starless cores, high-mass protostellar objects, and ultracompact HII regions does not decrease with the evolution of the cores. Two high-resolution studies (Busquet et al. 2010; Pillai et al. 2011) report that very close to high-mass protostars and UCHII regions (few 1000 AU), there is evidence of removal of deuterated NH3. On large scales Fontani et al. (2015) determined a deuterated fraction of NH3 above 0.1 right up to the most evolved phase of their single-dish sample. This indicates no evidence of gas-phase removal on the envelope scales (several 10 000 AU) up to the most advanced evolutionary stage. Existing single-dish and high-resolution data therefore suggest that deuteration is becoming inefficient (very little additional deuteration taking place) on large scales and appears to be more or less fully removed in the immediate vicinity of protostars and HII regions.
Previous studies of deuterated ammonia in high-mass star formation have only focused on small samples or one evolutionary stage. In the present paper, we determine the NH3 deuteration of a representative sample of massive clumps that are detected by the ATLASGAL survey and observed in NH2D as part of an unbiased spectral line survey. Our analysis focuses on the influence of temperature on deuteration. In particular, this sample covers various phases of high-mass star formation and allows us to analyse any dependence of the deuterium fractionation on evolutionary stage.
We present the NH2D observationsof the ~86 and ~110 GHz lines of ATLASGAL sources and the data reduction in Sect. 2. We derive the NH2D column density, excitation, and NH3 deuteration in Sect. 3. In addition, we measure the column density ratio of NH2D at ~ 86 and ~ 110 GHz as an estimate of the ortho-to-para ratio. We compare the NH3 and NH2D temperatures and analyse any trend of NH3 deuteration with evolutionary tracers in Sect. 4. Moreover, we study the dependence of the ortho-to-para ratio on the NH3 deuteration, line width, and rotational temperature. Our NH2D analysis is summarised in Sect. 5.
2 Observations
The NH2D data were observed within two unbiased spectral-line follow-up observations of large ATLASGAL subsamples. The first project covered 8 GHz centred on 89 GHz in the fourth quadrant with the Mopra telescope (Urquhart et al. 2019) located near Coonabarabran in Australia at a latitude and longitude of −31.2678° and 149.0997°. The second survey covered the whole 3 mm band in the first quadrant using the EMIR receiver at the IRAM 30m telescope1 (Csengeri et al. 2016). We summarise the NH2D and NH3 transitions, that are used in this article, with their spectroscopic properties in Table 1.
2.1 Mopra observations
The Mopra 22m telescope was used to observe a 3mm molecular-line survey towards an unbiased ATLASGAL subsample of clumps with infrared association and peak fluxes above 1.75 Jy per beam at 870 μm as well as cold sources with peak fluxes above 1.2 Jy per beam (Urquhart et al. 2019). We observed 567 ATLASGAL sources located between l = 300° and 359° and |b|≤ 1.5° in 2008 and 2009.
This article focuses only on observations of the NH2D 111 –101 ortho transition at 85.926 GHz in the fourth quadrant. We used a 3mm HEMT receiver as frontend. Our measurements in the 3 mm band range from a frequency of ~85.2 GHz to ~93.4 GHz and were centered on 89.3 GHz. The UNSW Mopra spectrometer (MOPS) from the University of New South Wales contains four slightly overlapping 2.2 GHz bands leading to an overall ~ 8 GHz continuous bandwidth. We used MOPS in a broadband mode, where each 2.2 GHz wide band has a velocity resolution of 0.9 km s−1. The Mopra telescope has a beamwidth (FWHM) of 38′′ at the frequency of the NH2D line at ~86 GHz.
Pointed observations were conducted in position-switching mode. We examined the region around each source using ATLASGAL and infrared continuum maps from the Midcourse Space Experiment (MSX, Price et al. 2001) and chose an offset position that is free of continuum emission at 20 μm, either ± 5′ in longitude or latitude. We observed two polarisations of the NH2D line at 86 GHz simultaneously. The total integration time for each source was ~ 15 min, resulting in an rms noise level of 24 mK on average at a velocity resolution of 0.9 km s−1. The median system temperature was about 200 K. Pointing was measured each hour with line pointings on SiO masers and a reference spectrum of G327 and M17 was obtained each day.
We processed the data initially with the ASAP package, which consisted of processing of the on-off observing mode, the time and polarisation averaging, and baseline subtraction. We converted the data to the  temperature scale and exported the data to the CLASS software from the GILDAS package2 for subsequent analysis. For the calibration from
  to TMB we corrected for the beam efficiency of 0.49 (Ladd et al. 2005).
Properties of the NH2D and NH3 transitions.
2.2 IRAM 30m observations
The NH2D 111 − 101 ortho line at 85.926 GHz and the para transition at 110.154 GHz in the first quadrant were measured as part of the large molecular line survey of ATLASGAL sources conducted with the IRAM 30m telescope in 2011 and 2012 (Csengeri et al. 2016). The sample covers a range of evolutionary phases from the quiescent clumps to actively star-forming clumps hosting HII regions. The IRAM sample targeted bright sources, but also includes infrared-quiet clumps meaning without a detection at 22 μm corresponding to roughly half of the targeted sources (see more details in Csengeri et al. 2016). While the Mopra sample consists of clumps with and without infrared association based on MSX data at 21 micron, the IRAM sample used the WISE 22 micron point-source catalogue with higher resolution. In a pilot study, 36 sources with the highest submillimetre (submm) peak flux densities from the ATLASGAL survey were observed in April 2011 and a second large sample was followed up in February, March, and October 2012. Using the IRAM 30m telescope we observed 425 ATLASGAL sources in NH2D within l = 5°–60° and |b|≤ 1.5°.
The observations were carried out with the EMIR receiver E090. The frequency range from ~ 84 to 115 GHz was divided into 4 GHz blocks for the pilot study, while the sample in 2012 was observed with a total bandwidth of 16 GHz and in two setups centred on 88 and 96 GHz. The Fast Fourier Transform Spectrometer (FFTS) was used with a spectral resolution of 200 kHz resulting in a velocity resolution of 0.68 km s−1 at ~ 86 GHz and of 0.53 km s−1 at ~ 110 GHz. The half-power beam width at the NH2D 1 line frequencies at ~86 GHz and ~110 GHz is 29′′ and 22′′. The spectra were converted to the main beam brightness temperature scale for the beam efficiency of 0.81 at ~ 86 and 110 GHz as in Csengeri et al. (2016).
The observations were conducted in position switching mode with a constant offset of 10′ in right ascension and declination with a total integration time of ~4.5 min for each source. Pointing and focus were measured regularly. G34.26+0.15 was mostly used as a spectral line calibrator.
The NH2D 212 − 202 para transition at 74.156 GHz was observed toward a subsample of the 24 brightest clumps in deuterated ammonia that was selected from the NH2D observations at ~ 86 GHz covering different evolutionary phases such as 24μm dark sources, active clumps in IRDCs, and HII regions. The EMIR receiver with a frequency range between 71 and 79 GHz was used for position-switching observations toward the peaks of the clumps. Typical system temperatures were about 180 K. We measure an rms noise level of 15 mK at a velocity resolution of 0.75 km s−1, which is similar to the observations at ~86 GHz. A total integration time of ~60 min was spent per source including on and off position.
2.3 Data reduction
The CLASS software was used to reduce the NH2D data. To remove the baseline from the spectra we subtracted a polynomial baseline of order zero from the spectra, excluding velocity windows that were placed around the NH2D lines. The hyperfine structure of the NH2D transitions at 86 and 110 GHz was fitted taking six hyperfine components into account. The fit of the line at 110 GHz kept the line width as a fixed parameter using the NH2D line width at 86 GHz assuming that the two transitions originate from the same gas. This gives the optical depth of the main line, τ, the radial velocity, vLSR, and the line width, Δv, at the full width at half maximum of a Gaussian profile with their errors as the formal fit errors from CLASS. As the line width of the transition at110 GHz is set to a fixed value, no error is indicated for this parameter in Table 3. The temperature of the NH2D line was measured from the peak of the hyperfine structure fit. The minimum optical depth of the hyperfine structure fit in CLASS is 0.1. Because the hyperfine structure of some NH2D lines at 86 GHz and of most transitions at 110 GHz are too weak to be detected, we cannot determine their optical depth. In these cases, the fit from the CLASS software gives an error of the optical depth of greater than 50%. The 86 GHz-NH2D line parameters with the NH3 rotational temperature between the (1,1) and (2,2) inversion transition from Wienen et al. (2012, 2018) are given inTable 2. We report the molecular line parameters of the para NH2D transition in Table 3 which lists the line-of-sight velocity of para NH2D,  , the line width, Δv110, and the main beam brightness temperature,
  .
.
Parameters of the NH2D line at 86 GHz and NH3 rotational temperature (Wienen et al. 2018).
Line parameters of the NH2D transition at 110 GHz with errors noted in parentheses.
3 Results and analysis of the NH2D sample
3.1 NH2D detection rates
We observed 992 ATLASGAL clumps in NH2D 111 –101 at 86 GHz in the first and fourth quadrant and detected NH2D in 390 clumps (39%) corresponding to an S∕N > 3. We found that the NH2D velocities of all detected sources are within ~ 2.5 km s−1 of the NH3 velocities.
The hyperfine structure of the NH2D line at 86 GHz is clearly visible in 79 clumps in the first and fourth quadrants (20%). We can determine the optical depth of these sources, which ranges between 0.34 ± 0.02 for G15.22−0.43 and 4.2 ± 2.0 for G35.58+0.01 with a median optical depth of the NH2D line at 86 GHz of 1.12 ± 0.35. A few spectra of the NH2D transition at86 GHz of these sources and of the clumps, for which the hyperfine structure is too weak to obtain an optical depth, are shown in Fig. 1.
The NH2D 111 –101 line at 110 GHz was observed in 373 ATLASGAL sources in the first quadrant of which 65 clumps are detected (17%) with S/N > 3 and the NH2D and NH3 velocities of all detections are within ~ 2.5 km s−1. The hyperfine structure components of most clumps are blended and we detect those in only seven sources (2%) with an optical depth between 0.12 ± 0.02 for G27.37−0.17 and 3.1 ± 1.3 for G23.44−0.18. The median optical depth of these clumps that show hyperfine structure is 1.1 ± 0.8. Examples of the NH2D transition at 110 GHz are presented in Fig. 2.
We measured the NH2D transition at 74 GHz in 24 ATLASGAL sources in the first quadrant and 5 sources have S∕N > 3. These detections possess NH2D and NH3 velocities that again lie close together, within ~ 2.5 km s−1. The results of the modelling of five detections are plotted in Fig. 4.
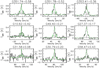 |
Fig. 1 Examples of reduced and calibrated spectra of observed NH2D transitions at 86 GHz; the fit is shown in green. The hyperfine structure of the spectra in the first and second rows are clearly detected, while that of the spectra in the third row is too weak to be visible. Frequencies of the hyperfine structure components are indicated by straight lines. |
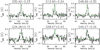 |
Fig. 2 Examples of reduced and calibrated spectra of observed NH2D lines at 110 GHz; the fit is indicated in green. Frequencies of the hyperfine structure components are labelled. |
3.2 NH2D line width
We derive the NH2D intrinsic line width from hyperfine structure fits to the transition at 86 GHz, and find values between 1.1 and 7.7 km s−1. Fitting of NH2D lines with a small S/N and an error in the optical depth of greater than 50% gives optical depths varying between 0.1 and 2.5, which causes the line width to vary by ~41%, leading to a systematic error of the same order as the median error in the line width. In those cases and for an even larger error in the optical depth the fit would result in a large uncertainty on the line width. For sources with a smaller error in the optical depth, that is < 50%, the line width derived from the fit is reliable. We searched for a counterpart to the NH2D observations within the NH3 sample of ATLASGAL sources measured in the fourth quadrant (Wienen et al. 2018) using the Parkes telescope. This resulted in an ATLASGAL subsample of 264 clumps detected in NH2D and NH3 within a FWHM beamwidth of the Parkes telescope of 60′′, slightly larger than the FWHM beamwidth of the IRAM telescope of 29′′ at ~ 86 GHz. The NH2D line widths are compared with the NH3 (1,1) line widths obtained from hyperfine structure fits in Fig. 3, where the sources with an error in the optical depth smaller than 50% are shown as red triangles and the clumps with an error in the optical depth larger than 50% as black points. The straight line indicates equal line widths. The whole sample is distributed equally around the straight line and this hints at a correlation between the NH2D and NH3 line width within the noise. Figure 3 suggests that the NH2D line at 86 GHz and NH3 (1,1) line therefore trace similar regions within a source. Although the critical density of the NH2D transition at 86 GHz is about a factor 50 higher than that of the NH3 lines (see Table 1), studies of high-mass star-forming regions also reveal an approximate spatial correlation between the emission from the two molecules (Busquet et al. 2010; Pillai et al. 2011). The median NH2D line width of ~2 km s−1 agrees with the average NH3 (1,1) line width measured for the whole ATLASGAL sample in Wienen et al. (2012). The red contour lines of the sources with an error in the optical depth of less than 50% indicate slightly smaller NH2D than NH3 line width.
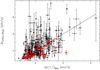 |
Fig. 3 Line width of the NH2D transition at 86 GHz plotted against the NH3 (1,1) line width. ATLASGAL sources that have an error in the NH2D optical depth of less than or greater than 50% are indicated as red triangles or black points, respectively. The straight line corresponds to equal line widths. |
3.3 NH2D column density
The total column density of ortho and para NH2D is derived assuming that the energy levels are in LTE, that is, that they are populated according to a Boltzmann distribution.Non-LTE conditions are pointed out in Sect. 3.4. To calculate the column density we distinguish between subsamples with and without detected hyperfine structure. For clumps without detected hyperfine structure we mark the optical depth given in Table 2 with a star, while we give the optical depth of sources with detected hyperfine structure without a star. For the frequency of the NH2D line at ~86 GHz we use the Rayleigh-Jeans approximation for a mean kinetic temperature of our sample at 20 K. We calculate the source-averaged column density of sources, for which the hyperfine structure components are detected and their ratio provides a measurement of the optical depth. For these clumps, the optical depth is well determined and the column density is derived from the lower energy level by
 (2)
(2)
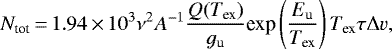
with the statistical weight of the upper and lower levels, gu and gl, respectively, the Einstein A coefficient in s−1, the frequency of the NH2D transition at 86 GHz, ν, in GHz, the excitation temperature, Tex, in K, the optical depth of the NH2D transition, τ, and the NH2D FWHM line width, Δv, in km s−1. We use the NH3 kinetic temperature given in Wienen et al. (2012, 2018) as excitation temperature assuming that NH2D and NH3 are co-spatial, as indicated in Fig. 3, and therefore have similar gas temperatures. For sources with detected hyperfine structure we calculate the total NH2D column density in cm−2 from the optical depth and kinetic temperature, which depend on line ratios, and we therefore compute a source-averaged quantity by
 (3)
(3)
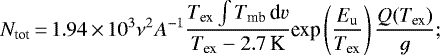
where Q is the partition function and Eu the upper energy level in K (see Table 1). Clumps without detected hyperfine structure and insufficient S/N to reliably determine an optical depth have optical depths with an error of greater than 50% in Table 2. We use the integrated intensity of the NH2D line at 86 GHz, ∫ Tmb dv, in K km s−1, that is a measure derived over the whole beam, to calculate the beam-averaged column density in the optically thin case,
 (4)
(4)
we derive Q from a fit to the partition functions measured for different rotation temperatures in the range between 9 and 300 K that was taken from the Cologne Database for Molecular Spectroscopy (CDMS)3. The measured values of the partition functions listed on the CDMS are determined from the sum of the population of the 86 and 110 GHz transitions and take the spin multiplicity of the 14 N nucleus, gI = 3, into account. The fit yields a total partition function for ortho and para NH2D of  . We obtain the statistical weight from g = gJ × gI = 27 with the angular momentum J = 1, the N and D4 nuclear spins of 1, and the H nuclear spin of 1/2.
3.4 NH2D excitation
Furthermore, we test the assumption that the NH3 rotational temperature between the (1,1) and (2,2) inversion transition is equal to the NH2D excitation temperatureusing the NH2D 111 –101 line at 110 GHz and the NH2D 212 –202 transition at74 GHz that was observed towards a subsample of 24 ATLASGAL sources. The rotational temperature between the NH2D transitions at 110 and 74 GHz is determined from the simultaneous modelling of the 74 and 110 GHz lines (see Fig. 4) using MCWeeds (Giannetti et al. 2017). This assumes equal excitation temperatures of the 111 –101 and 212 –202 lines under LTE conditions. This package is based on WEEDS (Maret et al. 2011) from the CLASS software and adds Bayesian statistics and fitting algorithms to Weeds to automatise the simultaneous fitting of the lines of several species. Furthermore, errors on the NH2D temperature are also estimated by MCWeeds. It determines the NH2D rotational temperature for given starting values of the input parameters, that is, the NH2D column density, temperature, line width, and source size. As starting values we used the results from our hyperfine structure fitting of the NH2D transition at 110 GHz and the NH3(1,1) and (2,2) lines. The fit parameters, the radial velocity of para NH2D at 74 GHz,  , the line width, Δv74, and the NH2D temperature,
  , are given in Table 4.
While modelling of the two NH2D lines leads to the NH2D temperature for sources with a detected NH2D transition at 74 GHz, we obtained an upper limit to the NH2D temperature for the non-detections. Comparison of the rotational temperature between the NH3 (1,1) and (2,2) inversion transition (Wienen et al. 2012) with the NH2D temperature in Fig. 5 yields a difference in the NH2D and NH3 rotational temperatures for a subsample of the sources. However, a fraction of the clumps exhibit larger NH3 than NH2D rotational temperatures, in some cases supported by upper limits to the NH2D temperature. We note that the critical density is proportional to the Einstein A-coefficient, which in turn is proportional to ν3. A factor 4.6 higher frequency of NH2D at 110 GHz than of the NH3(1,1) and (2,2) lines leads to a much higher critical density of NH2D than NH3 (see Table 1).
In addition to our assumption of the same excitation temperature for the 74 and 110 GHz lines as there would be for LTE, we also run a non-LTE modelling using RADEX (van der Tak et al. 2007) with a fixed kinetic temperature of 20 K and a fixed NH2D column density of 1.6 × 1015 cm−2 corresponding to the mean values of our ATLASGAL sample. We use the recent calculations by Daniel et al. (2014) for the collisional rates with the H2 molecule forour non-LTE calculations. This resulted in similar excitation temperatures of the 74 and 110 GHz NH2D lines at high densities (> 106 cm−3). The five detections at 74 GHz from our sample are classified as young stellar objects (YSOs), hot cores, or HII regions. Urquhart et al. (in prep.) determined volume densities of ~ 106 cm−3 based on the dust continuum from the ATLASGAL survey for these sources, which are also consistent with the typical density of YSOs probed in NH2D by Pillai et al. (2011).
We compared NH2D column densities using the NH3 rotational temperature and NH2D temperature as excitation temperature for sources with detections at 74 and 110 GHz. This shows that for the subsample with larger NH3 rotational temperatures than NH2D temperatures we overestimate the NH3 deuteration by 47%. Similarly, we underestimate the NH3 deuteration by ~32% for the subsample with lower NH3 rotational temperature than the NH2D temperature. We cannot exclude subthermal excitation due to densities below the NH2D line critical densities that lead to lower temperatures.
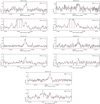 |
Fig. 4 Examples of reduced and calibrated spectra of observed NH2D lines at 110 and 74 GHz. The bright line of G31.41+0.31 and G34.26+0.15 with a frequency close to 74.15 GHz consists of four blended lines of CH3OCH3; their frequencies are labelled as lines in the spectra. Results of simultaneous modelling of the NH2D transitions at 110 and 74 GHz (see Sect. 3.4) are illustrated in red. |
Parameters of the NH2D line at 74 GHz. Errors are given in parentheses.
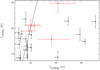 |
Fig. 5 Observed NH3 rotational temperature between the (1,1) and (2,2) inversion transition is shown against modelled NH2D rotational temperature between the 111–101 line at 110 GHz and the 212–202 transition at74 GHz. Sources with a detected 74 GHz line are marked in red, and non-detections with an upper limit of the NH2D temperatureare labelled as black arrows. The straight line corresponds to equal temperatures. |
3.5 NH3 deuteration
We determine the fractionation ratio by the total column density of ortho and para NH2D (see Sect. 3.3) to the NH3 column density ratio assuming that the two molecules originate from the same gas. The source-averaged NH3 column density was calculated for ATLASGAL sources in the first quadrant in Wienen et al. (2012) and for clumps in the fourth quadrant in Wienen et al. (2018). To account for the different column density determinations of NH2D (see Sect. 3.3 source- vs. beam-averaged) we derive the NH3 deuteration in two ways. We divide the source-averaged NH2D and NH3 column densities for the NH2D sources with detected hyperfine structure. In the optically thin case we correct the NH2D column density for the beam dilution using the beam filling factor derived from NH3 observations (see Sect. 4.5 in Wienen et al. 2012) to estimate the source-averaged NH2D to NH3 column density ratio. Table 5 shows the source-averaged NH3 column density, the beam filling factor, the NH2D column density, the NH2D to NH3 column density ratio, and the integrated intensity of the NH2D line at 86 GHz, ∫ Tmb dv, with their errors. We measure [NH2D]/[NH3] ratios between 0.007 and 1.6. The distribution of the deuterium fraction of NH3 is shown as a function of the rotational temperature in the upper panel of Fig. 6. Optically thin fits result in lower limits, because the NH2D optical depth is not known for sources without detected hyperfine structure and we cannot exclude a considerable optical depth. We might therefore underestimate the column density by using Eq. (4) in the optically thin case. However, there is still a range of one order of magnitude in the fractionation ratio. We consider only measurements with relative errors on the presented NH2D line parameters of less than ~50% for the correlation plots. In 109 out of the 264 clumps detected in NH2D and NH3 (41%) with reliable hyperfine structure fits we determine high deuteration (>0.16) with 0.16 being the lowest deuteration in this sample. Of those, 18 sources exhibit errors in the [NH2D]/[NH3] ratio of greater than 50%.
Source-averaged NH3 and ortho NH2D column densities and deuteration.
3.6 The ortho-to-para ratio of NH2D
For a subsample of 113 ATLASGAL sources we detect the NH2D ortho line at 86 and para line at 110 GHz. We calculate the ortho-to-para column density ratio assuming the same beam filling for the two transitions, as expected for unresolved, clumpy structure observed within molecular clouds that fill the beam (Stutzki & Guesten 1990; Perault et al. 1985). We distinguish between three different cases depending on the optical depth of the source: We divide the source-averaged column densities derived from the transition at 86 and 110 GHz as given in Eq. (3) with the molecular line parameters listed in Table 1 for sources with detected hyperfine structure in ortho and para NH2D. Here, Q is determined from separate fits to the partition functions of ortho and para NH2D at 86 and 110 GHz against rotation temperatures from 3 to 300 K published on the CDMS. These result in  for the ortho line and
  for the para line. The ortho and para partition functions differ by a factor three, which results from the spin multiplicity. Our fit of the two partition functions yields an exponent of 3/2, as expected for slightly asymmetric top molecules (Mangum & Shirley 2015).
For sources without detected hyperfine structure in ortho and para NH2D we derive the beam-averaged NH2D column densities using Eq. (4) with the observed intensities and molecular line parameters for the transitions at 86 and 110 GHz given in Table 1 and separate ortho and para partition functions. To correct the NH2D column densities for the beam dilution we divide the two by the beam filling factor; they cancel out in the computation of the ortho-to-para ratio from the column density ratio.
As we cannot detect the hyperfine structure of the NH2D line at 110 GHz for the majority of sources, we cannot measure the optical depth at 110 GHz directly. To derive the ortho-to-para ratio for the subsample with detected hyperfine structure in ortho NH2D we calculated the column density of para NH2D in the optically thin approximation from Eq. (4) using the molecular line parameters at 110 GHz and the para partition function. We get an estimate of the optical depth at 110 GHz iteratively from the known optical depth at 86 GHz: We start with an ortho-to-para ratio of three as expected from their statistical values, calculate the optical depth at 110 GHz by the ratio of the optical depth at 86 GHz to the ortho-to-para ratio, and compute the column density ratio determined from the lines at 86 and 110 GHz. This is used subsequently as the ortho-to-para ratio in the calculation of the optical depth at 110 GHz until the ortho-to-para ratio converges. With the resulting optical depth at 110 GHz we multiply the column density of para NH2D by the factor τ′∕(1 −exp(−τ′)) with τ′ = 0.679 τ0.911, which corrects for the optical depth of the line at 110 GHz (Stutzki et al. 1989), and divide by the beam filling factor. The ortho-to-para ratio is then determined from the source-averaged ortho and para column densities. We also tested if the ortho-to-para ratio depends on the initial value chosen for this ratio. We therefore varied this from 3 to 1 and 5, but the iteratively determined ortho-to-para ratios of the whole sample did not change statistically.
Using an initial ortho-to-para ratio of 3 we obtain the distribution of the iteratively derived ortho-to-para ratios shown by the black histogram in Fig. 7 with a median ortho-to-para ratio of 3.7 and a standard deviation of 1.2. Our ortho-to-para ratio is close to the value expected from the nuclear statistical weights of 3 and 1 for the ortho and para NH2D species, respectively. The column density derived from the NH2D transition at 110 GHz and the ortho-to-para ratio with their errors are given in Table 6.
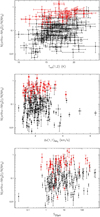 |
Fig. 6 NH2D to NH3 column density ratio compared with the NH3 rotational temperature, line width, and the MSX 21 μm flux for the ATLASGAL sources; clumps with and without detected hyperfine structure are shown with red triangles and black points, respectively. |
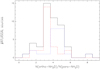 |
Fig. 7 Number distribution of the column density ratio derived from the ortho and para NH2D transitions shown in black for the subsample detected in NH2D with a NH3 counterpart, as dashed red line for ATLASGAL sources with a NH3 deuteration <0.2 and as dotted blue line for a deuterated factor >0.2. |
Column density derived from the NH2D line at 110 GHz and ortho-to-para ratio.
4 Discussion
4.1 NH3 and NH2D rotational temperature
The NH3 rotational temperature between the (1,1) and (2,2) inversion transition is compared with the rotational temperature between the NH2D transitions at 110 and 74 GHz in Fig. 5. This comparison reveals a large range of variation in temperature; two clumps, G31.41+0.31 and G34.26+0.15, exhibit extremely high NH2D temperatures of 37 and 42 K. The high excitation temperature points to the hot molecular core as the main origin of the deuterated ammonia in these sources. We found little deuterium fractionation for G31.41+0.31 of 0.15 and for G34.26+0.15 of 0.02 as expected at the high temperatures of hot cores and close to the values reached by models of hot molecular cores.
High-resolution observations of high-mass star-forming regions in NH2D have shown that while NH2D shows an excellent correlation with dust continuum in high-mass cold cores, deuterated ammonia avoids the dense peaks close to very luminous protostars (Busquet et al. 2010; Pillai et al. 2011). While this might be a temperature effect in regions with complex dynamics, without further high-angular-resolution observations, we are unable to confirm that the major contributing factor is deuteration.
4.2 Comparison of NH3 deuteration in ATLASGAL sources with other samples
We derive a deuterium fraction between 0.007 and 1.6 in Sect. 3.5, sources without detected hyperfine structure exhibit low [NH2D]/[NH3] ratios with amedian of 0.05 ± 0.01, and clumps with detected hyperfine structure in NH2D and NH3 have a higher deuteration with a median of 0.4 ± 0.05. The [NH2D]/[NH3] ratios of approximately 1 are among the highest given in the literature so far. Other high average deuteration factors were estimated tobe 0.8 for starless cores associated with the UCHIIR IRAS 20293+3952 (Busquet et al. 2010), 0.66 was derived for a small sample of clumps embedded in infrared-dark clouds by Pillai et al. (2007), and 0.5 in the low-mass starless core L1544 in Taurus (Crapsi et al. 2007).
A lower deuteration of 0.33 was obtained by Hatchell (2003) towards low-mass protostellar cores in Perseus, where optical depth could be measured and [NH2D]/[NH3] ratios best determined, and a deuteration of 0.1 was found in dark clouds by Tiné et al. (2000). Shah & Wootten (2001) observed NH2D in low-mass and quiescent protostellar cores and measured a deuteration factor between 0.003 and 0.13, and Saito et al. (2000) determined a similar range in deuteration in dark cloud cores located mostly in the Taurus and Ophiuchus regions. A comparison of the deuterium fraction of NH3 towards the low-mass samples shows that Saito et al. (2000) and Shah & Wootten (2001) estimated lower values on average than Hatchell (2003). This latter author suggested an increase in deuteration from larger to smaller scales towards protostellar cores as reason for the low [NH2D]/[NH3] ratio obtained by Shah & Wootten (2001) and Saito et al. (2000), who measured NH2D with a larger beam width than Hatchell (2003) or with an offset from the dust peak. We summarise the deuterium fractionation of the different samples from the literature in Table 7 with the source number, the NH2D detection rate, the NH2D to NH3 column density ratio, and reference. Most of these studies calculated the NH2D column density under the assumption of LTE; only Crapsi et al. (2007) and Shah & Wootten (2001) used non-LTE models.
For comparison of the NH3 deuteration in the ATLASGAL sample other studies with similar beamwidth as our NH3 and NH2D measurements are available in the literature: Fontani et al. (2015) observed the two molecules in dense cores associated with different evolutionary phases of high-mass star formation and determined a deuterium fraction of NH3 between 0.21 and 0.34. Pillai et al. (2007) found a deuterium fractionation from 0.004 to 0.7 that is similar for most clumps embedded in infrared-dark clouds. These [NH2D]/[NH3] ratios are consistent with those of the ATLASGAL sources, although we estimate an even higher deuteration than Pillai et al. (2007), up to 1.6 in a few ATLASGAL clumps. Recently, Sipilä et al. (2019) compared two approaches to model deuterium fractionation that differ in their mechanism to describe ion-molecule proton-donation reactions. The full scrambling model comprises multiple interchanges of atoms including for example proton hop and proton exchange (Oka 2004). The time evolution of their full scrambling model (Sipilä et al. 2015b) leads to a deuteration of the order of 10−1 over one phase, similar to models of earlier studies (Roberts & Millar 2000b; Millar 2002). To reach such a high rate as measured towards the ATLASGAL sample we speculate that each of several clumps within the beam goes through a cycle of enrichment consisting of freeze-out and evaporation during a dense and cold phase. The high deuterium fractionation of our sample might then result from the accumulation of [NH2D]/[NH3] ratios of individual clumps within the beam. NH3 deuteration as high as our observed values is obtained by the model of Sipilä et al. (2019), which limits proton-donation reactions to proceed only through proton hop (cf. Hily-Blant et al. 2018). This model predicts a [NH2D]/[NH3] ratio exceeding 1 for a density of 106 cm−3 after one phase that lasts ~105 yr.
A comparison of the [NH2D]/[NH3] ratio of the ATLASGAL sources with that of low-mass star-forming samples, for example 0.02–0.1 by Tiné et al. (2000), 0.025–0.18 by Saito et al. (2000), and 10−3–10−1 by Shah & Wootten (2001), indicates at least similar deuteration in high-mass star-forming regions. Kauffmann et al. (2010) found that at a certain radius cluster-forming clouds have more mass and therefore a higher density than their counterparts without cluster formation. As the timescale of deuteration has been found to be shorter with increasing density (Körtgen et al. 2017), we expect an enhanced deuterium fractionation of ATLASGAL sources resulting from the higher density of this high-mass star-forming sample.
Comparison of the NH3 deuteration from ATLASGAL with other samples.
4.3 Does the deuterium fraction of NH3 trace the evolution of ATLASGAL clumps?
Deuteration as an evolutionary tracer of low- and high-mass star formation
Busquet et al. (2010) detected NH2D emission in a few starless cores, while it is not associated with YSOs in a high-mass star-forming region. The deuterium fraction of NH3 therefore allowed them to distinguish between the pre-protostellar and protostellar phase. Fontani et al. (2011) obtained differences in the deuteration of about 30 cores at various evolutionary phases of high-mass star formation from the derivation of the [N2D+]/[N2H+] ratio. These latter authors found a decrease in the deuterium fraction from high-mass cores without stars to the evolutionary stages after the formation of protostars. In addition, they obtained a slight decrease of the fractionation with temperature and N2 H+ line width. Kang et al. (2015) also found the narrowest line widths for the youngest Class 0 protostars in Orion with the largest amount of deuteration in H2CO, which hints at early stages of star formation. However, they did not find a clear correlation of the [HDCO]/[H2CO] ratio and the mass-to-luminosity ratio as a tracer of the evolutionary phase. Shah & Wootten (2001) claimed to have found a trend of increasing NH3 deuteration with decreasing temperature. However, the sample of these latter authors contains only a few low-mass cores, which introduces a large statistical error. Emprechtinger et al. (2009) determined the [N2 D+]/N2H+] ratio for 20 protostellar cores in low-mass star-forming regions, which also yields an anticorrelation of deuteration with temperature.
While previous studies of deuteration focused on low-mass star-forming samples, molecules different from NH2D, such as N2 D+, and small source samples, in this section, we examine whether or not the deuterium fraction of NH3 is an indicator of the evolution in a large sample of high-mass star-forming regions. Because we obtained a statistically significant correlation between the NH3 (1,1) line width and rotational temperature of ATLASGAL sources with the evolutionary phase in Wienen et al. (2012), we use these properties to investigate a dependence of the NH3 deuteration on the evolution.
NH3 rotational temperature
The [NH2D]/[NH3] ratio is plotted against the NH3 rotational temperature between the (1,1) and (2,2) inversion transitions in the upper panel of Fig. 6. The rotational temperature of the ATLASGAL sources detected in NH2D ranges between 10 and 24 K and NH3 column densities between 1.6 × 10¹⁴ and 1016 cm−2 (see Wienen et al. 2012). One expects the largest deuterium fraction of NH3 at temperatures lower than 20 K resulting from collisions between H and HD producing H2D+ and increasing the [H2D+]/[H
 ] ratio (Flower et al. 2004; Roberts & Millar 2000a). H2D+ is an important molecule in deuterium chemistry in cold clouds and enhances the deuteration of several other molecules. However, H2D+ is destroyedby neutral molecules such as CO at temperatures above ~ 25 K and by ortho-H2 at temperatures below that as well. Freeze-out of CO onto dust grains increases the abundance of deuterated molecules at low temperatures and high densities. However, the deuteration of the ATLASGAL sample does not show an anticorrelation with temperature. This agrees with previous results from Pillai et al. (2011) and Fontani et al. (2015). A small sample of IRDCs show no trend between [NH2D]/[NH3] ratio and temperature (Pillai et al. 2011) and the NH3 deuteration does not rise with decreasing temperature for their sample of about 30 dense cores in different evolutionary phases of high-mass star formation (Fontani et al. 2015).
Production of NH2D begins during the early pre-protostellar phase. During the evolution of the ATLASGAL sample, an internal heating source forms in the innermost part of the clump and leads to a higher rotational temperature, while NH2D is constantly accumulated in the still cold outer envelope. We speculate that this process might have the consequenceof a constant deuteration for a rising rotational temperature. Alternatively, the luminosity of forming protostars within the clumps, for example G31.41+0.31 or G34.26+0.15, leads to an increase of temperature and evaporation and a subsequent increase of molecules whose deuteration has enhanced on grain surfaces resulting in an enhanced deuteration in the gas phase. The presence of clumps in a range of evolutionary phases within the beam that contain gas components with varying temperatures might also hide the dependence of increasing NH3 deuteration on temperature.
NH3 line width
We compared the fractionation ratio with the NH3 line width as another evolutionary tracer in the middle panel of Fig. 6. The line widths range between 0.8 and 6.4 km s−1; there is no anticorrelation between deuteration and line width. This is in agreement with the deuteration of dense cores in massive star-forming regions (Fontani et al. 2015), which does not depend on the line width either.
MSX 21 μm flux
ATLASGAL sources without any star formation yet are not or only weakly detected at mid-infrared (MIR) or far-infrared (FIR) wavelengths, while clumps in a later evolutionary phase associated with a heating source emit at 21 μm. We therefore also compare the [NH2D]/[NH3] ratio with the MSX 21μm flux to investigate any trend of the NH3 deuteration with evolution. However, the lower panel of Fig. 6 shows a flat distribution of the MSX flux with the fractionation ratio.
In summary, Fig. 6 illustrates that high-mass star-forming regions might be too complex to show a trend of decreasing NH3 deuteration with increasing rotational temperature or line width. At the large distances of the ATLASGAL sample with a median distance of 4 kpc (Wienen et al. 2015) a clump likely harbours several cores at different evolutionary stages. The presence of multiple evolutionary phases within one source was also found by Urquhart et al. (2014). While observations of nearby low-mass star-forming samples have a much higher spatial resolution and therefore focus on individual cores, the temperature and line width of an ATLASGAL clump results from an average of these properties over the beam width. An ATLASGAL source might therefore host cores with a large amount of NH3 deuteration,low temperatures, and narrow line widths as well as warm, turbulent cores with broad line widths. However, averaging over the beam width results then in a high deuterium fraction of NH3 at relativelyhigh temperatures and broad line widths, and an overall constant distribution of the [NH2D]/[NH3] ratio over the range of NH3 line parameter values.
4.4 NH2D detections and non-detections
We divide the ATLASGAL sources observed in NH2D into two subsamples: one that shows NH2D emission, and another for which NH2D is not detected. Figure 8 shows histograms of the NH3 (1,1) line width, NH3 column density, and rotational temperature for non-detections in black and for detections in red. There is no difference inthe line width, column density, or temperature between the two subsamples; they have a peak at ~ 2.5 km s−1, ~ 2 × 1015 cm−2, and 17 K respectively. The lower panel has a smaller number of sources detected in NH2D than non-detections at rotational temperatures higher than 22 K. Because HII regions have an enhancement in the rotational temperaturedistribution around 20 K (see Wienen et al. 2012), the lower panel of Fig. 8 suggests that the NH2D detection rate is low in HII regions.
4.5 NH3 deuteration at different evolutionary phases
To distinguish various evolutionary stages of ATLASGAL sources detected in NH2D we followed the classification introduced in König et al. (2017) for the TOP100 sample which covers the whole evolutionary sequence. Based on the brightness of these sources at infrared wavelengths and their radio continuum flux, four classes are separated. Adapting this classification, Urquhart et al. (2018) identified the evolutionary stage of the majority of ATLASGAL sources, which we used for association with our NH2D detections. This results in the following:
-
an ATLASGAL sample of 19 clumps that are 70 μm weak: These sources have no pointlike or only a weak counterpart in the Hi-GAL data at 70 μm. This sample is supposed to represent a starless phase or about the earliest stage of high-mass star formation.
-
32 MIR-weak sources: This sample shows compact 70 μm emission, but is not detected at MIR wavelengths or emits only a weak 24 μm flux below the limit of 2.6 Jy that corresponds to an 8 M⊙ star at 4 kpc.
-
152 MIR-bright clumps: These are identified by their bright compact emission at 8 and 24 μm. These sources show signs of star formation activity such as infall or outflows.
-
37 compact HII regions: These objects are characterized by a strong MIR and radio continuum flux. They are the latest evolutionary stage, where high-mass protostars emit ultraviolet radiation, and thus heat and ionise their remaining molecular cloud forming compact HII regions.
We summarise the identification of the various evolutionary phases of the ATLASGAL sample detected in NH2D in Table 8. This gives the fraction of sources in each evolutionary stage for the whole sample and shows that most NH2D detections are MIR bright, that the number of MIR-weak sources and compact HII regions are similar, and that the lowest number of NH2D detections are 70 μm-weak clumps. Comparison of the [NH2D]/[NH3] ratio with the NH3 (1,1) line width and rotational temperature (see Fig. A.1) shows that the 70 μm-weak sample exhibits the narrowest line widths (<2.5 km s−1) and smallest rotational temperatures (<17.2 K). The MIR-weak and MIR-bright sources cover a large range around the mean line width of 2.2 km s−1 and mean rotational temperature of 17.3 K. Large line widths up to 6.4 km s−1 and high rotational temperatures up to 23 K are found for the compact HII regions. However, the subsamples in the various evolutionary phases do not differ with regard to NH3 deuteration and the [NH2D]/[NH3] ratios do not show any trend with the evolutionary sequence.
We performed a Kolmogorov–Smirnov (KS) test with the subsamples at the different evolutionary stages to analyse whether or not they differ significantly in NH3 deuteration. The distributions of the 70 μm-weak sources, the MIR-weak sources, and compact HII regions do not contradict the idea that they are drawn from the same parent population. The cumulative distribution plot in Fig. 9 yields a higher NH3 deuteration for clumps with weak or bright MIR emission. The NH2D/NH3 ratio is low for the 70 μm-weak phase, rises for the MIR-weak/MIR-bright sources, and decreases again for the compact HII regions. Compared to low-mass star formation, where deuteration decreases with rising temperature (Crapsi et al. 2005; Emprechtinger et al. 2009), we find a shift of the maximum deuterated NH3 of ATLASGAL sources to a later evolutionary phase. The initial conditions to form NH2D and to increase the deuterium fractionation is sensitive to (low) temperature and (high) density. While the 70 μm-weak clump might be cold, it is unclear that it is sufficiently dense. There is evidence from some recent observations that high-mass 70 μm-weak clumps are likely to contain modest sub-structure in dense cores, and that the clump mass reservoir is dominated by low density material (Pillai et al. 2019). During the MIR-weak phase, the density is likely to be high enough while the overall temperatures remain low enough to result in deuterium enhancement. During the MIR-bright phase, the NH2D/NH3 ratio is likely to reach the peak. Protostellar heating raises the temperature, but affects deuteration only in the immediate vicinity of the core so that the decrease of the deuterium fractionation might be undetectable in single-dish observations. This might be different when zooming into these cores at a resolution of less than a few thousand AU, where the direct heating from the protostar is efficient and would reveal the effect of deuteration (Pillai et al. 2011). The continued star formation during the compact HII region phase is expected to result in a decrease in deuteration that makes it undetectable. The exact nature of deuterium enhancement with evolution can only be constrained by high-resolution observations in a single star-forming region that hosts cores at all these various evolutionary stages.
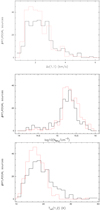 |
Fig. 8 Distribution of ATLASGAL sources with the NH3 (1,1) line width, rotational temperature, and NH3 column density are plotted for NH2D detections in red and non-detections in black. |
Number and fraction of ATLASGAL sources detected in NH2D at different evolutionary stages of high-mass star formation.
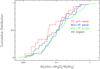 |
Fig. 9 Cumulative distribution functions display [NH2D]/[NH3] ratios for thesubsamples in Table 8. The distribution of 70 μm-weak sources is marked as a solid red line, the MIR-weak clumps are shown as a dashed blue curve, the MIR-bright phase as a dotted green line, and the compact HII regions as a dashed-dotted black curve. A deuterium fraction of NH3 > 1 might result from passing through several dense and cold phases (see Sect. 4.2). A systematic error of the NH3 deuteration is given by the difference between the NH3 and NH2D excitation temperature. |
4.6 The integrated intensity ratio of ortho and para NH2D
In addition to the calculation of the ortho-to-para ratio given in Sect. 3.6, we also determined the velocity integrated intensity ratio, r, of the ortho and para NH2D transition to compare with other studies. The integrated intensity of the ortho line, para line, and the ratio of the two is reported in Table 9. This resulted in a mean r of 2.6 ± 0.8 which confirms the results from previous studies using smaller samples. Fontani et al. (2015) obtained a ratio r of 2.6 ± 0.6 for high-mass star-forming samples covering different evolutionary phases, which is in agreement with our result. In addition, our values are similar to the integrated line intensity ratios derived by Pillai et al. (2007) for clumps embedded in infrared-dark clouds. Shah & Wootten (2001) give a range in Ntot(86 GHz)∕Ntot(110 GHz) for low-mass protostellar cores of between approximately 2 and 6, which is in agreement with our values for r.
We investigate whether or not there is a correlation of the ortho-to-para ratio computed in Sect. 3.6 with NH3 deuteration, NH3 (1,1) line width, and rotational temperature in Figs. 10 and 11. ATLASGAL sources, whose hyperfine structure is not detected in ortho or para NH2D, are indicated as black points. There are only two clumps with detected hyperfine structure in NH2D at 86 and 110 GHz, which are shown as red triangles. However, Fig. 10 and 11 do not show a correlation between the ortho-to-para ratio and any of the NH3 parameters. This yields therefore no evolutionary trend of the ortho-to-para ratio.
 |
Fig. 10 NH3 deuteration is compared with the ortho-to-para ratio. ATLASGAL sources without hyperfine structure in NH2D at 86 or 110 GHz are illustrated as black points and clumps with detected hyperfine structure in both lines as red triangles. |
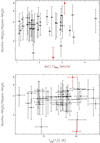 |
Fig. 11 Ortho-to-para ratio against NH3 (1,1) line width (upper panel) and against rotational temperature (lower panel). ATLASGAL clumps, which have no detected hyperfine structure in NH2D at 86 or 110 GHz are displayed as black points and sources with detected hyperfine structure in both transitions as red triangles. |
Velocity integrated intensity derived from the NH2D line at 86 GHz, from the line at 110 GHz, and the ratio of both integrated intensities.
5 Conclusions
Using the Mopra telescope and the IRAM 30m telescope, the 86 GHz NH2D lines were observed toward 992 dust condensations identified in the ATLASGAL survey. In the first quadrant of the Galaxy, 373 sources were also observed in the 110 GHz para line with the IRAM 30m telescope. They are located within a Galactic longitude from 8° to 60° and between 300° and 359° and latitude of ± 1.5°. We summarise our main results in this section.
- 1.
The detection rate of NH2D towards the ATLASGAL sample is high and therefore yields a large NH3 deuteration of these sources.
- 2.
We calculate the total NH2D column density to determine the NH2D-to-NH3 column density ratio. This results in a large range of NH3 deuteration from 0.007 to 1.6. The deuterium fraction of NH3 in ATLASGAL clumps is higher than the [NH2D]/[NH3] ratios derived for low-mass star-forming samples and in agreement with those obtained in other high-mass star-forming regions. We measure the highest NH3 deuteration reported in the literature so far.
- 3.
The excitation of NH2D was studied using the transitions at 74 and 110 GHz for the first time to our knowledge. This shows a clear difference between the NH2D and NH3 rotational temperatures for a subsample of the sources. In cases where NH2D temperatures are lower than NH3 temperatures, deuteration would be overestimated, suggesting non-LTE conditions. To determine the NH2D temperature directly, the NH2D lines at 74 and 110 GHz should be observed simultaneously.
- 4.
Comparison of NH2D detections and non-detections suggests that the fraction of sources detected in NH2D is higher for the earlier evolutionary phases.
- 5.
We analyse whether or not there is a trend of NH3 deuteration with evolutionary tracers. While the [NH2D]/[NH3] ratio is expected to decrease with rising rotational temperature (Roberts & Millar 2000b; Sipilä et al. 2015a), we obtain a flat distribution of the deuterium fractionation with the NH3 (1,1) line width, rotational temperature, and the MSX 21 μm flux. Observations of ATLASGAL clumps with a high [NH2D]/[NH3] ratio within a large beam width might also include cores of large line widths and temperatures. An average over the beam width would lead to an increase of these NH3 properties with an enhanced NH3 deuteration. Future interferometric follow-up observations could resolve this issue.
- 6.
We divide the ATLASGAL sample into different evolutionary phases, but do not find any correlation between these and NH3 deuteration. The NH2D/NH3 ratio is maximum during the MIR bright phase and is therefore reached at a later evolutionary stage compared to low-mass star formation.
- 7.
We estimate the ratio of the ortho-to-para NH2D column density ratio. This results in a median ortho-to-para ratio of 3.7 close to the expected value of 3. The ortho-to-para column density ratios are in agreement with those of other low- and high-mass star-forming samples.
Acknowledgements
This paper is dedicated to the memory of Malcolm Walmsley, who passed away before this study could be completed. The present work benefited greatly from his insight and extensive advice. We are grateful for numerous inspiring discussions with him about various aspects of ammonia and its deuteration.
Appendix A NH3 deuteration and evolutionary tracers
We associated our NH2D detections with the ATLASGAL sources classified in Urquhart et al. (2018). The [NH2D]/[NH3] ratio of the different subsamples is plotted against the NH3 rotational temperature and (1,1) line width in Fig. A.1.
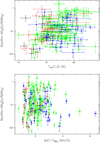 |
Fig. A.1 NH3 deuteration as a function of NH3 (1,1) line width and rotational temperature between the (1,1) and (2,2) inversion transition. ATLASGAL clumps that are 70 μm weak are illustrated as black points, MIR-weak sources as red points, MIR-bright clumps as green triangles, and compact HII regions as blue triangles. |
Appendix B Do NH2D clumps withand without detected hyperfine structure differ?
After not seeing any trend in the NH3 deuteration with the evolution of our ATLASGAL subsample, we searched for differences of ATLASGAL sources with or without detected hyperfine structure in NH2D. We cannot distinguish these two categories based on the rotational temperature, NH3 line width, or MSX 21μm flux of the ATLASGAL clumps as indicated by Fig. 6. We compared the [NH2D]/[NH3] ratio with the NH3 column density in Fig. B.1 to examine whether or not the largest column densities are related to the high deuteration of clumps withdetected hyperfine structure and the sources without detected hyperfine structure and with low deuteration exhibit the lowest column densities. However, we find no difference in the column density of ATLASGAL clumps with or without detected hyperfine structure. Because Fig. B.1 might present a decreasing trend in the deuterium fraction of NH3 of sources with detected hyperfine structure and rising NH3 column density, we performed a t-test to examine whether or not the slope of the distribution is equal to zero. Because the t-test yields a p-value of 0.02, which is below the assumed significance level of 0.05, we can reject the hypothesis that the distribution can be fitted by a function with a slope of zero. The fractionation ratio of the sources with detected hyperfine structure will therefore become lower if the NH3 column density increases and can be fitted by [NH2D]/[NH3] = −0.39log10(Ntot (NH3)) + 6.5.
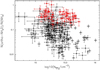 |
Fig. B.1 Dependence of NH3 deuteration on NH3 column density. A linear fit is illustrated by the straight line. ATLASGAL clumps without detected hyperfine structure in NH2D are illustrated as black points and sources with detected hyperfine structure as red triangles. |
References
- Bergin, E. A., & Tafalla, M. 2007, ARA&A, 45, 339 [NASA ADS] [CrossRef] [Google Scholar]
- Busquet, G., Palau, A., Estalella, R., et al. 2010, A&A, 517, A6 [NASA ADS] [CrossRef] [EDP Sciences] [Google Scholar]
- Caselli, P. 2002, Planet. Space Sci., 50, 1133 [NASA ADS] [CrossRef] [Google Scholar]
- Caselli, P., Walmsley, C. M., Tafalla, M., Dore, L., & Myers, P. C. 1999, ApJ, 523, L165 [Google Scholar]
- Crapsi, A., Caselli, P., Walmsley, C. M., et al. 2005, ApJ, 619, 379 [Google Scholar]
- Crapsi, A., Caselli, P., Walmsley, M. C., & Tafalla, M. 2007, A&A, 470, 221 [NASA ADS] [CrossRef] [EDP Sciences] [Google Scholar]
- Csengeri, T., Urquhart, J. S., Schuller, F., et al. 2014, A&A, 565, A75 [NASA ADS] [CrossRef] [EDP Sciences] [Google Scholar]
- Csengeri, T., Leurini, S., Wyrowski, F., et al. 2016, A&A, 586, A149 [NASA ADS] [CrossRef] [EDP Sciences] [Google Scholar]
- Danby, G., Flower, D. R., Valiron, P., Schilke, P., & Walmsley, C. M. 1988, MNRAS, 235, 229 [NASA ADS] [CrossRef] [Google Scholar]
- Daniel, F., Faure, A., Wiesenfeld, L., et al. 2014, MNRAS, 444, 2544 [NASA ADS] [CrossRef] [Google Scholar]
- Emprechtinger, M., Caselli, P., Volgenau, N. H., Stutzki, J., & Wiedner, M. C. 2009, A&A, 493, 89 [NASA ADS] [CrossRef] [EDP Sciences] [Google Scholar]
- Flower, D. R., Pineau des Forêts, G., & Walmsley, C. M. 2004, A&A, 427, 887 [NASA ADS] [CrossRef] [EDP Sciences] [Google Scholar]
- Flower, D. R., Pineau des Forêts, G., & Walmsley, C. M. 2005, A&A, 436, 933 [NASA ADS] [CrossRef] [EDP Sciences] [Google Scholar]
- Fontani, F., Palau, A., Caselli, P., et al. 2011, A&A, 529, A7 [CrossRef] [EDP Sciences] [Google Scholar]
- Fontani, F., Busquet, G., Palau, A., et al. 2015, A&A, 575, A87 [NASA ADS] [CrossRef] [EDP Sciences] [Google Scholar]
- Garay, G., & Lizano, S. 1999, PASP, 111, 1049 [NASA ADS] [CrossRef] [Google Scholar]
- Giannetti, A., Wyrowski, F., Brand, J., et al. 2014, A&A, 570, A65 [NASA ADS] [CrossRef] [EDP Sciences] [Google Scholar]
- Giannetti, A., Leurini, S., Wyrowski, F., et al. 2017, A&A, 603, A33 [NASA ADS] [CrossRef] [EDP Sciences] [Google Scholar]
- Hatchell, J. 2003, A&A, 403, L25 [NASA ADS] [CrossRef] [EDP Sciences] [Google Scholar]
- Hily-Blant, P., Faure, A., Rist, C., Pineau des Forêts, G., & Flower, D. R. 2018, MNRAS, 477, 4454 [NASA ADS] [CrossRef] [Google Scholar]
- Kang, M., Choi, M., Stutz, A. M., & Tatematsu, K. 2015, ApJ, 814, 31 [NASA ADS] [CrossRef] [Google Scholar]
- Kauffmann, J., Pillai, T., Shetty, R., Myers, P. C., & Goodman, A. A. 2010, ApJ, 716, 433 [NASA ADS] [CrossRef] [Google Scholar]
- König, C., Urquhart, J. S., Csengeri, T., et al. 2017, A&A, 599, A139 [NASA ADS] [CrossRef] [EDP Sciences] [Google Scholar]
- Körtgen, B., Bovino, S., Schleicher, D. R. G., Giannetti, A., & Banerjee, R. 2017, MNRAS, 469, 2602 [NASA ADS] [CrossRef] [Google Scholar]
- Kramer, C., Alves, J., Lada, C. J., et al. 1999, A&A, 342, 257 [NASA ADS] [Google Scholar]
- Kroupa, P., Weidner, C., Pflamm-Altenburg, J., et al. 2013, The Stellar and Sub-Stellar Initial Mass Function of Simple and Composite Populations, eds. T. D. Oswalt, & G. Gilmore, 5, 115 [Google Scholar]
- Kurtz, S., Cesaroni, R., Churchwell, E., Hofner, P., & Walmsley, C. M. 2000, Protostars and Planets IV, 299 [Google Scholar]
- Ladd, N., Purcell, C., Wong, T., & Robertson, S. 2005, PASA, 22, 62 [NASA ADS] [CrossRef] [Google Scholar]
- Mangum, J. G., & Shirley, Y. L. 2015, PASP, 127, 266 [Google Scholar]
- Maret, S., Hily-Blant, P., Pety, J., Bardeau, S., & Reynier, E. 2011, A&A, 526, A47 [NASA ADS] [CrossRef] [EDP Sciences] [Google Scholar]
- McKee, C. F., & Tan, J. C. 2002, Nature, 416, 59 [NASA ADS] [CrossRef] [PubMed] [Google Scholar]
- Millar, T. J. 2002, Planet. Space Sci., 50, 1189 [CrossRef] [Google Scholar]
- Oka, T. 2004, J. Mol. Spectrosc., 228, 635 [NASA ADS] [CrossRef] [Google Scholar]
- Oliveira, C. M., Hébrard, G., Howk, J. C., et al. 2003, ApJ, 587, 235 [NASA ADS] [CrossRef] [Google Scholar]
- Pagani, L., Salez, M., & Wannier, P. G. 1992, A&A, 258, 479 [NASA ADS] [Google Scholar]
- Perault, M., Falgarone, E., & Puget, J. L. 1985, A&A, 152, 371 [Google Scholar]
- Pillai, T., Wyrowski, F., Hatchell, J., Gibb, A. G., & Thompson, M. A. 2007, A&A, 467, 207 [NASA ADS] [CrossRef] [EDP Sciences] [Google Scholar]
- Pillai, T., Kauffmann, J., Wyrowski, F., et al. 2011, A&A, 530, A118 [NASA ADS] [CrossRef] [EDP Sciences] [Google Scholar]
- Pillai, T., Kauffmann, J., Zhang, Q., et al. 2019, A&A, 622, A54 [NASA ADS] [CrossRef] [EDP Sciences] [Google Scholar]
- Price, S. D., Egan, M. P., Carey, S. J., Mizuno, D. R., & Kuchar, T. A. 2001, AJ, 121, 2819 [NASA ADS] [CrossRef] [Google Scholar]
- Roberts, H., & Millar, T. J. 2000a, A&A, 364, 780 [NASA ADS] [Google Scholar]
- Roberts, H., & Millar, T. J. 2000b, A&A, 361, 388 [NASA ADS] [Google Scholar]
- Saito, S., Ozeki, H., Ohishi, M., & Yamamoto, S. 2000, ApJ, 535, 227 [NASA ADS] [CrossRef] [Google Scholar]
- Schuller, F., Menten, K. M., Contreras, Y., et al. 2009, A&A, 504, 415 [NASA ADS] [CrossRef] [EDP Sciences] [Google Scholar]
- Shah, R. Y., & Wootten, A. 2001, ApJ, 554, 933 [NASA ADS] [CrossRef] [Google Scholar]
- Sipilä, O., Caselli, P., & Harju, J. 2015a, A&A, 578, A55 [NASA ADS] [CrossRef] [EDP Sciences] [Google Scholar]
- Sipilä, O., Harju, J., Caselli, P., & Schlemmer, S. 2015b, A&A, 581, A122 [NASA ADS] [CrossRef] [EDP Sciences] [Google Scholar]
- Sipilä, O., Caselli, P., & Harju, J. 2019, A&A, 631, A63 [CrossRef] [EDP Sciences] [Google Scholar]
- Stutzki, J., & Guesten, R. 1990, ApJ, 356, 513 [NASA ADS] [CrossRef] [Google Scholar]
- Stutzki, J., Genzel, R., Graf, U. U., Harris, A. I., & Jaffe, D. T. 1989, ApJ, 340, L37 [NASA ADS] [CrossRef] [Google Scholar]
- Tafalla, M., Myers, P. C., Caselli, P., Walmsley, C. M., & Comito, C. 2002, ApJ, 569, 815 [Google Scholar]
- Tiné, S., Roueff, E., Falgarone, E., Gerin, M., & Pineau des Forêts, G. 2000, A&A, 356, 1039 [NASA ADS] [Google Scholar]
- Urquhart, J. S., Moore, T. J. T., Csengeri, T., et al. 2014, MNRAS, 443, 1555 [Google Scholar]
- Urquhart, J. S., König, C., Giannetti, A., et al. 2018, MNRAS, 473, 1059 [NASA ADS] [CrossRef] [Google Scholar]
- Urquhart, J. S., Figura, C., Wyrowski, F., et al. 2019, MNRAS, 484, 4444 [Google Scholar]
- van der Tak, F. F. S., Black, J. H., Schöier, F. L., Jansen, D. J., & van Dishoeck E. F. 2007, A&A, 468, 627 [NASA ADS] [CrossRef] [EDP Sciences] [Google Scholar]
- Wienen, M., Wyrowski, F., Schuller, F., et al. 2012, A&A, 544, A146 [NASA ADS] [CrossRef] [EDP Sciences] [Google Scholar]
- Wienen, M., Wyrowski, F., Menten, K. M., et al. 2015, A&A, 579, A91 [NASA ADS] [CrossRef] [EDP Sciences] [Google Scholar]
- Wienen, M., Wyrowski, F., Menten, K. M., et al. 2018, A&A, 609, A125 [NASA ADS] [CrossRef] [EDP Sciences] [Google Scholar]
- Wu, L.-x., & Yang, J. 2005, Chinese Astron. Astrophys., 29, 370 [Google Scholar]
available at http://www.iram.fr/IRAMFR/GILDAS
All Tables
Parameters of the NH2D line at 86 GHz and NH3 rotational temperature (Wienen et al. 2018).
Line parameters of the NH2D transition at 110 GHz with errors noted in parentheses.
Number and fraction of ATLASGAL sources detected in NH2D at different evolutionary stages of high-mass star formation.
Velocity integrated intensity derived from the NH2D line at 86 GHz, from the line at 110 GHz, and the ratio of both integrated intensities.
All Figures
|
Fig. 1 Examples of reduced and calibrated spectra of observed NH2D transitions at 86 GHz; the fit is shown in green. The hyperfine structure of the spectra in the first and second rows are clearly detected, while that of the spectra in the third row is too weak to be visible. Frequencies of the hyperfine structure components are indicated by straight lines. |
| In the text | |
|
Fig. 2 Examples of reduced and calibrated spectra of observed NH2D lines at 110 GHz; the fit is indicated in green. Frequencies of the hyperfine structure components are labelled. |
| In the text | |
|
Fig. 3 Line width of the NH2D transition at 86 GHz plotted against the NH3 (1,1) line width. ATLASGAL sources that have an error in the NH2D optical depth of less than or greater than 50% are indicated as red triangles or black points, respectively. The straight line corresponds to equal line widths. |
| In the text | |
|
Fig. 4 Examples of reduced and calibrated spectra of observed NH2D lines at 110 and 74 GHz. The bright line of G31.41+0.31 and G34.26+0.15 with a frequency close to 74.15 GHz consists of four blended lines of CH3OCH3; their frequencies are labelled as lines in the spectra. Results of simultaneous modelling of the NH2D transitions at 110 and 74 GHz (see Sect. 3.4) are illustrated in red. |
| In the text | |
|
Fig. 5 Observed NH3 rotational temperature between the (1,1) and (2,2) inversion transition is shown against modelled NH2D rotational temperature between the 111–101 line at 110 GHz and the 212–202 transition at74 GHz. Sources with a detected 74 GHz line are marked in red, and non-detections with an upper limit of the NH2D temperatureare labelled as black arrows. The straight line corresponds to equal temperatures. |
| In the text | |
|
Fig. 6 NH2D to NH3 column density ratio compared with the NH3 rotational temperature, line width, and the MSX 21 μm flux for the ATLASGAL sources; clumps with and without detected hyperfine structure are shown with red triangles and black points, respectively. |
| In the text | |
|
Fig. 7 Number distribution of the column density ratio derived from the ortho and para NH2D transitions shown in black for the subsample detected in NH2D with a NH3 counterpart, as dashed red line for ATLASGAL sources with a NH3 deuteration <0.2 and as dotted blue line for a deuterated factor >0.2. |
| In the text | |
|
Fig. 8 Distribution of ATLASGAL sources with the NH3 (1,1) line width, rotational temperature, and NH3 column density are plotted for NH2D detections in red and non-detections in black. |
| In the text | |
|
Fig. 9 Cumulative distribution functions display [NH2D]/[NH3] ratios for thesubsamples in Table 8. The distribution of 70 μm-weak sources is marked as a solid red line, the MIR-weak clumps are shown as a dashed blue curve, the MIR-bright phase as a dotted green line, and the compact HII regions as a dashed-dotted black curve. A deuterium fraction of NH3 > 1 might result from passing through several dense and cold phases (see Sect. 4.2). A systematic error of the NH3 deuteration is given by the difference between the NH3 and NH2D excitation temperature. |
| In the text | |
|
Fig. 10 NH3 deuteration is compared with the ortho-to-para ratio. ATLASGAL sources without hyperfine structure in NH2D at 86 or 110 GHz are illustrated as black points and clumps with detected hyperfine structure in both lines as red triangles. |
| In the text | |
|
Fig. 11 Ortho-to-para ratio against NH3 (1,1) line width (upper panel) and against rotational temperature (lower panel). ATLASGAL clumps, which have no detected hyperfine structure in NH2D at 86 or 110 GHz are displayed as black points and sources with detected hyperfine structure in both transitions as red triangles. |
| In the text | |
|
Fig. A.1 NH3 deuteration as a function of NH3 (1,1) line width and rotational temperature between the (1,1) and (2,2) inversion transition. ATLASGAL clumps that are 70 μm weak are illustrated as black points, MIR-weak sources as red points, MIR-bright clumps as green triangles, and compact HII regions as blue triangles. |
| In the text | |
|
Fig. B.1 Dependence of NH3 deuteration on NH3 column density. A linear fit is illustrated by the straight line. ATLASGAL clumps without detected hyperfine structure in NH2D are illustrated as black points and sources with detected hyperfine structure as red triangles. |
| In the text | |
Current usage metrics show cumulative count of Article Views (full-text article views including HTML views, PDF and ePub downloads, according to the available data) and Abstracts Views on Vision4Press platform.
Data correspond to usage on the plateform after 2015. The current usage metrics is available 48-96 hours after online publication and is updated daily on week days.
Initial download of the metrics may take a while.