Open Access
Fig. 7
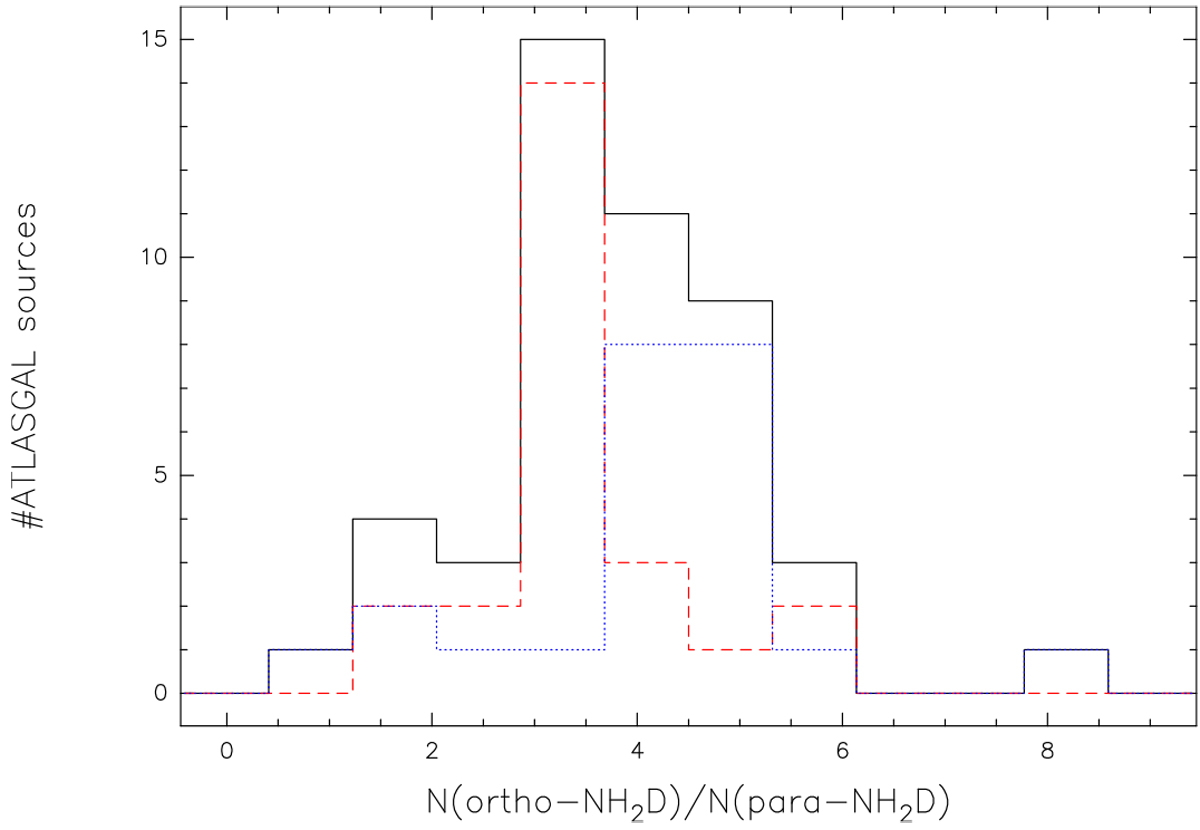
Number distribution of the column density ratio derived from the ortho and para NH2D transitions shown in black for the subsample detected in NH2D with a NH3 counterpart, as dashed red line for ATLASGAL sources with a NH3 deuteration <0.2 and as dotted blue line for a deuterated factor >0.2.
Current usage metrics show cumulative count of Article Views (full-text article views including HTML views, PDF and ePub downloads, according to the available data) and Abstracts Views on Vision4Press platform.
Data correspond to usage on the plateform after 2015. The current usage metrics is available 48-96 hours after online publication and is updated daily on week days.
Initial download of the metrics may take a while.