Fig. 4
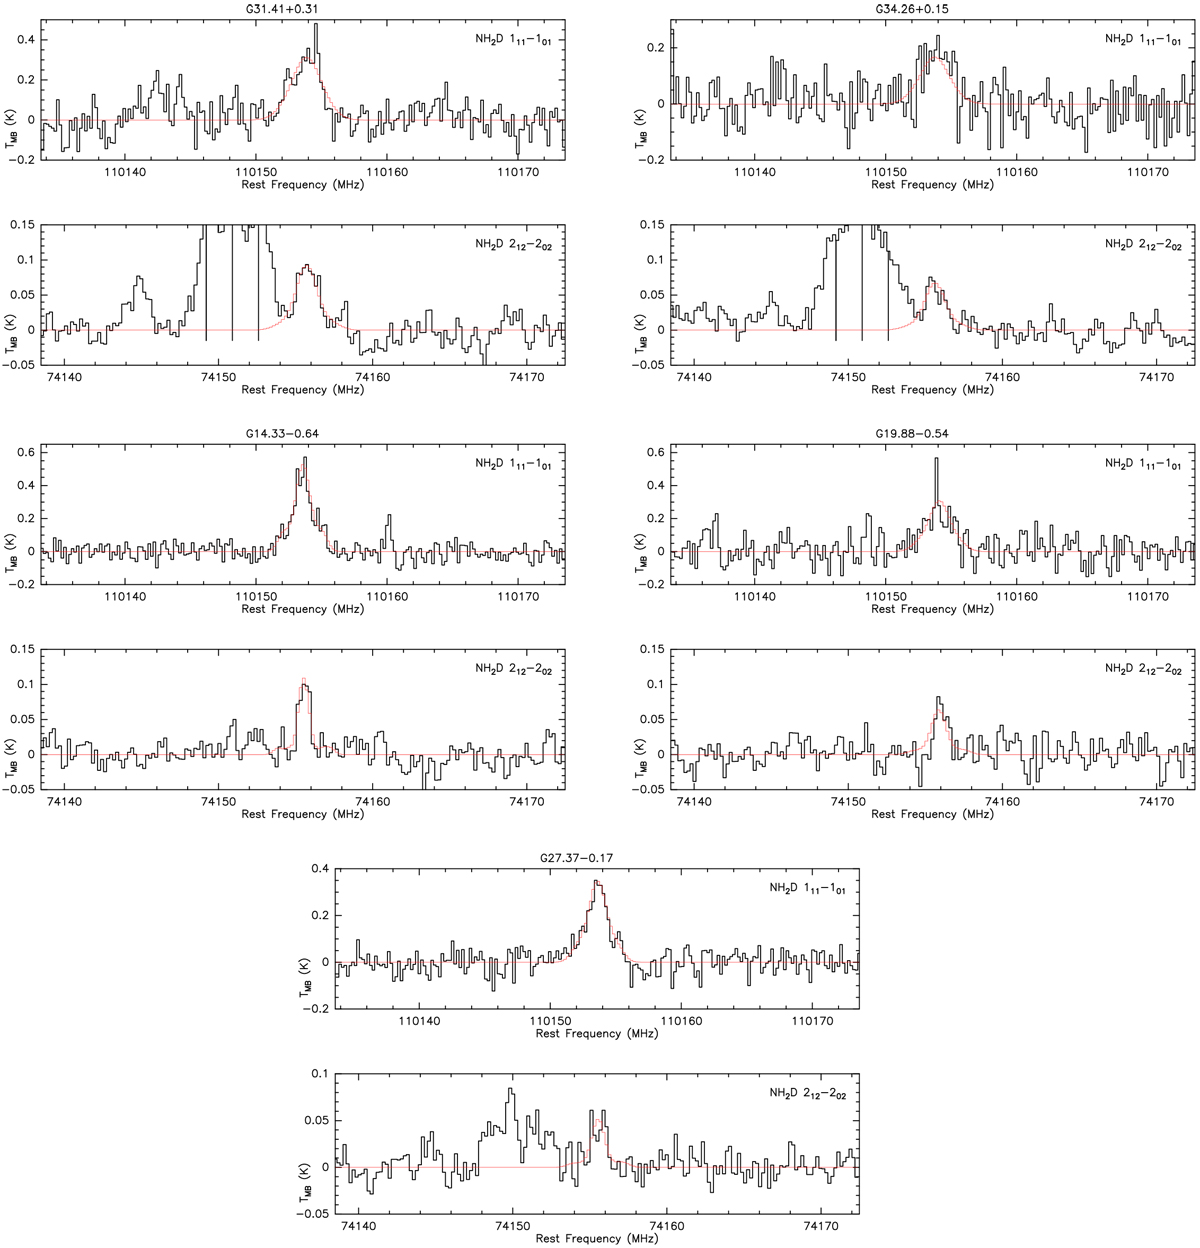
Examples of reduced and calibrated spectra of observed NH2D lines at 110 and 74 GHz. The bright line of G31.41+0.31 and G34.26+0.15 with a frequency close to 74.15 GHz consists of four blended lines of CH3OCH3; their frequencies are labelled as lines in the spectra. Results of simultaneous modelling of the NH2D transitions at 110 and 74 GHz (see Sect. 3.4) are illustrated in red.
Current usage metrics show cumulative count of Article Views (full-text article views including HTML views, PDF and ePub downloads, according to the available data) and Abstracts Views on Vision4Press platform.
Data correspond to usage on the plateform after 2015. The current usage metrics is available 48-96 hours after online publication and is updated daily on week days.
Initial download of the metrics may take a while.