Open Access
Fig. A.1
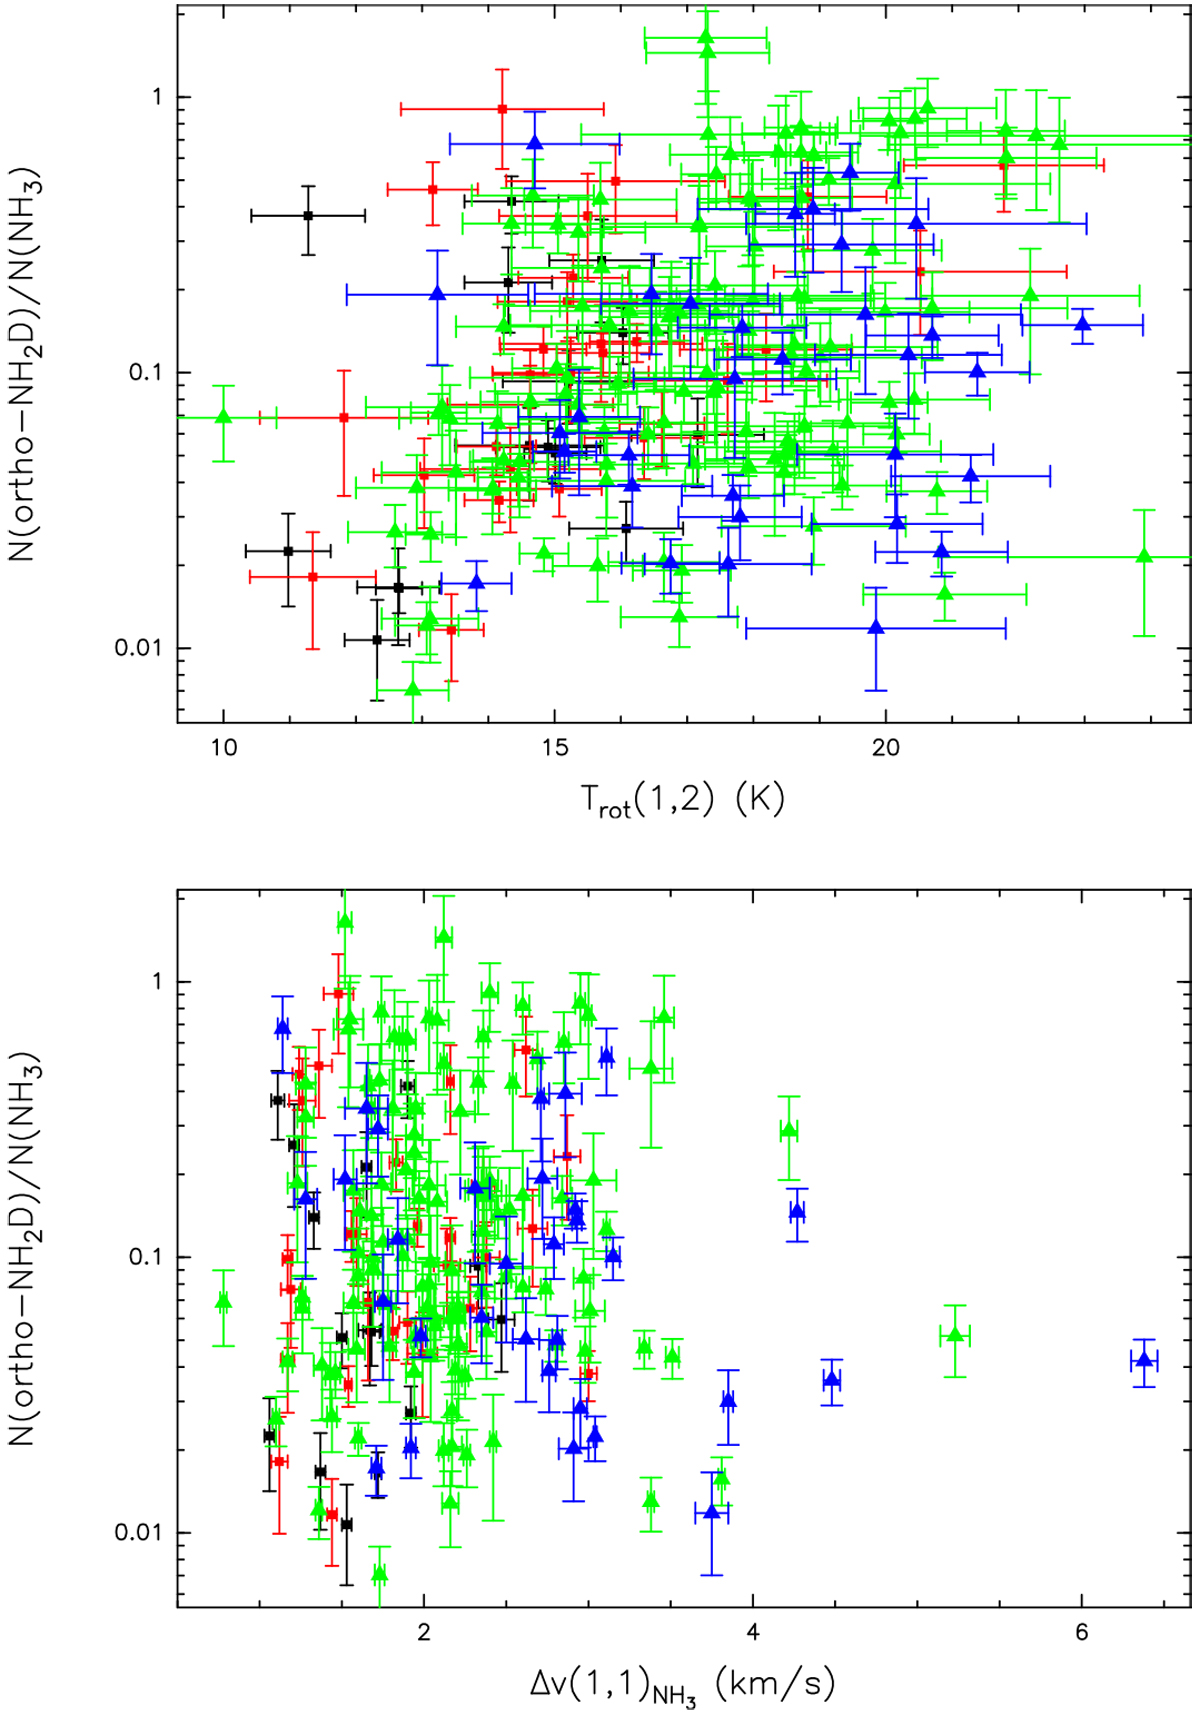
NH3 deuteration as a function of NH3 (1,1) line width and rotational temperature between the (1,1) and (2,2) inversion transition. ATLASGAL clumps that are 70 μm weak are illustrated as black points, MIR-weak sources as red points, MIR-bright clumps as green triangles, and compact HII regions as blue triangles.
Current usage metrics show cumulative count of Article Views (full-text article views including HTML views, PDF and ePub downloads, according to the available data) and Abstracts Views on Vision4Press platform.
Data correspond to usage on the plateform after 2015. The current usage metrics is available 48-96 hours after online publication and is updated daily on week days.
Initial download of the metrics may take a while.