Fig. 9
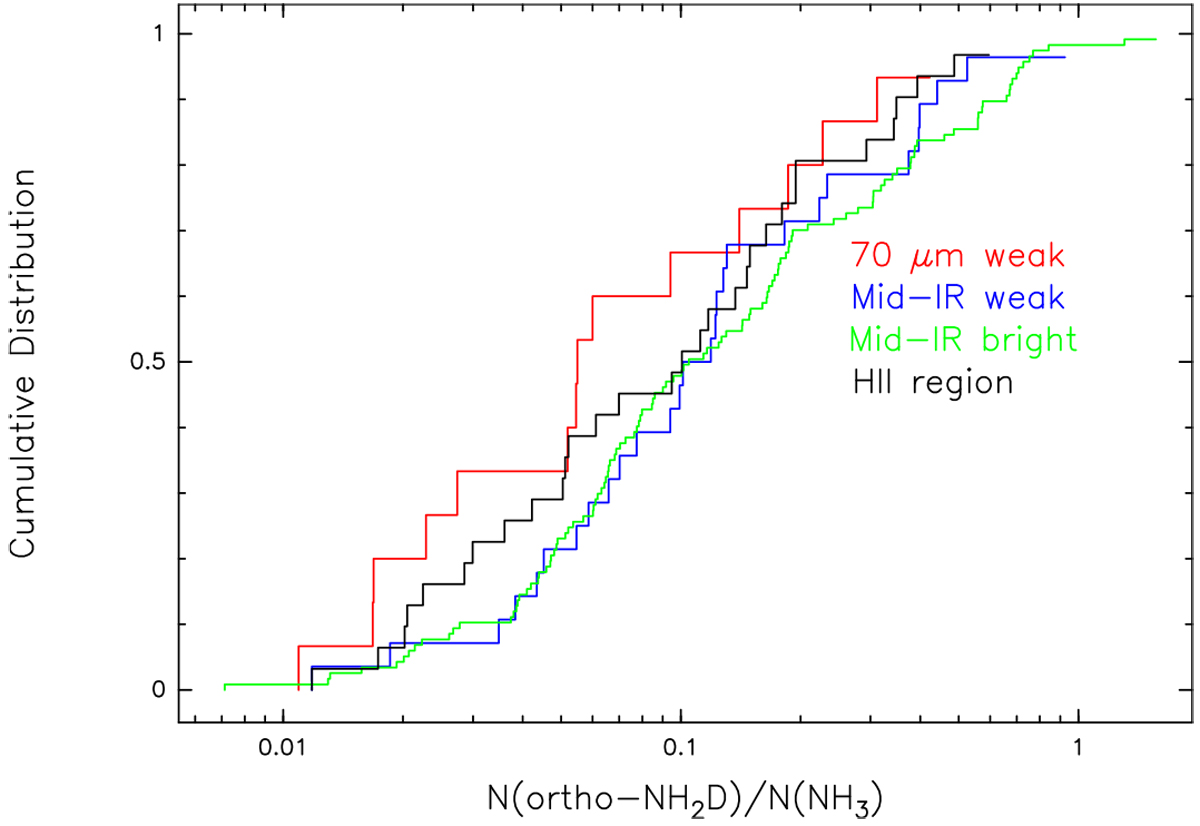
Cumulative distribution functions display [NH2D]/[NH3] ratios for thesubsamples in Table 8. The distribution of 70 μm-weak sources is marked as a solid red line, the MIR-weak clumps are shown as a dashed blue curve, the MIR-bright phase as a dotted green line, and the compact HII regions as a dashed-dotted black curve. A deuterium fraction of NH3 > 1 might result from passing through several dense and cold phases (see Sect. 4.2). A systematic error of the NH3 deuteration is given by the difference between the NH3 and NH2D excitation temperature.
Current usage metrics show cumulative count of Article Views (full-text article views including HTML views, PDF and ePub downloads, according to the available data) and Abstracts Views on Vision4Press platform.
Data correspond to usage on the plateform after 2015. The current usage metrics is available 48-96 hours after online publication and is updated daily on week days.
Initial download of the metrics may take a while.