Open Access
Fig. 2
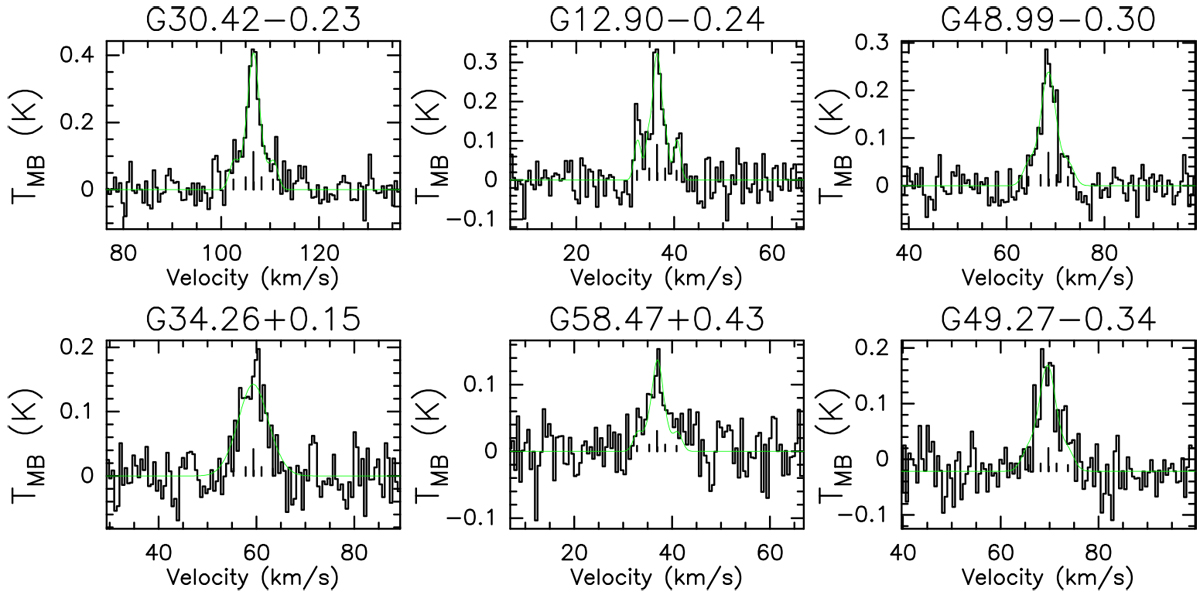
Examples of reduced and calibrated spectra of observed NH2D lines at 110 GHz; the fit is indicated in green. Frequencies of the hyperfine structure components are labelled.
Current usage metrics show cumulative count of Article Views (full-text article views including HTML views, PDF and ePub downloads, according to the available data) and Abstracts Views on Vision4Press platform.
Data correspond to usage on the plateform after 2015. The current usage metrics is available 48-96 hours after online publication and is updated daily on week days.
Initial download of the metrics may take a while.