Open Access
Fig. B.1
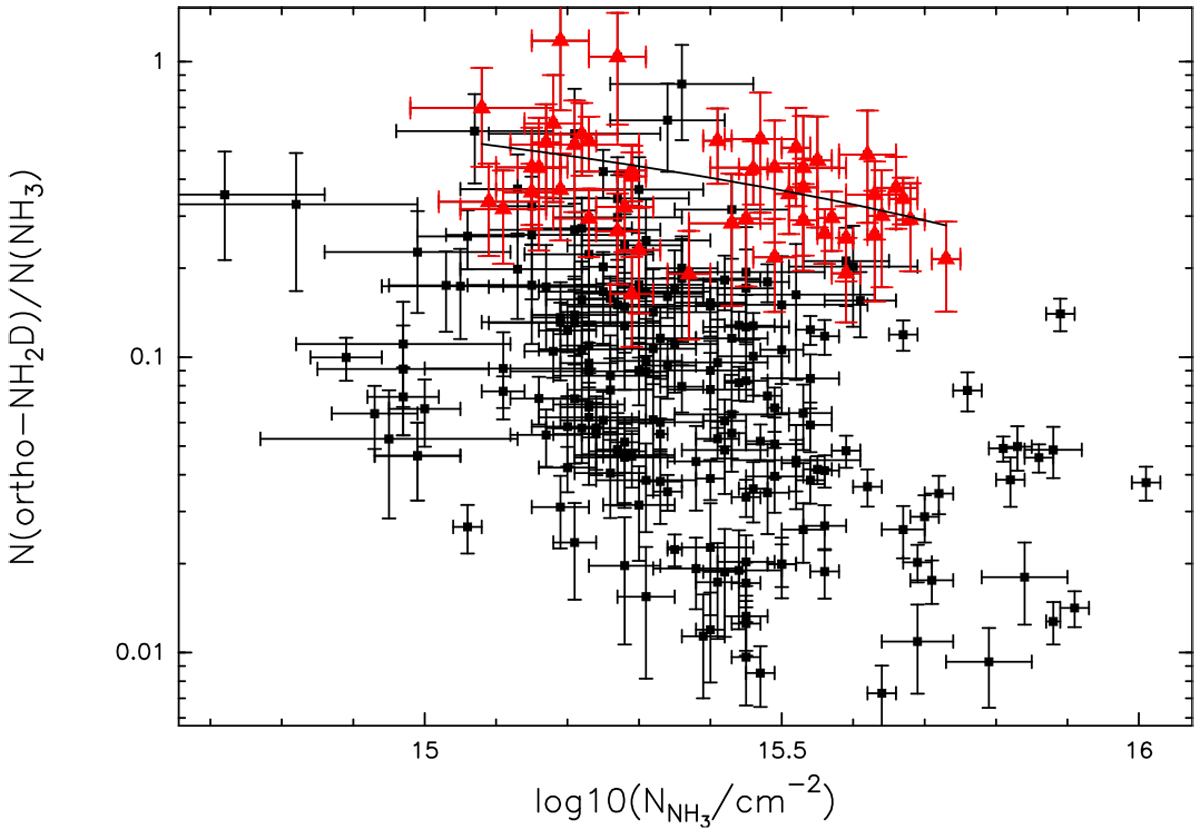
Dependence of NH3 deuteration on NH3 column density. A linear fit is illustrated by the straight line. ATLASGAL clumps without detected hyperfine structure in NH2D are illustrated as black points and sources with detected hyperfine structure as red triangles.
Current usage metrics show cumulative count of Article Views (full-text article views including HTML views, PDF and ePub downloads, according to the available data) and Abstracts Views on Vision4Press platform.
Data correspond to usage on the plateform after 2015. The current usage metrics is available 48-96 hours after online publication and is updated daily on week days.
Initial download of the metrics may take a while.