Fig. 5
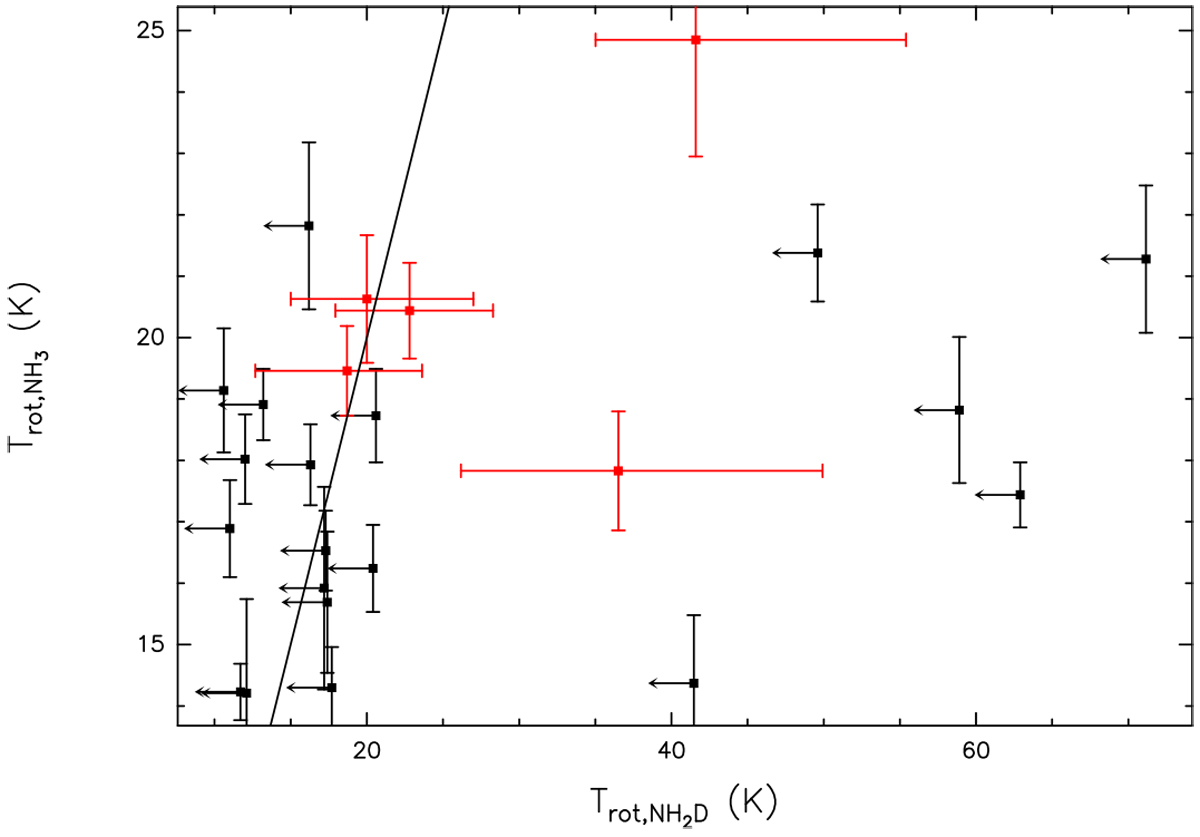
Observed NH3 rotational temperature between the (1,1) and (2,2) inversion transition is shown against modelled NH2D rotational temperature between the 111–101 line at 110 GHz and the 212–202 transition at74 GHz. Sources with a detected 74 GHz line are marked in red, and non-detections with an upper limit of the NH2D temperatureare labelled as black arrows. The straight line corresponds to equal temperatures.
Current usage metrics show cumulative count of Article Views (full-text article views including HTML views, PDF and ePub downloads, according to the available data) and Abstracts Views on Vision4Press platform.
Data correspond to usage on the plateform after 2015. The current usage metrics is available 48-96 hours after online publication and is updated daily on week days.
Initial download of the metrics may take a while.