| Issue |
A&A
Volume 648, April 2021
|
|
|---|---|---|
| Article Number | A65 | |
| Number of page(s) | 12 | |
| Section | Galactic structure, stellar clusters and populations | |
| DOI | https://doi.org/10.1051/0004-6361/202040008 | |
| Published online | 13 April 2021 | |
Mapping the core of the Tarantula Nebula with VLT-MUSE
II. The spectroscopic Hertzsprung-Russell diagram of OB stars in NGC 2070⋆,⋆⋆
1
Leibniz-Institut für Astrophysik Potsdam (AIP), An der Sternwarte 16, 14482 Potsdam, Germany
e-mail: This email address is being protected from spambots. You need JavaScript enabled to view it.
2
Department of Physics & Astronomy, University of Sheffield, Hounsfield Road, Sheffield S3 7RH, UK
3
UK Astronomy Technology Centre, Royal Observatory, Blackford Hill, Edinburgh EH9 3HJ, UK
4
Armagh Observatory and Planetarium, College Hill, Armagh BT61 9DG Northern Ireland, UK
5
LMU München, Universitätssternwarte Scheinerstr. 1, 81679 München, Germany
6
Instituto de Astrofísica de Canarias, La Laguna, Tenerife, Spain
7
Departamento de Astrofísica, Universidad de La Laguna, Tenerife, Spain
8
Centro de Astrobiología CSIC-INTA, Crtra. de Torrejón a Ajalvir km 4, 28850 Torrejón de Ardoz, Madrid, Spain
9
European Southern Observatory, Alonso de Cordova 3107, Vitacura, Casilla 7630355, Santiago, Chile
Received:
27
November
2020
Accepted:
27
January
2021
Abstract
We present the spectroscopic analysis of 333 OB-type stars extracted from VLT-MUSE observations of the central 30 × 30 pc of NGC 2070 in the Tarantula Nebula on the Large Magellanic Cloud, the majority of which are analysed for the first time. The distribution of stars in the spectroscopic Hertzsprung-Russell diagram (sHRD) shows 281 stars in the main sequence. We find two groups in the main sequence, with estimated ages of 2.1 ± 0.8 and 6.2 ± 2 Myr. A subgroup of 52 stars is apparently beyond the main sequence phase, which we consider to be due to emission-type objects and/or significant nebular contamination affecting the analysis. As in previous studies, stellar masses derived from the sHRD are systematically larger than those obtained from the conventional HRD, with the differences being largest for the most massive stars. Additionally, we do not find any trend between the estimated projected rotational velocity and evolution in the sHRD. The projected rotational velocity distribution presents a tail of fast rotators that resembles findings in the wider population of 30 Doradus. We use published spectral types to calibrate the He Iλ4921/He IIλ5411 equivalent-width ratio as a classification diagnostic for early-type main sequence stars when the classical blue-visible region is not observed. Our model-atmosphere analyses demonstrate that the resulting calibration is well correlated with effective temperature.
Key words: stars: early-type / stars: fundamental parameters / galaxies: star clusters: individual: NGC 2070 / Magellanic Clouds
Table 2 is only available at the CDS via anonymous ftp to cdsarc.u-strasbg.fr (130.79.128.5) or via http://cdsarc.u-strasbg.fr/viz-bin/cat/J/A+A/648/A65
Based on observations made with ESO telescopes at the Paranal observatory under programme ID 60.A-9351(A).
© ESO 2021
1. Introduction
Massive stars are thought to drive the chemical and dynamical evolution of galaxies (Ceverino & Klypin 2009; Kennicutt & Evans 2012). They are also thought to be strong candidates for the re-ionisation of the early Universe (e.g., Robertson et al. 2010). However, the formation and evolution of stars more massive than 10 M⊙ still hold many unanswered questions (Langer 2012). These uncertainties quickly grow as we move up to higher masses in the Hertzsprung-Russell diagram (HRD), particularly for the most massive stars (with M > 100 M⊙) and beyond the hydrogen core-burning phase (Vink et al. 2015).
The HRD is a powerful tool for investigating the evolution of massive stars, particularly the influence that factors such as mass, rotation, metallicity, magnetic fields, and binarity have on their main sequence lifetimes, later evolutionary phases, and ultimate fates (e.g., Shu & Lubow 1981; Maeder 1987; Maeder & Meynet 2000; de Mink et al. 2014). Disentangling the respective roles of these factors to chart the various evolutionary paths requires homogeneous, statistically robust studies of the physical properties of populations of massive stars.
Historically, photometric studies were the sole route for investigating large stellar samples (e.g., Fitzpatrick & Garmany 1990; Massey 2002), but the degeneracy of the optical colours to derive the effective temperatures (Teff) of OB-type stars (Hummer et al. 1988) from such an approach limits any insight into stellar evolution (Larsen et al. 2011). More recently, spectroscopic surveys have transformed the field, enabling observations of large samples for a detailed quantitative study in the Milky Way (e.g., Simón-Díaz et al. 2017; Martins et al. 2017), the Magellanic Clouds (e.g., Evans et al. 2004, 2011; Massey et al. 2004; Ramachandran et al. 2018, 2019; Dufton et al. 2019), and in nearby star-forming galaxies in the Local Group (e.g., Urbaneja et al. 2003; Castro et al. 2012).
Based on this wealth of spectroscopic data, the spectroscopic HRD (sHRD; ℒ ≡  ; Langer & Kudritzki 2014) can provide insights into stellar evolution (see also Castro et al. 2014). The sHRD, which is the inverse of the flux-weighted gravity introduced by Kudritzki et al. (2003), does not require knowledge of the extinction or distance to the targets and can be calculated from the stellar analyses. In contrast to the classical Kiel diagram (Teff − log g), the sHRD sorts stars according to their proximity to the Eddington limit. Castro et al. (2014, 2018a) proposed empirical anchors for the stellar evolution of massive stars in the Milky Way and the Small Magellanic Cloud (SMC) based on the sHRD, such as the position of the zero age main sequence (ZAMS) and the terminal age main sequence (TAMS). These provide robust targets for theories of massive-star evolution, including constraints on parameters such as rotation, convective overshooting, and metallicity (Brott et al. 2011; Ekström et al. 2012; Sanyal et al. 2017; Higgins & Vink 2019). In this study, we extend this approach to the massive-star population of the Large Magellanic Cloud (LMC), which has an intermediate metallicity (Z/Z⊙ = 0.5) between that of the Milky Way and the SMC.
Although conceptually designed as a cosmology machine, the Multi-Unit Spectroscopic Explorer (MUSE; Bacon et al. 2014) on the Very Large Telescope (VLT) presents exciting capabilities for the spectroscopy of stellar populations (see the review by Roth et al. 2019) and a leap forward from pioneering studies based on 3D spectroscopy (e.g., Kamann et al. 2013). This unique integral field spectrograph with a large field-of-view (1′ × 1′), excellent image quality, and high efficiency enables a novel approach to studying populations of massive stars, somewhere in between traditional photometric and multi-object spectroscopic surveys. MUSE also overcomes selection biases caused by extinction. Internal extinction may be significant within star-forming galaxies, and O stars may be missed in surveys where targets were selected based on optical colours only (e.g., Garcia et al. 2019). MUSE capabilities in the analysis of young stellar populations have been explored in recent years in nearby clusters (e.g., Weilbacher et al. 2015; Zeidler et al. 2018), the Magellanic Clouds (e.g., McLeod et al. 2019; Bodensteiner et al. 2020), and, even farther away in galaxies outside the Local Group (e.g., NGC 300 and Leo P; Roth et al. 2018; Evans et al. 2019).
The Tarantula Nebula in the LMC is the most luminous star-forming complex in the Local Group (Kennicutt 1984; Crowther 2019). The inner part of the Tarantula, NGC 2070, hosts a well-known rich population of OB-type and Wolf-Rayet (W-R) stars (e.g., Melnick 1985; Selman et al. 1999; Evans et al. 2011). Moreover, in the core of NGC 2070 lies the young massive cluster R136, home to the most massive stars known to date (Crowther et al. 2010; Bestenlehner et al. 2020).
To test the unique capabilities of MUSE, NGC 2070 was observed as part of its Science Verification (SV) programme. The SV observations have provided the most complete spectroscopic census of the region to date (Castro et al. 2018b, hereafter Paper I). Here we apply a similar approach to that of Castro et al. (2014, 2018a) to the MUSE data to investigate massive-star evolution at the metallicity of the LMC (and notably in a young region that is still undergoing active star formation). A big advantage of NGC 2070 compared to the samples in the Milky Way and the SMC (Castro et al. 2014, 2018a) is that it is a more homogeneous population in terms of age, facilitating the study of the properties of the most massive stars. Large and homogeneous studies are crucial to reducing the biases outlined by Castro et al. (2014) and providing reliable empirical boundaries for theoretical models of stellar evolution.
This article is structured as follows. Section 2 briefly introduces the data and the sample for quantitative analysis. Section 3 describes the methods used to estimate physical parameters and to classify the spectra. Section 4 introduces the sHRD for NGC 2070, and Sect. 5 discusses the ages, masses, and rotation rates of the sample. We summarise our findings in Sect. 6.
2. Data and sample selection
The central 2′ × 2′ of NGC 2070 was observed with a mosaic of four MUSE pointings as part of the SV programme in August 2014. The data were obtained with the natural seeing mode (with spatial sampling of  on the sky) and using the extended wavelength coverage, providing spectra over 4595−9365 Å, at a resolving power of R ∼ 3000 around Hα.
The observations, data reduction, and a comprehensive catalogue of early-type stars in the MUSE mosaic were presented in Paper I. For the quantitative analysis presented here, we used spectra extracted from the 4 × 600 s exposures and limited our census to OB-type spectra with signal-to-noise ratios (S/N) greater than 50. This enabled a robust study of their physical properties from comparison with synthetic spectra from model atmospheres.
We excluded stars with Teff < 10 000 K as well as W-R stars (and related stars) with He IIλ5411 in emission. Such objects are not covered by our current grid of models (see Sect. 3) and will be analysed in the future with the appropriate tools. In total, we considered 333 OB-type spectra with S/N > 50. Their spatial distribution in the MUSE mosaic is shown in Fig. 1, and their positions are listed in Table 2 (available at the CDS).
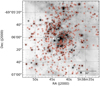 |
Fig. 1. Spatial distribution of the sample stars (open red circles) overlaid on the continuum-integrated 2′ × 2 ′ MUSE mosaic in NGC 2070 (see Paper I). The core of the cluster, R136, is marked. |
Each spectrum was visually examined to discard composite spectra due to project or unresolved stars or binaries. Nevertheless, unresolved components contributing to the spectra must be kept in mind in the conclusions. The R136 cluster at the core of NGC 2070 is unresolved and is not included in this study (Fig. 1). A parallel project using the narrow-field mode (Leibundgut et al. 2019) of MUSE to study R136 with superior spatial resolution is ongoing.
3. Spectral analysis
The MUSE wavelength range does not include the traditional diagnostic features (e.g., He Iλ4471, He IIλ4542, and Si IIIλ4552) used in the spectral classification and quantitative analysis of OB-type stars (e.g., Walborn & Fitzpatrick 1990). Nevertheless, the MUSE range includes lines from both He I (λλ4713, 4921, 5876, 6678) and He II (λλ5411, 6683), which can be used to constrain stellar parameters (Crowther et al. 2017 and Paper I). Both Hα and Hβ are included in the MUSE spectra, but in a region as young as NGC 2070, these are generally contaminated by strong nebular emission from the surrounding excited gas.
Our sample was analysed using a grid of hydrogen and helium (HHe) FASTWIND models (Santolaya-Rey et al. 1997; Puls et al. 2005; Rivero González et al. 2012). FASTWIND calculates the atmosphere and line formation in spherical symmetry, with an explicit treatment of the stellar wind and taking into account non-local thermodynamic equilibrium. The analysis used a grid similar to the one described by Castro et al. (2018a) but now calculated with the LMC metallicity (i.e. Z/Z⊙ = 0.5). The grid temperatures and gravities range from 9000 < Teff < 67 000 K (in steps of 1000 K) and 0.8 < log g < 5.0 dex (in steps of 0.1 dex). The grid was built with a low wind strength parameter, log Q = −14 (Puls et al. 1996, 2000). In the upper part of the HRD, stronger stellar winds are expected to affect lines such as HeII λ4686; however, this line is not included in the analysis. Helium abundances (YHe) were set to 0.09. Castro et al. (2018a) tested different surface helium abundances and concluded that it was not possible to constrain the He abundance with the modest spectral resolution.
The analysis used a similar χ2 algorithm to the one used by Castro et al. (2012, 2018a). The algorithm simultaneously fits the available He lines and, where possible, the wings of the Hβ profile for each star and searches for the set of parameters that best reproduces the observations (see also Urbaneja et al. 2005; Evans et al. 2007). Hβ is included to try to constrain the surface gravity, but we note that it is influenced in many instances by the strong nebular contribution and/or strong stellar wings for the most massive stars (Castro et al. 2018a). Comparisons with previous studies in the LMC (see Sect. 3.1) reinforce the fact that the reader should be cautious of the quoted gravities, but they serve as a first estimate to investigate the overall sHRD of the region.
Projected rotational velocities (v sin i) were estimated by fitting the He lines with the FASTWIND model from the first iteration of the fitting algorithm, where the model is broadened assuming only contributions from stellar rotation and the instrumental resolution. The atmospheric analysis was then repeated with the new v sin i estimate until convergence. Macroturbulence is expected to be an important additional broadening factor in some stars in the upper part of the sHRD (see Grassitelli et al. 2016; Simón-Díaz et al. 2017). However, given the limitations of the modest spectral resolution, we do not include this in our analysis, with the result that some of the quoted v sin i values may be overestimated.
The ionisation balance of He II/He I is used to estimate Teff for spectra where both species are available. However, in the earliest O-type stars, we lack suitable He I lines, and He II is absent for all but the earliest B-types. For these parts of the sample, our analysis rests on the accuracy of the HHe models, and some degeneracy is to be expected (and is indirectly included in the estimated errors from the algorithm; see Sect. 3 of Castro et al. 2018a). Nebular contamination in the helium lines may be expected after the sky subtraction, also affecting the effective temperatures derived in our analysis. The accuracy of the temperatures from our pure HHe analysis is discussed in the next sections (see also the discussion in Castro et al. 2018a). The parameters derived from this work are summarised in Table 2.
3.1. Comparisons with VLT-FLAMES Tarantula Survey
We cross-matched our sample with stars observed as part of the VLT-FLAMES Tarantula Survey (VFTS; Evans et al. 2011). Excluding stars with log Teff [K] < 4.3 from our analysis (identified as possible emission-line stars with unreliable temperatures from our approach; see Sect. 4.2), there are 42 stars in common.
Table 1 compares our results with those obtained from the relevant VFTS studies (Sabín-Sanjulián et al. 2014, 2017; McEvoy et al. 2015; Ramírez-Agudelo et al. 2017; Garland et al. 2017; Schneider et al. 2018a). The VFTS stellar parameters were also determined using standard techniques and the FASTWIND stellar atmosphere code1. Within the uncertainties, there is reasonably good agreement between the estimated temperatures (Fig. 2), albeit with some significant outliers at the highest values. We find a good match, with some outliers, between the luminosities estimated in this work (see Sect. 5.2) and VFTS results as well.
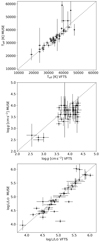 |
Fig. 2. Estimated effective temperatures (Teff, top panel), gravities (log g, middle panel), and luminosities (log L/L⊙, bottom panel) from the MUSE data compared with results from the VFTS for the 42 stars in common (Sabín-Sanjulián et al. 2014, 2017; McEvoy et al. 2015; Ramírez-Agudelo et al. 2017; Garland et al. 2017; Schneider et al. 2018a). |
Estimated effective temperatures, surface gravities, and luminosities from MUSE (cf. published values from the VFTS).
However, there is a large scatter between the estimated surface gravities (Fig. 2), with the MUSE estimates systematically ∼0.3 dex lower than those from the VFTS results. This spread in estimated gravities is not unexpected given the limited diagnostics available and the strong contamination by nebular emission. Figure 3 compares the spectra of three stars whose MUSE and VFTS analyses differ significantly and which have strong nebular contamination. MUSE 1297 (VFTS 493) shows a remarkably large discrepancy in the gravity (∼1 dex, Table 1) compared to previous VFTS analyses. However, our algorithm also provides large errors, highlighting the limitations of modelling this O8−9 dwarf. An over-normalisation of the Hβ continuum, due to the spectral resolution and strong nebular contamination, could be behind the discrepancy. We analysed the three VFTS stars in Fig. 3 using the grid described in this work and the blue wavelengths available in the VFTS spectra, that is, including the ∼4000 − 5000 Å region not covered by MUSE. We got larger gravities, drastically reducing the large differences in these three stars (see Table 1) by ∼0.4 dex. Additional spectroscopic anchors observed both at MUSE and at bluer optical wavelengths are critical for better constraining the gravity and reducing the errors. This should be borne in mind during the discussion of the sHRD (Sect. 4) and the mass discrepancies discussed in Sect. 5.2.
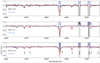 |
Fig. 3. Comparison between three stars analysed in this work (solid black line) and in the VFTS project (solid blue line) whose derived gravities differ significantly between studies. The best FASTWIND model obtained in the MUSE analysis is shown (solid red lines). Wavelengths expected to be strongly affected by nebular contamination are marked in grey. |
3.2. Spectral classification of MUSE spectra
We used a sample of stars available in both the MUSE data and the VFTS to investigate the use of the He Iλ4921 and He IIλ5411 lines for spectral classification. If these are seen to compare well with the classical criteria at shorter wavelengths, they could enable the classification of massive stars observed in other MUSE programmes (see also Bodensteiner et al. 2020).
Given the resolution of the MUSE data, we approached these measured equivalent widths (rather than line-intensity ratios) by comparing them to the spectral classifications from the VFTS (Walborn et al. 2014; Evans et al. 2015). The relationship between equivalent width and spectral type is luminosity-class-dependent. The sample is mainly populated by luminosity class V, and only these stars were used in the calibration. A relatively tight relationship was found, as shown in Fig. 4, with a linear fit given by: SpT = 3.31 [log(He I/He II)] + 8.762. The typical uncertainty for a given equivalent-width ratio is of the order of ±1 subtype, which is usually sufficient for the sort of exploratory studies undertaken with MUSE. We find a similar trend to that reported by Kerton et al. (1999) for Galactic O stars. In particular, their results over the range −1 < [log(He I/He II)] < 1 are a reasonable match to our LMC stars.
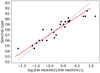 |
Fig. 4. Spectral type calibration (solid red line) from fitting the He Iλ4921/He IIλ5411 equivalent-width ratio of the stars observed with MUSE that were classified from VFTS data (Walborn et al. 2014; Evans et al. 2015). The calibration from Kerton et al. (1999), based on the same He Iλ4921/He IIλ5411 ratio for Galactic O stars, is also shown (dashed grey line). |
We measured the He I/He II ratio of the full MUSE sample and used these to estimate spectral types, as listed in Table 2. Figure 5 compares the Teff estimates with the classifications obtained from the He I/He II ratio (again excluding those with log Teff [K] < 4.3; see Sect. 4.2). The trend between the estimated surface gravities and spectral types suggests a dependence on luminosity class (see Simón-Díaz et al. 2014). However, our calibration (and that from Kerton et al. 1999) is based on dwarf (luminosity class V) stars, so we are unable to investigate luminosity effects at this point (see Fig. 4). Not unexpectedly, the largest discrepancies with the linear trend are found at the extremes of the distribution where the diagnostic lines become very weak or absent (i.e. He IIλ4921 at the earliest O-types, and He IIλ5411 for B0 and later).
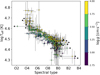 |
Fig. 5. Estimated effective temperatures (Teff) of the MUSE stars versus their spectral types from the calibration in Fig. 4. For clarity, the stars have been artificially distributed into (continuous) spectral types to avoid significant overlap. The distribution is colour-coded by surface gravity (see Table 2). |
4. Evolutionary status of NGC 2070
The sHRD for the MUSE sample is shown in Fig. 6 and can be described by two groups. The largest fraction (281 of 333 stars) is located in the region of the main sequence predicted by the evolutionary models, accounting for the effects of rotation from Köhler et al. (2015). There are two distinctive populations in the main sequence, as highlighted by the right-hand panel of Fig. 6, which shows the summed probability distributions from the analysis of each star along the entire FASTWIND grid (see Castro et al. 2018a). The remaining 52 stars appear to lie beyond the theoretical TAMS at log Teff [K] < 4.3 from Köhler et al. (2015).
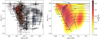 |
Fig. 6. Spectroscopic HRD (sHRD, ℒ ≡ |

4.1. Main-sequence stars
Figure 6 suggests two subgroups within the main sequence sample, which may reflect different bursts of star-formation in the region (e.g., Cignoni et al. 2015, and also Sect. 5.1). He IIλ5411 is clearly seen in 147 stars (see Fig. 7), with the distribution of estimated temperatures peaking at log Teff [K] ∼ 4.55. Only a few stars are found with log Teff [K] > 4.6, closer to the theoretical ZAMS. The distribution of these very hot stars matches the expected position of merger candidates (Schneider et al. 2016) and/or binary evolution products (Wang et al. 2020). However, these stars also have large uncertainties in their parameters as they are constrained only by He II and Hβ and the non-detection of He I lines.
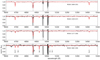 |
Fig. 7. Examples of model fits to four O-type main sequence stars. Areas strongly affected by nebular contamination are marked in grey. Spectral types based on He Iλ4921 and He IIλ5411 equivalent widths are also included (see Sect. 3.2). As expected, the He Iλ4921 line increases as we move towards later spectral types, while the He IIλ5411 decreases, thus supporting our algorithm for spectral classification. |
Given that star formation is still underway in NGC 2070 (Walborn et al. 1999, 2013), we would have expected to find a larger population close to the expected ZAMS. The lack of massive (> 30 M⊙) O-type stars close to the ZAMS has previously been noted in the Milky Way (Castro et al. 2014; Holgado et al. 2018, 2020) and in the SMC (Lamb et al. 2013; Castro et al. 2018a). It was suggested that very young stars may still be embedded in their natal clouds and thus not accessible for optical observations. However, Kennicutt (1984) has shown that the embedded phase is expected to be relatively short (10% of the typical ∼5 Myr lifetime). Yorke (1986) claimed that the pre-main sequence contraction timescale becomes shorter than the accretion timescale for the highest-mass stars; in this scenario, the most massive stars would ignite hydrogen while still accreting. Moreover, the current sample does not include He IIλ5411 emission stars, and the R136 stellar cluster is not resolved and so is missing from this analysis. R136 cluster stars (Bestenlehner et al. 2020) and He IIλ5411 emission-line stars must be quantified before further conclusions can be reached regarding the small number of the most massive stars near the ZAMS (see also Crowther et al. 2016).
Further down the main sequence, we find 134 late O-type and early B-type stars with typical temperatures of log Teff [K] ∼ 4.5. Example spectra and their model fits are shown in Fig. 8, in which the He I lines dominate the spectrum; weak He IIλ4686 absorption in a couple of cases indicates that they are on the cusp of the O-B transition at the very earliest B-types. These stars are still too young to have reached the TAMS and cannot serve as reliable anchors such as those proposed in the Milky Way (Castro et al. 2014) and the SMC (Castro et al. 2018a).
The region of the sHRD in Fig. 6 where we would expect to find B-type supergiants (log Teff [K] ∼ 4.1, log ℒ/ℒ⊙ > 4.0) includes several stars, matching the extended main sequence predicted by Köhler et al. (2015). The extension of the empirical TAMS in the upper part of the sHRD suggests a possible envelope inflation scenario (see Sanyal et al. 2015, 2017). However, given the young age of NGC 2070, the sample of presumed supergiants in the MUSE data is too small to provide robust tests of these predictions. We add that our results place these stars at the edge of the model grid, and as such additional analysis is warranted.
4.2. Stars apparently beyond the theoretical TAMS
We find 52 stars (including the B-type supergiants) with log Teff [K] < 4.3, thus placing them beyond the TAMS predicted by the models of Köhler et al. (2015). The spectra of four examples of this group are shown in Fig. 9. Once stars start burning He in their cores, theoretical evolutionary tracks predict a rapid evolution until they expand and cool to reach the red supergiant (RSG) phase. The position of these objects between the main sequence and the RSG phase is therefore puzzling and not in agreement with the expected evolution of a single star, unless they are blue-loop objects in a post-RSG phase (e.g., Schootemeijer et al. 2019).
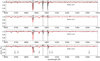 |
Fig. 9. Examples of model fits to four stars apparently beyond the TAMS from the model-atmosphere analysis but which we suspect are emission-line objects and/or contaminated by significant nebular emission (regions marked in grey), such that the estimated temperatures are unreliable (see Sect. 4.2 and Castro et al. 2018a). |
The sHRD for the Milky Way from Castro et al. (2014) also found stars in this range (log Teff [K] ≈ 4.1), with Castro et al. (2018a) finding that most of these objects were emission-line stars (see Fig. 8 in Castro et al. 2018a). The potential contribution from circumstellar material is not taken into account in the atmospheric analysis, which may be influencing the results (e.g., via dilution; Cowley et al. 2015).
The examples in Fig. 9 display emission in Hβ, although [O III] emission is also seen, suggesting that the Hβ emission is, at least in part, due to nebular contamination. In contrast to the Castro et al. (2018a) study, here we cannot disentangle nebular contamination from any other contribution in the Hβ and Hα emission lines. We also note that two objects in Fig. 9 show weak He IIλ4686 absorption, which is indicative of substantially higher temperatures than our estimates and confirms our suspicions regarding the reliability of the temperatures (although there is no corresponding He IIλ5411 absorption in either). Therefore, these stars are not considered in the following discussion nor in Table 2 and will require further studies to shed light on their nature and properties.
5. Discussion
5.1. Age bi-modal distribution
The two well-populated parts of the main sequence in the sHRD (Fig. 6) suggest two different stages of star formation in the recent history of NGC 2070. Effective temperatures and gravities, resulting from the spectral atmosphere analyses, were compared to the LMC evolutionary tracks from Köhler et al. (2015). Masses and ages were calculated by interpolating the tracks from Köhler et al. (2015) at each target’s sHRD location as marked by our results for effective temperatures and gravities, using SciPy libraries3. Ages are shown in the left-hand panel of Fig. 10; stars with estimated parameters outside the evolutionary tracks were not considered further at this point. We found an average age for the O-type main sequence stars of 2.1 ± 0.8 Myr. The cooler group of main sequence stars (centred on log Teff [K] ∼ 4.5) have an average age of 6.2 ± 2 Myr. These results are in broad agreement with other age estimates for NGC 2070 (Walborn & Blades 1997; de Koter et al. 1998; Sabbi et al. 2012; Crowther et al. 2016; Schneider et al. 2018b). Gravity uncertainties may affect the ages extracted from the sHRD. We tested increasing the gravities by 0.3 dex (see Sect. 3.1), finding a similar distribution in agreement, within the errors, with the bi-modal age distribution presented in Fig. 10. As shown in the right-hand panel of Fig. 10, the younger stars are more clustered around R136. However, there is no clear age segregation in NGC 2070. Older ages seem to be placed in the outskirts of the cluster; however, the number of analysed stars in these regions is lower than in the core (Fig. 1), which may be the result of a statistical bias.
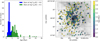 |
Fig. 10. Distribution of inferred ages from the location of stars (log Teff [K] > 4.3) in the sHRD and the evolutionary tracks from Köhler et al. (2015; left panel). The two main sequence groups highlighted in Sect. 4.1 are shown in different colours. Right: spatial distribution of the sample, in which each hexabin shows the mean age value of all stars within it. |
5.2. Mass discrepancies between the sHRD and HRD
The distribution of the MUSE sample in the HRD is shown in the left-hand panel of Fig. 11. Stellar luminosities were calculated using the relevant photometry provided in Paper I (aside from the 13 stars marked with ‘*’ in Table 2) and adopting a distance to the LMC of 49.9 kpc (Pietrzyński et al. 2013). Flux-calibrated MUSE spectra for each individual star were compared to the respective synthetic FASTWIND spectral energy distributions (SEDs), obtained from the stellar atmosphere analysis and parameters in Table 2. We estimated stellar radii and colour excesses, E(B − V), that provide the best match between the observed and synthetic SEDs. We adopted an extinction law Rv = Av/E(B − V) = 4 (Maíz Apellániz et al. 2014). We find a good qualitative match between HRD and sHRD for the late O-type and early B-type stars in the main sequence, but there are differences for the most massive stars in the upper part of the diagram. Those beyond the TAMS in the sHRD are systematically shifted to lower luminosities and masses in the HRD. Due to the concern regarding the derived temperatures, stars at log Teff [K] < 4.3 are not included in the discussion pending further analyses.
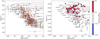 |
Fig. 11. HRD for the MUSE sample with log Teff [K] > 4.3 (left panel). Right: sHRD (ℒ ≡ |

We compared the masses inferred for our stars from their locations in the sHRD and HRD. Masses were estimated according to their positions in both diagrams and the Köhler et al. (2015) LMC evolutionary tracks using SciPy linear interpolation libraries (see Sect. 5.1). Stars out of the parameter space sampled by the evolutionary tracks were not included in this comparison. At the high-mass end (M ≳ 40 M⊙), the masses estimated from the sHRD are significantly larger than the ones from the HRD, as shown in the right-hand panel of Fig. 11. These differences may be linked to the long-standing discrepancy between spectroscopic and evolutionary mass estimates for massive stars (e.g., Herrero et al. 1992; Weidner & Vink 2010; Markova & Puls 2015). A similar result was found from an analysis of the wider 30 Dor population of O-type stars by Sabín-Sanjulián et al. (2017). When using the Kiel diagram (log Teff [K] and log g) to estimate masses of similar stars in the Milky Way, they were also found to be larger than those from the HRD at the high-mass end (Markova et al. 2018). A similar trend was found for the most massive stars in the SMC by Castro et al. (2018a).
The uncertainty in the gravities from the MUSE data (Sect. 3.1) and stellar wind constraints in the grid could have contributed to the mass differences: If the surface gravity is incorrect, simultaneously fitting Teff and gravity can lead to underestimates of Teff (e.g., Schneider et al. 2017). The systematic difference of approximately 0.3 dex found for the stars present in both the VFTS and MUSE data could somewhat alleviate this discrepancy. That said, as similar mass discrepancies are seen in other studies (using different observations, algorithms, atmospheric models, etc.) it seems unlikely that this is simply an artefact of the MUSE analysis. We are now exploring alternative routes to improve the estimates of stellar gravities from MUSE data, such as using absorption lines from the hydrogen Paschen series (Bestenlehner et al., in prep.).
5.3. Rotational velocities
The distribution of estimated v sin i values is shown in the left-hand panel of Fig. 12. There is a peak at approximately 170 km s−1 for the full sample, with no clear qualitative differences for the stars separated into the two age groups in the main sequence. Their overall distribution resembles the Ramírez-Agudelo et al. (2013) results for the O-type stars in 30 Dor rather than the Dufton et al. (2013) bi-modal distribution for lower-mass B-type stars. The peak of the hot O-type star group (log Teff [K] ∼ 4.6) also resembles the rotational velocity distribution found in Cygnus OB2 in the Milky Way by Berlanas et al. (2020). There is a relative dearth of slow rotators in the cooler MUSE group, but we caution that the spectral resolution of MUSE limits us to Δv sin i ∼ 60 km s−1, and as such we are not able to robustly probe the low-velocity end of the distribution. We note that Kamann et al. (2020) have recently measured rotational velocities for a total of 1400 stars of the intermediate age cluster NGC 1846 in the LMC with uncertainties of typically 10 km s−1 using MUSE. A future, more refined analysis may allow us to investigate these results in more detail.
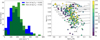 |
Fig. 12. Distribution of projected rotational velocities (v sin i) for the two samples identified in the main sequence (left panel). Right: sHRD (ℒ ≡ |

There appears to be a prolongation in the distribution at v sin i ∼ 370 km s−1 for the hot O-type stars (see Fig. 12), which resembles the high-velocity tail found for apparent single O-type stars in 30 Dor by Ramírez-Agudelo et al. (2013). de Mink et al. (2013) proposed that rapidly rotating stars may originate from binary interactions and mergers (de Mink et al. 2014; Schneider et al. 2016). These stars in the MUSE sample merit further observations to test if these objects are actually single stars as well as to investigate their physical properties in more detail relative to the interaction and merger models. As shown in the right-hand panel of Fig. 12, there do not appear to be strong trends in the v sin i estimates or their location in the sHRD.
6. Summary
Exploiting the unique observational capabilities of MUSE, combined with synthetic spectra calculated with FASTWIND, we have estimated physical parameters for 333 OB-type stars in NGC 2070. The majority of these objects are analysed for the first time here. Our main conclusions can be summarised as follows.
-
281 stars (84% of our sample) are still in the main sequence. They comprise a group of O-type stars with an average age of 2.1 ± 0.8 Myr and a group of late O-type and early B-type stars with an average age of 6.2 ± 2.0 Myr. This spread in ages is consistent with previous studies, and we find no obvious age gradient across NGC 2070.
-
We find a relative dearth of O-type stars close to the theoretical ZAMS between approximately 20 and 50 M⊙. Similar findings were reported in the Milky Way and the SMC (Holgado et al. 2018, 2020; Castro et al. 2018a). Given the young age of NGC 2070, this is somewhat unexpected, although stars in R136 are omitted from our sample. The stellar context of R136 needs to be better quantified before further conclusions can be reached (see Bestenlehner et al. 2020). Moreover, the stars close to the theoretical ZAMS, in the upper part of the sHRD (> 50 M⊙), match the predicted position of stellar mergers (Schneider et al. 2016) and/or binary evolution products (e.g., Wang et al. 2020). However, the temperatures for these stars have large uncertainties, and further studies of their properties are also required.
-
We find 52 stars, the rest of the analysed sample, with temperatures beyond the theoretical TAMS from Köhler et al. (2015) at log Teff [K] < 4.3. In the SMC study by Castro et al. (2018a), a similar group of stars nearly all displayed signatures of Balmer emission. This sub-sample in NGC 2070 could similarly be emission-line stars and/or nebular contamination, where the analysis tools give incorrect results given the limitations of the data and the atmospheric models, but we need further observations to test this suggestion.
-
The HRD and sHRD are in good qualitative agreement for the late O-type and early B-type stars in the main sequence, but there are differences for the more massive O-type stars. Masses estimated from the sHRD compared to the evolutionary tracks are larger than those inferred from the HRD, which becomes severe (a factor of two to three) at M > 40 M⊙. This may be related to the uncertainty in the surface gravities estimated from the MUSE data (Sect. 3.1). However, Sabín-Sanjulián et al. (2017) found similar problems at M > 70 M⊙ in 30 Dor, and a comparable trend was also found by Castro et al. (2018a) in the SMC (from observations of the more classical blue-visible range, albeit still at R ∼ 3000).
-
The projected v sin i distribution for the MUSE sample peaks at 170 km s−1. We find a group of rapidly rotating O-type stars (with 300 < v sin i < 450 km s−1) that resembles the high-velocity tail found for the wider population of O stars in 30 Dor by Ramírez-Agudelo et al. (2013). Comparisons of our results with the bi-modal distribution for the B-type stars from Dufton et al. (2013) are unfortunately limited by the velocity resolution of the MUSE data.
-
We used the He Iλ4921/He IIλ5411 equivalent-width ratio to estimate spectral types for our sample stars, calibrated using a subset of stars that overlap with the VFTS. In general, the effective temperatures estimated from the model-atmosphere fits follow a clear trend of decreasing temperature towards late spectral types.
The next step beyond the current sample is analysis of the W-R and other He II emission-line stars in NGC 2070 to complete the distribution in the sHRD. Additional analyses to improve the quoted surface gravities and overcome the limitations of basing the stellar gravity on Hβ are also desirable. We are exploring the Paschen lines as possible additional constraints for the gravity (Bestenlehner, in prep.). Furthermore, as with the rapidly rotating O-type stars identified by Ramírez-Agudelo et al. (2013), the comparable group from the MUSE data (Fig. 12) are interesting in the context of possible post-interaction or merger products, and multi-epoch spectroscopy of this subgroup would be particularly valuable. As shown by Giesers et al. (2019), multi-epoch MUSE observations are indeed uniquely capable of detecting spectroscopic binaries in star clusters.
Finally, we note that the commissioning of the MUSE Narrow-Field Mode with adaptive optics support has added a new capability for integral field spectroscopy from the ground with angular resolution close to that from the Hubble Space Telescope. We have already secured data for NGC 2070 in this mode and will soon report on results in the most crowded regions of R136 (Castro et al. 2021).
In conclusion, integral field spectroscopy with MUSE has been demonstrated to be a powerful tool for the quantitative spectroscopy of stars in crowded fields. Studies of this kind have only begun to scratch the surface of what is expected to become an indispensable tool, in particular in view of the upcoming generation of extremely large telescopes and the next generation of integral field spectrographs (e.g., the BlueMUSE concept; Richard et al. 2019).
With the exception of the study from Garland et al. (2017), who used TLUSTY model atmospheres (Hubeny & Lanz 1995).
SpT: O2 = 2...O9 = 9, B0 = 10...B9 = 19.
Acknowledgments
The authors thank the referee for useful comments and helpful suggestions that improved this manuscript. NC gratefully acknowledges funding from the Deutsche Forschungsgemeinschaft (DFG) – CA 2551/1-1. SS-D and AHD acknowledge support from the Spanish Government Ministerio de Ciencia e Innovación through grants PGC-2018-091 3741-B-C22 and CEX2019-000920-S, and from the Canarian Agency for Research, Innovation and Information Society (ACIISI), of the Canary Islands Government, and the European Regional Development Fund (ERDF), under grant with reference ProID2020010016. Our research used Astropy, a community-developed core Python package for Astronomy (Astropy Collaboration 2013), and APLpy, an open-source plotting package for Python (Robitaille & Bressert 2012).
References
- Astropy Collaboration (Robitaille, T. P., et al.) 2013, A&A, 558, A33 [NASA ADS] [CrossRef] [EDP Sciences] [Google Scholar]
- Bacon, R., Vernet, J., Borisova, E., et al. 2014, The Messenger, 157, 13 [NASA ADS] [Google Scholar]
- Berlanas, S. R., Herrero, A., Comerón, F., et al. 2020, A&A, 642, A168 [CrossRef] [EDP Sciences] [Google Scholar]
- Bestenlehner, J. M., Crowther, P. A., Caballero-Nieves, S. M., et al. 2020, MNRAS, 499, 1918 [Google Scholar]
- Bodensteiner, J., Sana, H., Mahy, L., et al. 2020, A&A, 634, A51 [NASA ADS] [CrossRef] [EDP Sciences] [Google Scholar]
- Brott, I., de Mink, S. E., Cantiello, M., et al. 2011, A&A, 530, A115 [NASA ADS] [CrossRef] [EDP Sciences] [Google Scholar]
- Castro, N., Urbaneja, M. A., Herrero, A., et al. 2012, A&A, 542, A79 [NASA ADS] [CrossRef] [EDP Sciences] [Google Scholar]
- Castro, N., Fossati, L., Langer, N., et al. 2014, A&A, 570, L13 [NASA ADS] [CrossRef] [EDP Sciences] [Google Scholar]
- Castro, N., Oey, M. S., Fossati, L., & Langer, N. 2018a, ApJ, 868, 57 [Google Scholar]
- Castro, N., Crowther, P. A., Evans, C. J., et al. 2018b, A&A, 614, A147 [NASA ADS] [CrossRef] [EDP Sciences] [Google Scholar]
- Castro, N., Roth, M. M., Weilbacher, P. M., et al. 2021, The Messenger, 182, 50 [Google Scholar]
- Ceverino, D., & Klypin, A. 2009, ApJ, 695, 292 [Google Scholar]
- Cignoni, M., Sabbi, E., van der Marel, R. P., et al. 2015, ApJ, 811, 76 [Google Scholar]
- Cowley, C. R., Przybilla, N., & Hubrig, S. 2015, A&A, 578, A26 [EDP Sciences] [Google Scholar]
- Crowther, P. A. 2019, Galaxies, 7, 88 [CrossRef] [Google Scholar]
- Crowther, P. A., Schnurr, O., Hirschi, R., et al. 2010, MNRAS, 408, 731 [NASA ADS] [CrossRef] [Google Scholar]
- Crowther, P. A., Caballero-Nieves, S. M., Bostroem, K. A., et al. 2016, MNRAS, 458, 624 [NASA ADS] [CrossRef] [Google Scholar]
- Crowther, P. A., Castro, N., Evans, C. J., et al. 2017, The Messenger, 170, 40 [Google Scholar]
- de Koter, A., Heap, S. R., & Hubeny, I. 1998, ApJ, 509, 879 [Google Scholar]
- de Mink, S. E., Langer, N., Izzard, R. G., Sana, H., & de Koter, A. 2013, ApJ, 764, 166 [NASA ADS] [CrossRef] [Google Scholar]
- de Mink, S. E., Sana, H., Langer, N., Izzard, R. G., & Schneider, F. R. N. 2014, ApJ, 782, 7 [NASA ADS] [CrossRef] [Google Scholar]
- Dufton, P. L., Langer, N., Dunstall, P. R., et al. 2013, A&A, 550, A109 [NASA ADS] [CrossRef] [EDP Sciences] [Google Scholar]
- Dufton, P. L., Evans, C. J., Hunter, I., Lennon, D. J., & Schneider, F. R. N. 2019, A&A, 626, A50 [CrossRef] [EDP Sciences] [Google Scholar]
- Ekström, S., Georgy, C., Eggenberger, P., et al. 2012, A&A, 537, A146 [NASA ADS] [CrossRef] [EDP Sciences] [Google Scholar]
- Evans, C. J., Howarth, I. D., Irwin, M. J., Burnley, A. W., & Harries, T. J. 2004, MNRAS, 353, 601 [Google Scholar]
- Evans, C. J., Bresolin, F., Urbaneja, M. A., et al. 2007, ApJ, 659, 1198 [Google Scholar]
- Evans, C. J., Taylor, W. D., Hénault-Brunet, V., et al. 2011, A&A, 530, A108 [NASA ADS] [CrossRef] [EDP Sciences] [Google Scholar]
- Evans, C. J., Kennedy, M. B., Dufton, P. L., et al. 2015, A&A, 574, A13 [NASA ADS] [CrossRef] [EDP Sciences] [Google Scholar]
- Evans, C. J., Castro, N., Gonzalez, O. A., et al. 2019, A&A, 622, A129 [CrossRef] [EDP Sciences] [Google Scholar]
- Fitzpatrick, E. L., & Garmany, C. D. 1990, ApJ, 363, 119 [Google Scholar]
- Garcia, M., Herrero, A., Najarro, F., Camacho, I., & Lorenzo, M. 2019, MNRAS, 484, 422 [Google Scholar]
- Garland, R., Dufton, P. L., Evans, C. J., et al. 2017, A&A, 603, A91 [NASA ADS] [CrossRef] [EDP Sciences] [Google Scholar]
- Giesers, B., Kamann, S., Dreizler, S., et al. 2019, A&A, 632, A3 [NASA ADS] [CrossRef] [EDP Sciences] [Google Scholar]
- Grassitelli, L., Fossati, L., Langer, N., et al. 2016, A&A, 593, A14 [NASA ADS] [CrossRef] [EDP Sciences] [Google Scholar]
- Herrero, A., Kudritzki, R. P., Vilchez, J. M., et al. 1992, A&A, 261, 209 [NASA ADS] [Google Scholar]
- Higgins, E. R., & Vink, J. S. 2019, A&A, 622, A50 [NASA ADS] [CrossRef] [EDP Sciences] [Google Scholar]
- Holgado, G., Simón-Díaz, S., Barbá, R. H., et al. 2018, A&A, 613, A65 [NASA ADS] [CrossRef] [EDP Sciences] [Google Scholar]
- Holgado, G., Simón-Díaz, S., Haemmerlé, L., et al. 2020, A&A, 638, A157 [CrossRef] [EDP Sciences] [Google Scholar]
- Hubeny, I., & Lanz, T. 1995, ApJ, 439, 875 [Google Scholar]
- Hummer, D. G., Abbott, D. C., Voels, S. A., & Bohannan, B. 1988, ApJ, 328, 704 [Google Scholar]
- Kamann, S., Wisotzki, L., & Roth, M. M. 2013, A&A, 549, A71 [NASA ADS] [CrossRef] [EDP Sciences] [Google Scholar]
- Kamann, S., Bastian, N., Gossage, S., et al. 2020, MNRAS, 492, 2177 [Google Scholar]
- Kennicutt, R. C., Jr. 1984, ApJ, 287, 116 [Google Scholar]
- Kennicutt, R. C., & Evans, N. J. 2012, ARA&A, 50, 531 [NASA ADS] [CrossRef] [Google Scholar]
- Kerton, C. R., Ballantyne, D. R., & Martin, P. G. 1999, AJ, 117, 2485 [Google Scholar]
- Köhler, K., Langer, N., de Koter, A., et al. 2015, A&A, 573, A71 [NASA ADS] [CrossRef] [EDP Sciences] [Google Scholar]
- Kudritzki, R. P., Bresolin, F., & Przybilla, N. 2003, ApJ, 582, L83 [Google Scholar]
- Lamb, J. B., Oey, M. S., Graus, A. S., Adams, F. C., & Segura-Cox, D. M. 2013, ApJ, 763, 101 [Google Scholar]
- Langer, N. 2012, ARA&A, 50, 107 [Google Scholar]
- Langer, N., & Kudritzki, R. P. 2014, A&A, 564, A52 [NASA ADS] [CrossRef] [EDP Sciences] [Google Scholar]
- Larsen, S. S., de Mink, S. E., Eldridge, J. J., et al. 2011, A&A, 532, A147 [NASA ADS] [CrossRef] [EDP Sciences] [Google Scholar]
- Leibundgut, B., Bacon, R., Bian, F., et al. 2019, The Messenger, 176, 16 [Google Scholar]
- Maeder, A. 1987, A&A, 178, 159 [NASA ADS] [Google Scholar]
- Maeder, A., & Meynet, G. 2000, ARA&A, 38, 143 [Google Scholar]
- Maíz Apellániz, J., Evans, C. J., Barbá, R. H., et al. 2014, A&A, 564, A63 [NASA ADS] [CrossRef] [EDP Sciences] [Google Scholar]
- Markova, N., & Puls, J. 2015, in New Windows on Massive Stars, eds. G. Meynet, C. Georgy, J. Groh, & P. Stee, IAU Symp., 307, 117 [Google Scholar]
- Markova, N., Puls, J., & Langer, N. 2018, A&A, 613, A12 [NASA ADS] [CrossRef] [EDP Sciences] [Google Scholar]
- Martins, F., Simón-Díaz, S., Barbá, R. H., Gamen, R. C., & Ekström, S. 2017, A&A, 599, A30 [NASA ADS] [CrossRef] [EDP Sciences] [Google Scholar]
- Massey, P. 2002, ApJS, 141, 81 [Google Scholar]
- Massey, P., Bresolin, F., Kudritzki, R. P., Puls, J., & Pauldrach, A. W. A. 2004, ApJ, 608, 1001 [Google Scholar]
- McEvoy, C. M., Dufton, P. L., Evans, C. J., et al. 2015, A&A, 575, A70 [NASA ADS] [CrossRef] [EDP Sciences] [Google Scholar]
- McLeod, A. F., Dale, J. E., Evans, C. J., et al. 2019, MNRAS, 486, 5263 [Google Scholar]
- Melnick, J. 1985, A&A, 153, 235 [NASA ADS] [Google Scholar]
- Pietrzyński, G., Graczyk, D., Gieren, W., et al. 2013, Nature, 495, 76 [NASA ADS] [CrossRef] [PubMed] [Google Scholar]
- Puls, J., Kudritzki, R. P., Herrero, A., et al. 1996, A&A, 305, 171 [Google Scholar]
- Puls, J., Springmann, U., & Lennon, M. 2000, A&AS, 141, 23 [NASA ADS] [CrossRef] [EDP Sciences] [Google Scholar]
- Puls, J., Urbaneja, M. A., Venero, R., et al. 2005, A&A, 435, 669 [NASA ADS] [CrossRef] [EDP Sciences] [Google Scholar]
- Ramachandran, V., Hamann, W. R., Hainich, R., et al. 2018, A&A, 615, A40 [NASA ADS] [CrossRef] [EDP Sciences] [Google Scholar]
- Ramachandran, V., Hamann, W. R., Oskinova, L. M., et al. 2019, A&A, 625, A104 [NASA ADS] [CrossRef] [EDP Sciences] [Google Scholar]
- Ramírez-Agudelo, O. H., Simón-Díaz, S., Sana, H., et al. 2013, A&A, 560, A29 [NASA ADS] [CrossRef] [EDP Sciences] [Google Scholar]
- Ramírez-Agudelo, O. H., Sana, H., de Koter, A., et al. 2017, A&A, 600, A81 [NASA ADS] [CrossRef] [EDP Sciences] [Google Scholar]
- Richard, J., Bacon, R., Blaizot, J., et al. 2019, ArXiv e-prints [arXiv:1906.01657] [Google Scholar]
- Rivero González, J. G., Puls, J., Massey, P., & Najarro, F. 2012, A&A, 543, A95 [NASA ADS] [CrossRef] [EDP Sciences] [Google Scholar]
- Robertson, B. E., Ellis, R. S., Dunlop, J. S., McLure, R. J., & Stark, D. P. 2010, Nature, 468, 49 [Google Scholar]
- Robitaille, T., & Bressert, E. 2012, Astrophysics Source Code Library [record ascl:1208.017] [Google Scholar]
- Roth, M. M., Sandin, C., Kamann, S., et al. 2018, A&A, 618, A3 [NASA ADS] [CrossRef] [EDP Sciences] [Google Scholar]
- Roth, M. M., Weilbacher, P. M., & Castro, N. 2019, Astron. Nachr., 340, 989 [Google Scholar]
- Sabbi, E., Lennon, D. J., Gieles, M., et al. 2012, ApJ, 754, L37 [Google Scholar]
- Sabín-Sanjulián, C., Simón-Díaz, S., Herrero, A., et al. 2014, A&A, 564, A39 [NASA ADS] [CrossRef] [EDP Sciences] [Google Scholar]
- Sabín-Sanjulián, C., Simón-Díaz, S., Herrero, A., et al. 2017, A&A, 601, A79 [NASA ADS] [CrossRef] [EDP Sciences] [Google Scholar]
- Santolaya-Rey, A. E., Puls, J., & Herrero, A. 1997, A&A, 323, 488 [NASA ADS] [Google Scholar]
- Sanyal, D., Grassitelli, L., Langer, N., & Bestenlehner, J. M. 2015, A&A, 580, A20 [NASA ADS] [CrossRef] [EDP Sciences] [Google Scholar]
- Sanyal, D., Langer, N., Szécsi, D., Yoon, S.-C., & Grassitelli, L. 2017, A&A, 597, A71 [NASA ADS] [CrossRef] [EDP Sciences] [Google Scholar]
- Schneider, F. R. N., Podsiadlowski, P., Langer, N., Castro, N., & Fossati, L. 2016, MNRAS, 457, 2355 [Google Scholar]
- Schneider, F. R. N., Castro, N., Fossati, L., Langer, N., & de Koter, A. 2017, A&A, 598, A60 [NASA ADS] [CrossRef] [EDP Sciences] [Google Scholar]
- Schneider, F. R. N., Sana, H., Evans, C. J., et al. 2018a, Science, 359, 69 [Google Scholar]
- Schneider, F. R. N., Ramírez-Agudelo, O. H., Tramper, F., et al. 2018b, A&A, 618, A73 [NASA ADS] [CrossRef] [EDP Sciences] [Google Scholar]
- Schootemeijer, A., Langer, N., Grin, N. J., & Wang, C. 2019, A&A, 625, A132 [NASA ADS] [CrossRef] [EDP Sciences] [Google Scholar]
- Selman, F., Melnick, J., Bosch, G., & Terlevich, R. 1999, A&A, 341, 98 [NASA ADS] [Google Scholar]
- Shu, F. H., & Lubow, S. H. 1981, ARA&A, 19, 277 [Google Scholar]
- Simón-Díaz, S., Herrero, A., Sabín-Sanjulián, C., et al. 2014, A&A, 570, L6 [NASA ADS] [CrossRef] [EDP Sciences] [Google Scholar]
- Simón-Díaz, S., Godart, M., Castro, N., et al. 2017, A&A, 597, A22 [NASA ADS] [CrossRef] [EDP Sciences] [Google Scholar]
- Urbaneja, M. A., Herrero, A., Bresolin, F., et al. 2003, ApJ, 584, L73 [Google Scholar]
- Urbaneja, M. A., Herrero, A., Bresolin, F., et al. 2005, ApJ, 622, 862 [Google Scholar]
- Vink, J. S., Heger, A., Krumholz, M. R., et al. 2015, Highlights Astron., 16, 51 [Google Scholar]
- Walborn, N. R., & Blades, J. C. 1997, ApJS, 112, 457 [Google Scholar]
- Walborn, N. R., & Fitzpatrick, E. L. 1990, PASP, 102, 379 [Google Scholar]
- Walborn, N. R., Barbá, R. H., Brandner, W., et al. 1999, AJ, 117, 225 [Google Scholar]
- Walborn, N. R., Barbá, R. H., & Sewiło, M. M. 2013, AJ, 145, 98 [Google Scholar]
- Walborn, N. R., Sana, H., Simón-Díaz, S., et al. 2014, A&A, 564, A40 [NASA ADS] [CrossRef] [EDP Sciences] [Google Scholar]
- Wang, C., Langer, N., Schootemeijer, A., et al. 2020, ApJ, 888, L12 [Google Scholar]
- Weidner, C., & Vink, J. S. 2010, A&A, 524, A98 [NASA ADS] [CrossRef] [EDP Sciences] [Google Scholar]
- Weilbacher, P. M., Monreal-Ibero, A., Kollatschny, W., et al. 2015, A&A, 582, A114 [NASA ADS] [CrossRef] [EDP Sciences] [Google Scholar]
- Yorke, H. W. 1986, ARA&A, 24, 49 [Google Scholar]
- Zeidler, P., Sabbi, E., Nota, A., et al. 2018, AJ, 156, 211 [Google Scholar]
All Tables
Estimated effective temperatures, surface gravities, and luminosities from MUSE (cf. published values from the VFTS).
All Figures
|
Fig. 1. Spatial distribution of the sample stars (open red circles) overlaid on the continuum-integrated 2′ × 2 ′ MUSE mosaic in NGC 2070 (see Paper I). The core of the cluster, R136, is marked. |
| In the text | |
|
Fig. 2. Estimated effective temperatures (Teff, top panel), gravities (log g, middle panel), and luminosities (log L/L⊙, bottom panel) from the MUSE data compared with results from the VFTS for the 42 stars in common (Sabín-Sanjulián et al. 2014, 2017; McEvoy et al. 2015; Ramírez-Agudelo et al. 2017; Garland et al. 2017; Schneider et al. 2018a). |
| In the text | |
|
Fig. 3. Comparison between three stars analysed in this work (solid black line) and in the VFTS project (solid blue line) whose derived gravities differ significantly between studies. The best FASTWIND model obtained in the MUSE analysis is shown (solid red lines). Wavelengths expected to be strongly affected by nebular contamination are marked in grey. |
| In the text | |
|
Fig. 4. Spectral type calibration (solid red line) from fitting the He Iλ4921/He IIλ5411 equivalent-width ratio of the stars observed with MUSE that were classified from VFTS data (Walborn et al. 2014; Evans et al. 2015). The calibration from Kerton et al. (1999), based on the same He Iλ4921/He IIλ5411 ratio for Galactic O stars, is also shown (dashed grey line). |
| In the text | |
|
Fig. 5. Estimated effective temperatures (Teff) of the MUSE stars versus their spectral types from the calibration in Fig. 4. For clarity, the stars have been artificially distributed into (continuous) spectral types to avoid significant overlap. The distribution is colour-coded by surface gravity (see Table 2). |
| In the text | |
|
Fig. 6. Spectroscopic HRD (sHRD, ℒ ≡ |
| In the text | |
|
Fig. 7. Examples of model fits to four O-type main sequence stars. Areas strongly affected by nebular contamination are marked in grey. Spectral types based on He Iλ4921 and He IIλ5411 equivalent widths are also included (see Sect. 3.2). As expected, the He Iλ4921 line increases as we move towards later spectral types, while the He IIλ5411 decreases, thus supporting our algorithm for spectral classification. |
| In the text | |
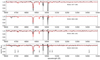 |
Fig. 8. Example of model fits to four early B-type main sequence stars (see Fig. 7). |
| In the text | |
|
Fig. 9. Examples of model fits to four stars apparently beyond the TAMS from the model-atmosphere analysis but which we suspect are emission-line objects and/or contaminated by significant nebular emission (regions marked in grey), such that the estimated temperatures are unreliable (see Sect. 4.2 and Castro et al. 2018a). |
| In the text | |
|
Fig. 10. Distribution of inferred ages from the location of stars (log Teff [K] > 4.3) in the sHRD and the evolutionary tracks from Köhler et al. (2015; left panel). The two main sequence groups highlighted in Sect. 4.1 are shown in different colours. Right: spatial distribution of the sample, in which each hexabin shows the mean age value of all stars within it. |
| In the text | |
|
Fig. 11. HRD for the MUSE sample with log Teff [K] > 4.3 (left panel). Right: sHRD (ℒ ≡ |
| In the text | |
|
Fig. 12. Distribution of projected rotational velocities (v sin i) for the two samples identified in the main sequence (left panel). Right: sHRD (ℒ ≡ |
| In the text | |
Current usage metrics show cumulative count of Article Views (full-text article views including HTML views, PDF and ePub downloads, according to the available data) and Abstracts Views on Vision4Press platform.
Data correspond to usage on the plateform after 2015. The current usage metrics is available 48-96 hours after online publication and is updated daily on week days.
Initial download of the metrics may take a while.