Fig. 12.
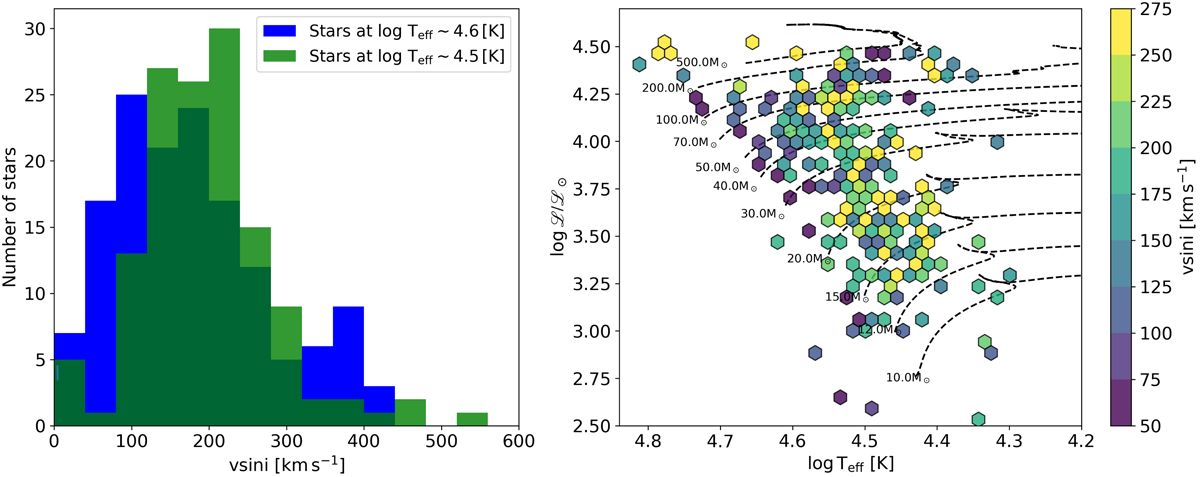
Distribution of projected rotational velocities (v sin i) for the two samples identified in the main sequence (left panel). Right: sHRD (ℒ ≡ ![]() ) for the total sample, with v sin i average in each bin, and overlaid on the rotating evolutionary tracks from Köhler et al. (2015). Each hexabin shows the mean value of all stars within it.
) for the total sample, with v sin i average in each bin, and overlaid on the rotating evolutionary tracks from Köhler et al. (2015). Each hexabin shows the mean value of all stars within it.
Current usage metrics show cumulative count of Article Views (full-text article views including HTML views, PDF and ePub downloads, according to the available data) and Abstracts Views on Vision4Press platform.
Data correspond to usage on the plateform after 2015. The current usage metrics is available 48-96 hours after online publication and is updated daily on week days.
Initial download of the metrics may take a while.