Fig. 10.
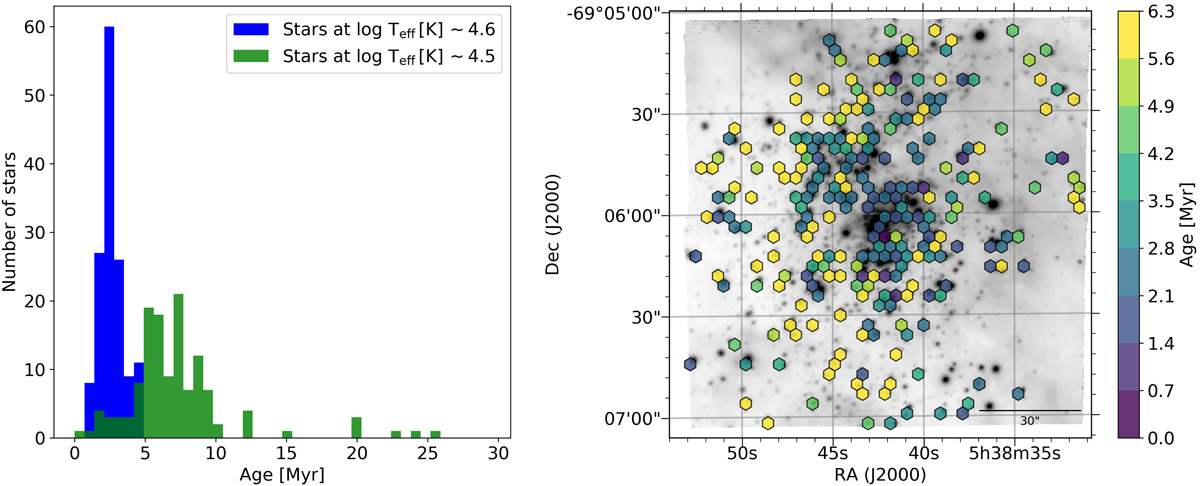
Distribution of inferred ages from the location of stars (log Teff [K] > 4.3) in the sHRD and the evolutionary tracks from Köhler et al. (2015; left panel). The two main sequence groups highlighted in Sect. 4.1 are shown in different colours. Right: spatial distribution of the sample, in which each hexabin shows the mean age value of all stars within it.
Current usage metrics show cumulative count of Article Views (full-text article views including HTML views, PDF and ePub downloads, according to the available data) and Abstracts Views on Vision4Press platform.
Data correspond to usage on the plateform after 2015. The current usage metrics is available 48-96 hours after online publication and is updated daily on week days.
Initial download of the metrics may take a while.