Fig. 3.
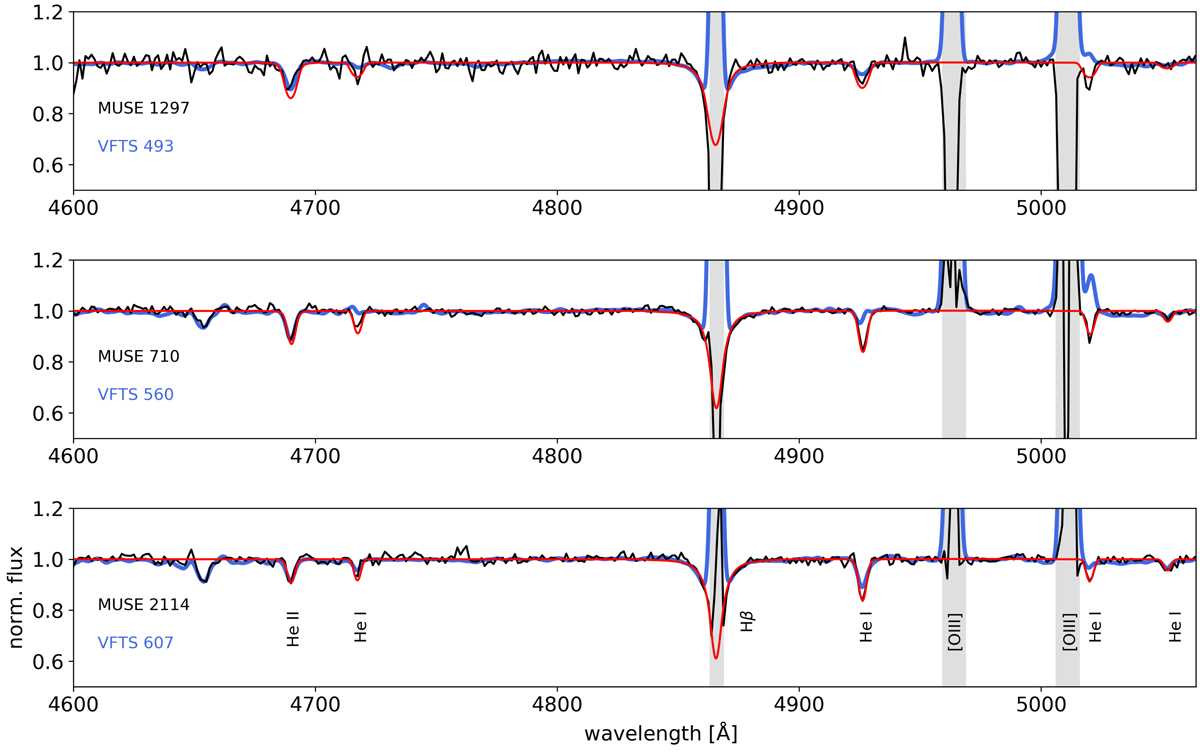
Comparison between three stars analysed in this work (solid black line) and in the VFTS project (solid blue line) whose derived gravities differ significantly between studies. The best FASTWIND model obtained in the MUSE analysis is shown (solid red lines). Wavelengths expected to be strongly affected by nebular contamination are marked in grey.
Current usage metrics show cumulative count of Article Views (full-text article views including HTML views, PDF and ePub downloads, according to the available data) and Abstracts Views on Vision4Press platform.
Data correspond to usage on the plateform after 2015. The current usage metrics is available 48-96 hours after online publication and is updated daily on week days.
Initial download of the metrics may take a while.