Fig. 6.
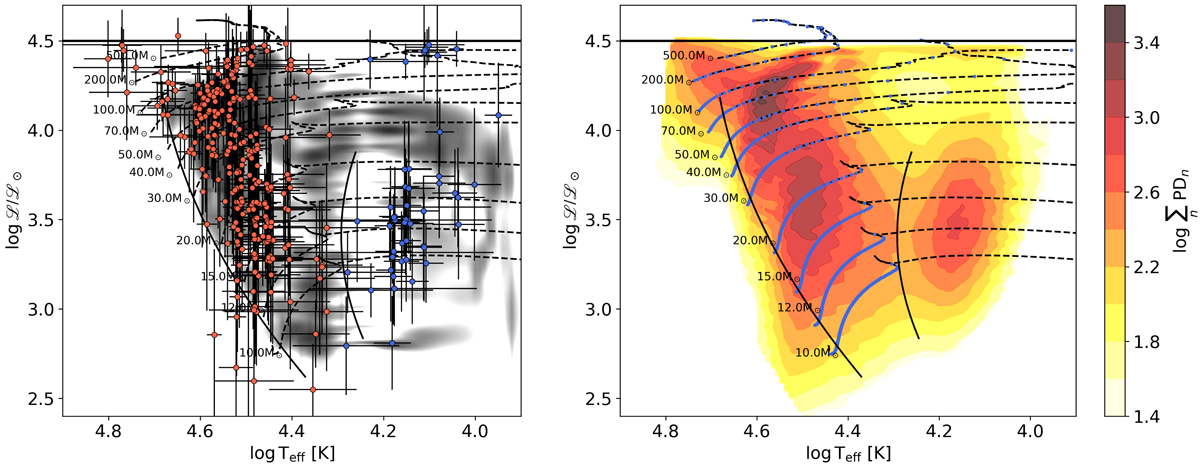
Spectroscopic HRD (sHRD, ℒ ≡ ![]() , Langer & Kudritzki 2014) for the MUSE sample. Left: positions of the MUSE sample in the sHRD (red and blue dots, offset slightly where required to avoid overlap) compared to the equivalent probability distribution (PD) for the Milky Way from Castro et al. (2014, grey shaded regions) and theoretical rotating evolutionary tracks from Köhler et al. (2015). Stars apparently beyond the TAMS, flagged as candidate emission-line stars (Castro et al. 2018a), are marked in blue in the left-hand panel (see Sect. 4.2). Right: summed PD functions from the MUSE analysis and the same evolutionary tracks, in which the blue dots indicate equal time steps of 0.1 Myr. Horizontal lines at log ℒ/ℒ⊙ = 4.5 mark the upper limit of the model grid (the Eddington limit is at log ℒ/ℒ⊙ = 4.6). The other two solid black lines indicate the empirical ZAMS and TAMS from Castro et al. (2014) for the Milky Way.
, Langer & Kudritzki 2014) for the MUSE sample. Left: positions of the MUSE sample in the sHRD (red and blue dots, offset slightly where required to avoid overlap) compared to the equivalent probability distribution (PD) for the Milky Way from Castro et al. (2014, grey shaded regions) and theoretical rotating evolutionary tracks from Köhler et al. (2015). Stars apparently beyond the TAMS, flagged as candidate emission-line stars (Castro et al. 2018a), are marked in blue in the left-hand panel (see Sect. 4.2). Right: summed PD functions from the MUSE analysis and the same evolutionary tracks, in which the blue dots indicate equal time steps of 0.1 Myr. Horizontal lines at log ℒ/ℒ⊙ = 4.5 mark the upper limit of the model grid (the Eddington limit is at log ℒ/ℒ⊙ = 4.6). The other two solid black lines indicate the empirical ZAMS and TAMS from Castro et al. (2014) for the Milky Way.
Current usage metrics show cumulative count of Article Views (full-text article views including HTML views, PDF and ePub downloads, according to the available data) and Abstracts Views on Vision4Press platform.
Data correspond to usage on the plateform after 2015. The current usage metrics is available 48-96 hours after online publication and is updated daily on week days.
Initial download of the metrics may take a while.