| Issue |
A&A
Volume 648, April 2021
|
|
|---|---|---|
| Article Number | A93 | |
| Number of page(s) | 25 | |
| Section | Interstellar and circumstellar matter | |
| DOI | https://doi.org/10.1051/0004-6361/202039604 | |
| Published online | 19 April 2021 | |
Keplerian disks and outflows in post-AGB stars: AC Herculis, 89 Herculis, IRAS 19125+0343, and R Scuti★,★★
1
Observatorio Astronómico Nacional (OAN-IGN),
Apartado 112,
28803,
Alcalá de Henares,
Madrid, Spain
e-mail: This email address is being protected from spambots. You need JavaScript enabled to view it.
2
Centro de Desarrollos Tecnológicos, Observatorio de Yebes (IGN),
19141
Yebes,
Guadalajara, Spain
3
Institut de Radioastronomie Millimétrique,
300 rue de la Piscine,
38406
Saint-Martin-d’Hères, France
4
Observatorio Astronómico Nacional (OAN-IGN),
Alfonso XII 3,
28014
Madrid, Spain
5
Instituut voor Sterrenkunde,
KU Leuven, Celestijnenlaan 200B,
3001
Leuven, Belgium
Received:
6
October
2020
Accepted:
4
March
2021
Abstract
Context. There is a class of binary post-AGB stars with a remarkable near-infrared excess that are surrounded by Keplerian or quasi-Keplerian disks and extended outflows composed of gas escaping from the disk. The Keplerian dynamics had been well identified in four cases, namely the Red Rectangle, AC Her, IW Car, and IRAS 08544−4431. In these objects, the mass of the outflow represents ~10% of the nebular mass, the disk being the dominant component of the nebula.
Aims. We aim to study the presence of rotating disks in sources of the same class in which the outflow seems to be the dominant component.
Methods. We present interferometric NOEMA maps of 12CO and 13CO J = 2–1 in 89 Her and 12CO J = 2–1 in AC Her, IRAS 19125+0343, and R Sct. Several properties of the nebula are obtained from the data and model fitting, including the structure, density, and temperature distributions, as well as the dynamics. We also discuss the uncertainties on the derived values.
Results. The presence of an expanding component in AC Her is doubtful, but thanks to new maps and models, we estimate an upper limit to the mass of this outflow of ≲3 × 10⁻⁵ M⊙, that is, the mass of the outflow is ≲5% of the total nebular mass. For 89 Her, we find a total nebular mass of 1.4 × 10⁻² M⊙, of which ~50% comes from an hourglass-shaped extended outflow. In the case of IRAS 19125+0343, the nebular mass is 1.1 × 10⁻² M⊙, where the outflow contributes ~70% of the total mass. The nebular mass of R Sct is 3.2 × 10⁻² M⊙, of which ~75% corresponds to a very extended outflow that surrounds the disk.
Conclusions. Our results for IRAS 19125+0343 and R Sct lead us to introduce a new subclass of binary post-AGB stars, for which the outflow is the dominant component of the nebula. Moreover, the outflow mass fraction found in AC Her is smaller than those found in other disk-dominated binary post-AGB stars. 89 Her would represent an intermediate case between both subclasses.
Key words: stars: AGB and post-AGB / binaries: general / circumstellar matter / radio lines: stars / planetary nebulae: general / techniques: interferometric
Final datacubes are only available at the CDS via anonymous ftp to cdsarc.u-strasbg.fr (130.79.128.5) or via http://cdsarc.u-strasbg.fr/viz-bin/cat/J/A+A/648/A93
Based on observations with IRAM NOrthern Extended Millimeter Array (NOEMA). IRAM is supported by INSU/CNRS (France), MPG (Germany), and IGN (Spain).
© ESO 2021
1 Introduction
Most of the protoplanetary (or pre-planetary) and planetary nebulae (pPNe and PNe) show fast bipolar outflows (30–100 km s−1) with clear axial symmetry. These outflows are responsible for a good fraction of the total mass (~0.1 M⊙) and carry very large amounts of linear momentum (Bujarrabal et al. 2001). The immediate precursor of the post-AGB stars, the asymptotic giant branch (AGB) stars, present spherical circumstellar envelopes, which are in isotropic expansion at moderate velocities, around 10–20 km s−1 (Castro-Carrizo et al. 2010). The spectacular evolution from AGB circumstellar envelopes to post-AGB nebulae takes place in a very short time (~1000 yr). The accepted scenario to explain this evolution implies that material is accreted by a companion from a rotating disk, followed by the launching of very fast jets, in a process similar to that in protostars (Soker 2002; Frank & Blackman 2004; Blackman & Lucchini 2014). However, the effect of binarity in post-AGB stars is still poorly understood (De Marco & Izzard 2017).
There isa class of binary post-AGB stars that systematically show evidence of the presence of disks (Van Winckel 2003; de Ruyter et al. 2006; Bujarrabal et al. 2013a; Hillen et al. 2017) and low initial mass (Alcolea & Bujarrabal 1991). The observational properties of these objects were recently reviewed by Van Winckel (2018). All of them present a remarkable near-infrared (NIR) excess and the narrow CO line profiles characteristic of rotating disks. Their spectral energy distributions (SEDs) reveal the presence of hot dust close to the stellar system, and its disk-like shape has been confirmed by interferometric IR data (Hillen et al. 2017; Kluska et al. 2019). These disks must be stable structures, because their IR spectra reveal the presence of highly processed grains (Gielen et al. 2011; Jura 2003; Sahai et al. 2011). Observations of 12CO and 13CO in the J = 2–1 and J = 1–0 lines have been well analyzed in sources with such a NIR excess (Bujarrabal et al. 2013a) and they show line profiles formed by anarrow single peak and relatively wide wings. These line profiles are similar to those in young stars surrounded by a rotating disk made of remnants of interstellar medium and those expected from disk-emission modelling (Bujarrabal et al. 2005; Guilloteau et al. 2013). These results indicate that the CO emission lines of our sources come from Keplerian or quasi-Keplerian disks. The systematic detection of binary systems in these objects (Oomen et al. 2018) strongly suggests that the angular momentum of the disks comes from the stellar system.
The study of Keplerian disks around post-AGB stars requires high angular- and spectral-resolution observations because of the relative small size of the rotating disks. To date, there are only four resolved cases of Keplerian rotating disks: the Red Rectangle (Bujarrabal et al. 2013b, 2016), AC Her (Bujarrabal et al. 2015), IW Car (Bujarrabal et al. 2017), and IRAS 08544−4431 (Bujarrabal et al. 2018). All four have been very well studied through single-dish and interferometric millimeter(mm)-wave maps of CO lines. These four studied sources show CO spectra with narrow line profiles characteristic of rotating disks and weak wings. This implies that most of the material of the nebula is contained in the rotating disk. However, according to the mm-wave interferometric maps there is a second structure surrounding the disk that is less massive, contains ~10% of the total mass, and is in expansion. This outflow is probably a disk wind consisting in material escaping from the rotating disk (see extensive discussion of the best studied source by Bujarrabal et al. 2016).
In the present work, we present NOEMA maps of 12CO and 13CO J = 2–1 emission lines in AC Her, 89 Her, and IRAS 19125+0343 —which are confirmed binaries—, and R Sct. R Sct is a different object, it is a very bright star in the visible and is a RV Tau variable, but its SED is different from those of the other sources in our sample, with a less prominent NIR excess. Also, its binary nature is not yet confirmed either. We discuss this source in Sect. 2.4. On the other hand, AC Her, 89 Her, and IRAS 19125+0343 are confirmed binaries that also belong to the same class of binary post-AGB stars with remarkable NIR excess. Our results of 89 Her, IRAS 19125+0343, and R Sct show that the extended outflowing component is even more massive than the rotating disk. This suggests that they are part of a new subclass: the outflow-dominated nebulae around post-AGB stars.
The paper is organized as follows. We present our post-AGB star sample in Sect. 2. Technical information of our observations is given in Sect. 3. We discuss the mm-wave interferometric maps in Sect. 4. Results from our best-fit models are shown in Sect. 5. Finally, we present our main conclusions in Sect. 6.
Binary post-AGB stars observed in this paper.
2 Source descriptions and previous results
We produced interferometric maps of four sources (Table 1) using the IRAM NOrther Extended Millimeter Array (NOEMA). All of them are identified as binary post-AGB stars (binary system including a post-AGB star) with low gravity, high luminosity, FIR-excess indicative of material ejected by the star, and the mentioned remarkable NIR excess, and have been previously studied in CO by means of single-dish observations.
We adopted the same distances used in Bujarrabal et al. (2013a). We chose these distances to facilitate the comparison with the results derived in that work and because, in the case of binary stars, the estimation of distances via parallax measurements is very delicate (Dominik et al. 2003). We discarded other options because they present large uncertainties. The best values are likely those derived from the not-yet-available Gaia Data Release 3 (Gaia DR3), which considers astrometry for binary systems. As we discuss in detail in Sect. 5.5, we will easily be able to scale the derived values of our best-fit models for some parameters, including size and mass, if and when a new and better value for the distance to the sources is determined.
2.1 AC Her
AC Her is a binary post-AGB star (Oomen et al. 2019); although some authors have suggested that it could rather be a post-RGB star (Hillen et al. 2015). The CO line profiles and interferometric maps of AC Her are very similar to the ones found in the Red Rectangle. According to this, AC Her must be a post-AGB star whose nebula is dominated by a Keplerian disk.
Previous mm-wave interferometric observations confirm that AC Her presents a clear disk with Keplerian dynamics, which dominates the nebula (Bujarrabal et al. 2015; Hillen et al. 2015). It presents a mass ~1.5 × 10⁻³ M⊙, densities of 106 –104 cm−3, and temperatures of 80–20 K. These results were obtained adopting a distance of 1600 pc. Approximately 40% of the total flux was filtered out by interferometric observations. However, no outflowing material was detected in these papers. Due to the large inner radius (30–35 AU) and the low gas-to-dust ratio, the Keplerian disk is very likely to be in an evolved state and its mass was probably larger before (Hillen et al. 2015).
2.2 89 Her
89 Her is a binary post-AGB star with a remarkable NIR-excess that implies the presence of hot dust (de Ruyter et al. 2006). It also shows significant far-infrared (FIR) emission. The presence of large grains was proposed by Shenton et al. (1995).
Single-dish observations show narrow CO lines that are very similar to the ones detected in the Red Rectangle, but with more prominent wings, which suggests a significant contribution of the outflow (Bujarrabal et al. 2013a). The source was studied in detail by Bujarrabal et al. (2007); see also Alcolea & Bujarrabal (1995) and Fong et al. (2006). Bujarrabal et al. (2007) discovered two features from NOEMA maps in 12CO J = 2–1 in the nebula around 89 Her: an extended hourglass-shaped structure and a central clump, which probably corresponds to an unresolved disk. Near-infrared observations strongly suggest that in 89 Her the binary system is surrounded by a compact and stable circumbinary disk in Keplerian rotation, where large dust grains form and settle to the midplane (Hillen et al. 2013, 2014).
Observational parameters.
2.3 IRAS 19125+0343
IRAS 19125+0343 is a binary post-AGB star (Gielen et al. 2008). It also belongs to this class of binary post-AGB stars with remarkable NIR-excess (Oomen et al. 2018), implying the presence of hot dust. For this source, the assumed value for the distance (Table 1) is highly questionable because some authors adopt very different values, such as 1800 ± 400 pc in Gielen et al. (2008) or 4131 pc in Bailer-Jones et al. (2018).
Its CO lines are narrow (Bujarrabal et al. 2013a), and so the hot dust must be located in a compact rotating disk, but they also have prominent wings. The circumbinary disk could be surrounded by an outflow containing most of the mass. The single-dish analysis yielded a nebular mass of 1.3 × 10⁻² M⊙.
2.4 R Sct
While the first three sources mentioned above are spectroscopically confirmed binaries, this is not the case for R Sct. This bright RV Tauri star shows very irregular pulsations with variable amplitude (see Kalaee & Hasanzadeh 2019), and only a small IR excess (Kluska et al. 2019), meaning that the SED is not clearly linked to the presence of a circumbinary disk. Hence, the star was labeled “uncertain” in the classification of post-AGB stars surrounded by disks in Gezer et al. (2015). The high amplitude of the pulsations is also reflected in the radial-velocity amplitude (Pollard et al. 1997). It is worth mentioning that a magnetic field has been detected; see e.g. Tessore et al. (2015). Moreover, Matsuura et al. (2002) suggest that it could be an AGB star in the helium-burning phase of the thermal pulse cycle.
However, it is known that R Sct is an RV Tauri type variable source and hence probably a post-AGB star. Its CO line profiles are differentfrom those of other binary post-AGB stars studied by Bujarrabal et al. (2013a). Following this, it might be compatible with the presence of a Keplerian disk, and as Keplerian disks are only detected around binaries, it could well be binary as well, but this needs to be confirmed. This hypothesis is reinforced by interferometric data in the H-band showing a very compact ring (Kluska et al. 2019). Therefore, we tentatively consider R Sct as a binary post-AGB star, like the other three sources. The nebular mass derived from the single-dish studies is 5 × 10⁻² M⊙, where ~14% would correspond to the disk.
3 Observations and data reduction
Observations of the 12CO J = 2–1 rotational transition at 230.53799 GHz were carried out towards AC Her, 89 Her, IRAS 19125+0343, and R Sct with the IRAM NOEMA interferometer at Plateau de Bure (France) with six antennas. Data of the 13CO J = 2–1 transition were also obtained for 89 Her. The data calibration was performed with the CLIC software (GILDAS package). In all the observing sessions, measurements with high signal-to-noise ratio were obtained on a bright calibration source in order to calibrate the instrumental RF spectral response. Calibration sources close to each source were cyclically observed, and their data used to perform a first standard gain calibration. Phase self-calibration was performed later on the source continuum emission. In all the sessions, the calibration source MWC 349 was observed as the primary flux reference, with an adopted flux of 1.91 Jy at 230.5 GHz. The data four all the observed line emissions were obtained with a spectral resolution of 0.05 km s−1. Additional bandwidth with a channel spacing of 2–2.5 MHz was delivered to map continuum emission, the available bandwidth being different for the different observations. More details can be found below and a summary of observational parameters can be found in Table 2. MAPPING, also part of GILDAS, was used for data analysis and image synthesis. Final maps were obtained after continuum-emission subtraction and analyzed following image synthesis using natural and robust weightings of the visibilities. For the relatively low resolution, all sources present continuum images that are compact and unresolved, and are only used in the reduction of the data (see Sect. 4).
AC Her was observed with observatory project names XB74 and W14BU. The data of project XB74 were already presented by Bujarrabal et al. (2015). In this work, we add to the previous data those of new project W14BU, which were aimed to increase the sensitivity. The new data were obtained in December 2014, April 2015, and March 2016, with baselines ranging from 17 to 760 m. Considering the addition of the two projects, a total of 21 h were obtained on source, with an available bandwidth for continuum from 228.2 to 231.8 GHz. In Fig. 1, we present channel maps of 12CO J = 2–1 emission with a resampled spectral resolution of 0.2 km s−1 and a synthetic beam of 0.″35 × 0.″35 in size, obtained using natural weighting. Relevant position–velocity diagrams are shown in Fig. 2.
89 Her was observed for 11 h in November 2005 and January 2006 under project name P05E. In addition to the line emission, data were delivered for continuum in a bandwidth of 600 MHz. These data were published by Bujarrabal et al. (2007) where more details can be found. A new uv-data processing was performed using tapering in order to reduce small-scale variations in the crude map at the expense of spatial resolution. New channel maps are presented in the top panel of Fig. 3, which were obtained with a synthetic beam of 1.″02 × 0.″83 in size with a spectral resolution of 0.2 km s−1, the major axis being oriented at PA = 115°. In addition, observations of the 13CO J = 2–1 line emission in 89 Her were performed under the project names X073 and W14BT. X073 data were obtained with the most extended configuration between January and March 2014, those for W14BT in December 2014, and from February to April 2015 for more compact B and D configurations, in order to attain baselines ranging from 15 to 760 m. Acquisitions were obtained on source for a total of 22 h, with a continuum bandwidth from 218.1 to 221.7 GHz with 2 MHz of channel spacing. MWC 349 was observed in all the tracks as in the primary flux calibrator, with an adopted flux of 1.86 Jy. In the bottom panel of Fig. 3, we present channel maps of the 13CO J = 2–1 line emission with a spectral resolution of 0.2 km s−1 and a synthetic beam of 0.″74 × 0.″56 in size, the major axis being oriented at PA = 28°, obtained with natural weighting. In Fig. 4 we present relevant position–velocity diagrams.
Observations of IRAS 19125+0343 were made between February and March 2013 under the project name WA7D. A total of 12 h were obtained on source with extended array configuration, baselines ranging from 55 to 760 m. The interferometric visibilities were merged with zero-spacing data obtained with the 30 m IRAM telescope, which guarantees that no flux is missed in final maps. We present channel maps of the 12CO J = 2–1 line emission with a channel spacing of 1 km s−1 and a synthetic beam of 0.″7 × 0.″7 in size (Fig. 6). We chose a circular beam in order to best compare with models, while the original data yield a synthetic beam of 0.″7 × 0.″4 with naturalweighting. The spectral configuration was the same as described for AC Her. In Fig. 7 we present relevant position–velocity diagrams.
Observations of R Sct were performed in the summer and autumn of 2015 with the array in the most compact configurations (project name S15BA). A total of 12 h were obtained on source. The spectral configuration was the same as that described for AC Her. As R Sct line emission is considerably extended, we added to the NOEMA visibilities short-spacing pseudo-visibilities obtained from on-the-fly maps with the 30 m IRAM telescope to compensate the extended component filtered out by the interferometry. In Fig. 8, we present channel maps with a spectral resolution of 0.5 km s−1 and a synthetic beam of 3.″12 × 2.″19 in size, with the major axis oriented at PA = −185°. We show relevant position–velocity diagrams in Fig. 9.
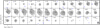 |
Fig. 1 NOEMA maps per velocity channel of 12CO J = 2–1 emission from AC Her. The beam size (HPBW) is 0.″35 × 0.″35. The contour spacing is logarithmic: ±9, 18, 36, 76, and 144 mJy beam−1 with a maximum emission peak of 230 mJy beam−1. The LSR velocity is indicated in the upper left corner of each velocity-channel panel and the beam size is shown in the last panel. |
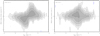 |
Fig. 2 Left: position–velocity diagram from our NOEMA maps of 12CO J = 2–1 in AC Her along the direction PA = 136.1°, corresponding to the nebula equator. The contour spacing is logarithmic: ±9, 18, 36, 76, and 144 mJy beam−1 with a maximum emission peak of 230 mJy beam−1. The dashedlines show the approximate central position and systemic velocity. Right: same as in left but along the perpendicular direction PA = 46.1°. |
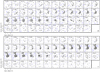 |
Fig. 3 Top: NOEMA maps per velocity channel maps of 12CO J = 2–1 from 89 Her. The beam size (HPBW) is 1.″02 × 0.″83, the major axis being oriented at PA = 115°. The contour spacing is logarithmic: ± 70, 140, 280, and 560 mJy beam−1 with a maximum emission peak of 870 mJy beam−1. Bottom: same as in top but for 13CO J = 2–1. The beam size (HPBW) is 0.″74 × 0.″56, the major axis being oriented at PA = 28°. The contour spacing is logarithmic: ± 11, 22, 44, 88, and 144 mJy beam−1 with a maximum emission peak of 225 mJy beam−1. The LSR velocity is indicated in the upper left corner of each velocity-channel panel and the beam size is shown in the last panel. |
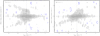 |
Fig. 4 Left: position–velocity diagram from our NOEMA maps of 12CO J = 2–1 in 89 Her along the direction PA = 150°, corresponding to the nebula equator. The contour spacing is logarithmic: ± 70, 140, 280, and 560 mJy beam−1 with a maximum emission peak of 870 mJy beam−1. The dashed lines show the approximate central position and systemic velocity. The beam is represented in the last panel. Right: same as in left but along PA = 60°. |
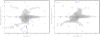 |
Fig. 5 Left: same as Fig. 4 (left) but for 13CO J = 2–1 emission. The contours are ± 11, 22, 44, 88, and 144 mJy beam−1 with a maximum emission peak of 225 mJy beam−1. The dashed lines show the approximate centroid in velocity and position. Right: same as in left but along the perpendicular direction PA = 60°. |
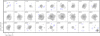 |
Fig. 6 Maps per velocity channel of 12CO J = 2–1 emission from IRAS 19125+0343. The beam size (HPBW) is 0.″70 × 0.″70. The contour spacing is logarithmic: ±20, 40, 80, 160, and 320 mJy beam−1 with a maximum emission peak is 413 mJy beam−1. The LSR velocity is indicated in the upper left corner of each velocity-channel panel and the beam size is shown in the last panel. |
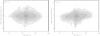 |
Fig. 7 Left: position–velocity diagram from our maps of 12CO J = 2–1 in IRAS 19125+0343 along the direction PA = −40°, corresponding to the nebula equator. The contour spacing is logarithmic: ±40, 80, 160, and 320 mJy beam−1 with a maximum emission peak of 413 mJy beam−1. The dashedlines show the approximate central position and systemic velocity. Right: same as in left but along the perpendicular direction PA = 50°. |
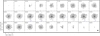 |
Fig. 8 Maps per velocity channel of 12CO J = 2–1 emission from R Sct. The beam size (HPBW) is 3.″12 × 2.″19, the major axis oriented at PA = −185°. The contour spacing is logarithmic: ± 50, 100, 200, 400, 800 and 1600 mJy beam−1 with a maximum emission peak of 2.4 Jy beam−1. The LSR velocity is indicated in the upper left corner of each velocity-channel panel and the beam size is shown in the last panel. |
 |
Fig. 9 Left: position–velocity diagram from our maps of 12CO J = 2–1 in R Sct along the direction PA = 0°, corresponding to the nebula equator. The contour spacing is logarithmic: ± 25, 50, 100, 200, 400, 800, and 1600 mJy beam−1 with a maximum emission peak of 2.4 Jy beam−1. The dashedlines show the approximate central position and systemic velocity. Right: same as in left but along the perpendicular direction PA = 90°. |
4 Interferometric observational results
In this section, we present the results directly obtained from the observations. We show maps per velocity channel and position–velocity (PV) diagrams along the assumed two major perpendicular directions of the nebula: along the equatorial rotating disk and along the revolution symmetry axis of the nebula.
In the cases of 89 Her, IRAS 19125+0343, and R Sct the central disk is not well resolved. However, we underline that: (a) their CO single-dish profiles are similar to those of other binary post-AGB stars (Bujarrabal et al. 2013a), in which we know that there are central disks and that their contribution to the profiles is significant, (b) PV diagrams show hints of the typical PV diagram structure of disks with Keplerian dynamics, (c) the high-velocity dispersion observed in the central regions is the same as that expected from an unresolved Keplerian disk, and (d) when longer baselines are favored and inner regions are selected (even at the cost of losing flux), we find a line profile with two peaks characteristic of rotating disks (see CO line profiles of 89 Her and R Sct in Appendix B). For these reasons, we think that these three nebulae probably harbor a rotating disk at their center and we include such a structure in our modeling (Sect. 5).
4.1 AC Her
The 12CO J = 2–1 mm-wave interferometric results are presented in Fig. 1. These observations are of higher resolution than those previously published (Bujarrabal et al. 2015). In addition, we also include shorter baselines to reduce the flux loss (no significant amount of flux was missed in the interferometric data; see Fig. A.1) and to improve the sensitivity for the detection of the expanding component. A Keplerian disk was already detected in the published data; here we focus on the detection of the outflow.
In Appendix C we present an analysis of the emission of the outflow along different PA (position angle, measured from north to east). Thanks to our detailed study, we determined that the direction better showing the Keplerian dynamics is PA = 136.1° ± 1.4° (see Appendix C for details); this direction is termed the “equatorial direction” hereafter.
As we can see in the left panel of Fig. 2, by comparison with results in Appendix C, the PV diagram along this equatorial direction very nicely shows the characteristic signature of Keplerian rotation. The investigation of the PV diagram along the nebula axis (i.e., perpendicular to the equatorial direction) should help us to detect the presence of an axially expanding outflow. In the PV along the nebula axis in the right panel of Fig. 2, we can see a strong emission from the Keplerian disk in the central regions. The theoretical PV diagram along the nebula axis in pPNe in the presence of just a rotating disk shows emission with a form similar to a diamond or rhombus with similar emission in all four PV diagram quadrants. On the contrary, we see how the emission at central velocities is slightly inclined, which could be explained by the presence of a low-mass outflow surrounding the Keplerian disk. With these new observations we tentatively detect these weak vestiges of the outflow of AC Her, which may have a structure similar to the one found in similar sources like the Red Rectangle. From the detailed analysis in Appendix C, we conclude that the outflow is tentatively detected with an emission ≲10 mJy beam−1 km s−1.
4.2 89 Her
We present NOEMA maps of 89 Her of 12CO and 13CO in J = 2–1 emissions. The flux loss in the interferometric observations is discussed in Appendix A. We estimate ~30% of lost flux in 12CO J = 2–1 and ~50% in the wings in 13CO J = 2–1 (Figs. A.2 and A.3). These valuesexceed the relative calibration error, ~30%. The presence of a certain amount of flux that is filtered out in this case is confirmed by the different profile shapes.
In these maps and PV diagrams (see Figs. 3–5), we see an extended component and a central clump. The shape of the CO emission suggests the presence of an extended hourglass-like structure. This shape is also clear in PV diagrams taken along the nebula axis (see the right panels of Figs. 4 and 5). According to the angular size of the hourglass-like structure, ~10″, and for a distance of 1000 pc, we find that the size of the nebula is at least 10 000 AU (projected in the sky), 1.5 × 1017cm.
Inspection of the PV diagrams allows us to study the compact component of the CO emission, which seems to be a disk whose projection is elongated in the equatorial direction PA = 150°. The extent of the disk is not detected and must be ≤1″. Position–velocity diagrams with PA = 150° (see the left panels of Figs. 4 and 5) suggest that a Keplerian disk with a moderate dispersion of velocity could be responsible for that compact clump. Asymmetrical velocities are present in both maps because more emission appears at positive velocities than at negative velocities. This kind of phenomenon is often observed in our sources, probably as a result of self-absorption by cold gas in expansion located in front of the disk (e.g., Bujarrabal et al. 2018). As argued in Sect. 4 and Appendix B, we think that there must be a Keplerian disk in the inner region of the nebula of 89 Her. We find that the line profile from the central component shows the characteristic double peak of rotating disks (see Fig. B.1). However, we stress that these two peaks are barely detected and we cannot accurately discern the emission of the central disk from the emission and absorption from the very inner and dense gas of the outflow.
4.3 IRAS 19125+0343
We present combined NOEMA and 30 m maps of IRAS 19125+0343 of 12CO J = 2–1 emission in Fig. 6 (see Sect. 3 for details). Maps of the 30 m reveals that the source is compact and it presents a smaller size than the beam. The main beam of NOEMA is even bigger than that of the 30 m, and so we are sure that there is no flux loss in the combined presented maps and all components of the source are detected. Due to the small size of the source (see Fig. 6), the brightness distribution is barely resolved in channel maps. The extent of the source is better appreciated in PV diagrams (see Fig. 7 left and right), but we must be aware of the synthetic beam. The linear dependence of the position with the velocity suggests a nebula elongated along PA = 50°, which would be the direction of the symmetry axis projection in the plane of the sky, with expansion velocity increasing with distance (a typical field in expanding nebulae around post-AGB stars and pPNe). A velocity gradient is confirmed by our model (see Sect. 5.3). The observed velocity gradient cannot be caused by the rotating disk, because the velocity seems to increase with the distance to the center. If the observed velocity were attributed to rotation this would imply an extremely large central mass. From the PV diagram in the right panel of Fig. 7 and taking into account the distance (1500 pc; see Table 1), the supposed central mass would be >50 M⊙. This result is not acceptable. Therefore, the observed velocity gradient must have its origin in the axial expansion of the outflow. We do not have clear evidence of rotation from the inner region, which is not resolved. However, the moderate dispersion of velocity of the inner region and the characteristic single-dish CO profiles lead us to suggest that there must be a rotating component in the inner part of the nebula.
What is more interesting is the strong emission from the extended component that surrounds the inner region of the nebula (right panel of Fig. 7). The outflow contribution to the total emission is dominant, and its mass could be at least similar to that of the rotating disk. This is not a surprise because the wings of the single-dish profiles of IRAS 19125+0343 are very intense in 12CO J = 2–1.
In the case of IRAS 19125+0343, and according to Appendix B, there is no sign of the characteristic double peak in the line profile from the central compact component (see Fig. B.1). We are convinced that the inclination of the disk with respect to the line of sight prevents us from seeing that effect. This is expected because AC Her for example does not present the double peak in its single-dish CO line profiles (Bujarrabal et al. 2013a), and this source basically consists in a Keplerian disk and an inclination similar to that of IRAS 19125+0343 (see Sects. 5.1, 5.3, and Bujarrabal et al. 2015).
4.4 R Sct
We present combined NOEMA and 30 m maps of R Sct in 12CO J = 2–1 emission in Fig. 8 (see Sect. 3 for details). This is the source in our sample with the largest angular size. In Fig. 9, we show PV diagrams of 12CO J = 2–1 emission, where the presence of an extended component is clearly seen. The total extent of the R Sct nebula is ~40″, which implies a linear size for the nebula of ~40 000 AU. We think that the massive outflow contains most of the total mass; see Sect. 5.4.
Our NOEMA observations were merged with extensive single-dish maps (Sect. 3) and therefore no flux is filtered out in the shown channel maps.
The PV diagram along the equator (Fig. 9 left) reveals the presence of a central clump in the inner region that probably represents the emission from the Keplerian disk, which remains unresolved in our maps. This interpretation is particularly uncertain in the case of R Sct, because its classification as binary post-AGB star is not confirmed (see Sect. 2.4), and the central peak in its single-dish profiles is less prominent than in other sources (Bujarrabal et al. 2013a). However, the velocity dispersion of the CO emission from its unresolved central condensation is very similar to those found in other disk-containing post-AGB nebulae (see e.g. Bujarrabal et al. (2016, 2017) and data on other sources in previous sections, including a significant lack of blueshifted emission). This kind of phenomenon is frequently observed in this type of source as a result of self-absorption of inner warmer regions by colder gas in expansion in front of them along the line of sight, as mentioned in Sect. 4.2. We also see (Sect. 5.4) that models of CO emission from a small disk with very reasonable properties satisfactorily explain the observed emission from the center. Additionally, we find that the line profile from the central compact component (see Fig. B.1) shows the characteristic double peak of rotating disks (see Sect. 4 and Appendix B), and therefore it probably arises from the unresolved Keplerian disk. Nevertheless, we must keep in mind that we cannot discern the emission of the central and rotating component from the emission and absorption from the most inner and dense gas of the outflow. We therefore conclude that the presence of a Keplerian disk cannot be demonstrated in a conclusive way, but the central condensation found in the innermost region of R Sct is probably an unresolved rotating disk.
We must pay attention to the PV diagram along the nebula axis (Fig. 9 right), with PA = 90°, where the nebular structure is more evident. We can see two big cavities centered at about ± 10″. This kind of structure is often present in pPNe, such as M 1−92 (Alcolea et al. 2007) or M 2−56 (Castro-Carrizo et al. 2002).
5 Model fitting of our NOEMA maps
For modeling the sources, we used models and codes similar to those described in our previous mm-wave interferometric works (Bujarrabal et al. 2015, 2016, 2017, 2018, see also Sect. 1). Our model consists of a rotating disk surrounded by an outer outflow that can present different shapes (no sign of an expanding disk is found in our data). We consider axial and equatorial symmetry for our four nebulae. The model only includes CO-rich regions, because if there is a really extended halo poor in CO, it will not be detectable. We assume LTEpopulations for the rotational levels involved in the studied emission. This assumption is reasonable for low-J rotational levels of CO transitions, at least for gas densities over n ≥ 104 cm−3, because Einstein coefficients are much smaller than the typical collisional rates (Bujarrabal & Alcolea 2013; Bujarrabal et al. 2016). Therefore, the characteristic rotational temperature used here is in most relevant cases equal to the kinetic temperature(see Appendix D for more details). The use of LTE simplifies the calculations significantly and provides an easier interpretation of the fitting parameters of the model.
The inputs for the model are the nebular shape and distributions of the density, temperature, macroscopic velocity, and local turbulence. We assume constant 12CO and 13CO abundances.With these elements, the code calculates the emission and absorption coefficients of the observed lines (12CO J = 2–1 and 13CO in J = 2–1). These are computed for a large number of projected velocities and for a large number of elemental cells that fill the nebula. Typically, around 106 cells are used in our models. We solve the radiative transfer equation in the direction of the telescope. We then obtain a brightness distribution as a function of the coordinates and of the projected velocity. For this, we take into account the assumed orientation of the nebula axis with respect to the line of sight. Finally, the derived brightness distribution is numerically convolved with the interferometric clean beam.
Here, we present our best-fit model for the four analyzed sources. We stress that the nebula models are complexand have a very large number of parameters. We consider simple laws for the density (n) and characteristic rotational temperature (T):
 (1)
(1)
 (2)
(2)
where r0 takes the value:
 (3)
(3)
where r represents the distance to the center, h is the distance to the equator, and n0 and T0 are the values of the density and temperature at r = r0. Here, κn and κT are the values of the slopes in the potential law for density and temperature, respectively, and RK and hK represent the radius and height, respectively, of the disk with Keplerian dynamics.
We assume pure Keplerian rotation ( ) in the disk (Eq. (4)) and radial expansion velocity (Vexp) in the outflow (Eq. (5)):
 (4)
(4)
 (5)
(5)
where  is the tangential velocity of the Keplerian disk at 1016 cm. The parameter
  represents the expansion velocity of the ouflow at a distance of 1016 cm.
We assumed values of the relative abundances compatible with previous estimates. In particular, we adopted X(13CO) ~ 2 × 10⁻⁵ to ease the comparison of our mass estimates with those by Bujarrabal et al. (2013a) and a low X(12CO) / X(13CO) ~ 10, as usually found in those low-mass post-AGB nebulae (Bujarrabal et al. 1990, 2013a).
In Sects. 5.1–5.4 we present the results obtained from the model fitting of the observations for the four sources studied in this paper.
5.1 AC Her
The model for the structure of AC Her (see Fig. 11 and Table 3) is similar to the one we developed for the Red Rectangle and for IRAS 08544−4431 (see Bujarrabal et al. 2013b, 2016, 2018). Our maps, and mainly the PV diagram at PA = 136.1° (Figs. 1 and 2), and following a discussion similar to that in Bujarrabal et al. (2015), confirm that the detectedCO emission from AC Her comes from an orbiting disk with Keplerian rotation. The presence of an outflow is doubtful, because its emission is very weak (see Sect. 4.1 and Appendix C). However, the slight asymmetry of the emission in the most extreme angular offsets that we see in the right panel of Fig. 2 leads us to think that an outflow could be present.
Our best-fitting model is described in Table 3. We have taken the 12CO abundance to be X(12CO) = 2 × 10⁻⁴, the same value as in Bujarrabal et al. (2013a). We assume an inclination for the nebula axis with respect to the line of sight of 45°, in agreement with Bujarrabal et al. (2015).
The density and temperature laws in the disk and outflow are assumed to vary with the distance and they follow potential laws (see Eqs. (1) and (2)), according to the parameters of Table 3. Our model shows densities between 105 and 107 cm−3 and temperatures between 20 and 200 K (according to Eqs. (1) and (2) of Sect. 5, and parameters of Table 3). We find that the observations are compatible with Keplerian rotation in the disk (Eq. (4)) for a central total stellar mass of ~1 M⊙.
A representation of our model nebula and predicted results can be seen in Figs. 10, 11, and E.1. The main goal of our work is to study the outflow that appears to surround the Keplerian disk. Our modeling of the outflow is based on a linear law for the density and a constant value for the temperature of 100 K, which is a value typical of other outflows around Keplerian disks (Bujarrabal et al. 2016, 2017, 2018). We find that an increase in the outflow density by 50% yields results that are totally incompatible with observations. With these premises, we have found an upper limit to the mass of the outflow that is consistent with the observations of ≲ 2.0 × 10⁻⁵ M⊙. The derivedmass for the nebula of AC Her, including the extended component, is 8.3 × 10⁻⁴ M⊙, and it is therefore clearly a disk-dominated post-AGB nebula; we find that the mass of outflow represents ≲ 3% of the total mass.
Additionally, we present predictions from a model for the nebula of AC Her, in which only emission of the disk is considered (see Figs. E.2 and E.3). As we see, these predictions are almost equal to the ones of our standard model with the outflow emission. This is expected because the outflow contribution is very weak as we see in the observational data (see Sect. 4.1 and Appendix C for more details).
The analysis of the mass of the outflow in AC Her is very uncertain, mainly because of the lack of information on its main properties. In an attempt to quantify these uncertainties, we present an alternative model for AC Her (see Appendix E), where the size of the outflow is somewhat larger than that presented immediately above (but still compatible with our general ideas on such outflows). This alternative model (see Fig. E.11) presents the same characteristics for the disk. We see in Figs. E.4 and E.5 that the increase in the outflow size is still consistent with the observational data.
The total mass derived from our alternative model for the nebula is 8.4 × 10⁻⁴ M⊙, of which the mass of this more extended outflow is 3.2 × 10⁻⁵ M⊙. Therefore, the mass of this alternative and larger extended component represents just ≲4% of the total mass. The increase in the percentage of the outflow mass does not change significantly despite this significant increase in the size of the extended component. This alternative model leads us to conclude that the mass of the outflow must be ≲5% of the total mass, but we are aware of the uncertain analysis.
We tried to check the presence of the outflow calculating the derived residual emission from a comparison between observations and predictions of the disk-only model (Appendix E). Nevertheless, uncertainties in our best-fit models are too large and the residual emission is comparable to the outflow emission we are discussing, because the putative outflow is just ~5% of the maximum emission. Therefore, this method is not useful to prove the existence of the outflow.
Finally, we also tried to estimate the excess emission by comparing PV diagrams obtained for different position angles (see Appendix C for more details). We find in this way a tentative detection of the outflow emission, which would contain a mass again ≲5% of the total mass.
 |
Fig. 10 Left: synthetic PV diagram from our best-fit model of 12CO J = 2–1 in AC Her with an outflow. For ease of comparison with Fig. 2 the scales and contours are the same. Right: same as in left but along PA = 46.1°. |
 |
Fig. 11 Structure and distribution of the density of our best-fit model for the disk and outflow of AC Her. The Keplerian disk presentsdensity values ≥105 cm−3. The expansion velocity is represented with arrows. |
Physical conditions in the molecular disk and outflow of AC Her derived from the model fitting of the CO data.
5.2 89 Her
We adopted a nebula model (see Fig. 12 and Table 4) based on reasonable assumptions and predictions and compatible with the observational data and other works of 89 Her (see Sect. 4.2 and Bujarrabal et al. 2007). We assumed the presence of a compact disk in the central regions of the nebula and a large hourglass-shaped wind. See a representation of our model nebula and predicted results in Figs. 13, 14, and E.6.
The inclination of the nebular symmetry axis with respect to the line of sight is 15°, with a PA of 40° (150° for the equatorial direction). These results are directly obtained from our observational data and modelling. Position–velocity diagrams in Figs. 4 and 5 suggest strong self-absorption effects at negative velocities (Sect. 4.2).
The rotation of the disk is assumed to be Keplerian (Eq. (4)) and is compatible with a central stellar mass of 1.7 M⊙. The density and temperature of the outflow are assumed to vary with the distance to the center of the nebula following potential laws; see Eqs. (1) and (2). We find reliable results for density and temperature laws with high slope values. We also find expansion velocity in the outflow, according to Eq. (5). We can see the predictions from these considerations and the model parameters in the synthetic velocity maps and PV diagrams in Figs. 13, 14, and E.6.
Our model reproduces the NOEMA maps and yields a total mass for the nebula of ~1.1 × 10⁻² M⊙ with a disk mass of ~60%. This standard model includes the clear missed flux of the interferometric process with respect to the single-dish flux (see Appendix A). This implies that the derived mass is a moderate lower limit, and because of the observed geometry could mostly apply to the extended outflow. To quantify this effect, we considered that the spatially extended emission that is filtered out by the interferometer partially fills the shells, as in the cases of outflows in young stellar sources (e.g., Gueth et al. 1996). In this alternative model, the width of the outflow walls is increased by ~70% and yields a good fit of the 13CO J = 2–1 single-dish profile in Fig. A.4. With this, we derive a total mass of the nebula of ~1.4 × 10⁻² M⊙, of which ~6.4 × 10⁻³ M⊙ corresponds to the disk mass. We take these values as the most probable ones. We do not develop this topic in more detail, because we are discussing parts of the outflow structure whose emission is not detected. In the future, we plan to perform on-the-fly observations using the 30 m IRAM telescope and new observations with NOEMA.
We conclude that 41–53% of the total nebular mass is contained in the outflow. We consider the last value to be the most probable, because this result takes into account the lost flux, which very probably has its origin in the hourglass-shaped extended outflow. Therefore, it is an intermediate case between disk- and outflow-dominated post-AGB nebulae.
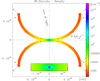 |
Fig. 12 Structure and distribution of the density of our best-fit model for the disk and outflow of 89 Her. The lower inset shows a zoom into the inner region of the nebula where the Keplerian disk presents density values ≥107 cm−3. The expansion velocity is represented with arrows. |
Physical conditions in the molecular disk and outflow of 89 Her derived from the model fitting of the CO data.
 |
Fig. 13 Left: synthetic PV diagram from our best-fit model of 12CO J = 2–1 in 89 Her along the direction PA = 150°. To be compared with the left panel of Fig. 4, the scales and contours are the same. Right: same as in left but along PA = 60°. |
 |
Fig. 14 Same as in Fig. 13 but for 13CO J = 2–1. To be compared with Fig. 5, the scales and contours are the same. |
5.3 IRAS 19125+0343
We present our best nebula model for IRAS 19125+0343 in Fig. 16 and Table 5. As the angular resolution is relatively poor (0.″ 7 × 0.″ 7), we cannot resolve the disk, but we do know some features of the extended component. We propose a model consisting of a rotating disk and an outflow with cavities along the axis. These cavities are parameterized with variables ho and Wo, where ho describes the height of the central region to the cavity and Wo describes the width of the outflow walls. This kind of shape is present in many pPNe (see Sect. 4.4)
As the disk is not resolved, our main goal for this source is to study the outflow. For that purpose, the PV diagram along the nebula axis is the most relevant result.
The final nebula model yields results that are absolutely compatible with the observations, as we can see in Figs. 6 and 7. An inclination for the nebula axis with respect to the line of sight of 40° is compatible with the data. We analyzed PV diagrams along different PA, and we find that the PV diagram along PA = 50° is the best to show the velocity position gradient characteristic of the expansion dynamics of the post-AGB and pPNe outflows. This fact implies that the PV diagram along PA = −40° should showthe rotation of the equatorial disk (Figs. 7 and 15); due to the relatively low resolution and the confusion with the intense extended component, the presumed Keplerian rotation of the disk is not detectable. However, in view of the CO line profiles compatible with those of well-identified disks, we think that there must be a rotating disk surrounded by an outflow.
The density and temperature laws of the disk and outflow are assumed to vary with the distance to the center of the nebula following potential laws (see Eqs. (1) and (2)). The velocity law of the disk is Keplerian (Eq. (4)) and compatible with a central stellar mass of 1.1 M⊙. In the outflowing component, we assume radial velocity with a modulus linearly increasing with the distance to the center (Eq. (5)).
We find a total mass value of 1.1 × 10⁻² M⊙ of which 7.9 × 10⁻³ M⊙ corresponds to the outflow mass. This means that IRAS 19125+0343 has a Keplerian disk surrounded by an outflow, the mass of which constitutes ~71% of the total mass.
We checked that IRAS 19125+0343 cannot present an hourglass-shaped extended component similar to the one in 89 Her (see Fig. 12) because predictions are incompatible with the maps. However, we cannot exclude that cavities were smaller.
Accordingly, we propose an alternative model to the extended component of IRAS 19125+0343, in order to check the validity of our best model. We present an outflow without extended cavities in the nebula axis (see Fig. E.12). We show the synthetic velocity maps (Fig. E.8) and PV diagrams along the nebula axis and along the nebula equator (Fig. E.9) from our alternative model. The predictions from this model are also compatible with the observational data of Sect. 4.3. The shape of the third level of emission at ~78 km s−1 and ~85 km s−1 at ~ ± 0.″ 4 in the right panel of Fig. 7 can only be reproduced after including cavities in the nebula model. We do not exclude models with small cavities or without them, but predictions of our alternative model are slightly worse than those from our best-fit model. This alternative model also serves to demonstrate our uncertainties.
 |
Fig. 15 Left: synthetic PV diagram from our best-fit model of 12CO J = 2–1 in IRAS 19125+0343 along the direction PA = −40°. To be compared with the left panel of Fig. 7, the scales and contours are the same. Right: same as in left but along PA = 50°. |
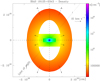 |
Fig. 16 Structure and distribution of the density of our best-fit model for the disk and outflow of IRAS 19125+0343. The Keplerian disk presents density values ≥106 cm−3. The expansion velocity is represented with arrows. |
Physical conditions in the molecular disk and outflow of IRAS 19125+0343 derived from the model fitting of the CO data.
 |
Fig. 17 Left: synthetic PV diagram from our best-fit model of 12CO J = 2–1 in R Sct along the direction PA = 0°. To be compared with the left panel of Fig. 9, the scales and contours are the same. Right: same as in left but along PA = 90°. |
5.4 R Sct
Figure 18 and Table 6 present our best-fit model for R Sct. According to the PV diagram shown in the right panel of Fig. 9, the structure of R Sct is extended and contains two big cavities along the axis at about ± 10″ (see Fig. 18). Similar structures often appear in other similar objects (Sects. 5 and 4.4).
The parameters that describe our best-fit model are shown in Table 6. We adopted a relative abundance with respect to the total number of particles of X(12CO) = 10−4 and X(13CO) = 2 × 10⁻⁵. We find a low [12C] / [13C] abundance ratio for this source (~5), the same as that found by Bujarrabal et al. (1990).
An inclination for the nebula axis with respect to the line of sight of 85° is compatible with the data. We can see the predicted PV diagrams along the equator and along the nebula axis in Fig. 17. The agreement between the observations and predictions is reasonable. We note the good fitting of the self-absorption (also present in the line profiles Bujarrabal et al. 2013a, see Sect. 4.4), but we stress that the central disk is barely detected due to the angular resolution (3.″ 12 × 2.″ 19). In view of the satisfactory model fitting and following the arguments already presented in Sect. 4.4 (see also Appendix B), we think that there is probably a rotating disk in the center of the R Sct nebula.
The outflow cavities are also present in our predictions, as we can see in the velocity maps and in the PV diagram along the nebula axis (Fig. 17 Right). The outflow shape is parameterized with variables Wo and ho, where Wo describes the width of the outflow walls, and ho describes the height of the central region to the cavity (see Table 6 and Fig. 18).
As we see, we predict a very diffuse and cold outflow. The predicted temperatures may appear very low, but as we see in Appendix D, the kinetic temperature (TK) is expected to be higher than excitation temperature (Tex) for these low densities because of the expected underpopulations of relevant levels. In reality, we expect TK ≳ 15 K in the outer regions of R Sct.
The Keplerian velocity of the disk (Eq. (4)) is compatible with a central stellar mass of 1.7 M⊙. The total mass derived from our best-fit model is ~3.2 × 10⁻² M⊙ with a disk mass of ~8.5 × 10⁻³ M⊙.
We considered other options for the shape of the outflow, for instance similar to the adopted model for 89 Her (Sect. 5.2). However, we ruled out this option because regardless of the orientation we choose for the hourglass, the result is not consistent with the observational data. Significant changes in the size of the empty regions in the outflow lobes also lead to unacceptable predictions.
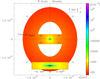 |
Fig. 18 Structure and distribution of the density of our best-fit model for the disk and outflow of R Sct. The lower inset shows a zoom into the inner region of the nebula where the Keplerian disk presents density values ≥106 cm−3. The expansion velocity is represented with arrows. |
5.5 Uncertainties of the model parameters
Due to the relatively low angular resolution of the observational data, some of the nebula properties are not precisely determined. In particular, owing to the insufficient angular resolution and the inclination of the disk with respect to the plane of the sky, the height of the rotating disk is not well determined in all cases, the angular resolution being the basic estimate of the uncertainty for these parameters. On the contrary, the radius of the disk is better measured. This parameter is derived from the observational data and is confirmed with the best-fit model. The width of the disk (twice the height) is limited by the angular resolution and, often more restrictively, by the disk radius, because the disk width in real cases is significantly smaller than its equatorial size. For instance, we know that the disk width of 89 Her must be ≲3 × 1015 cm (equivalent to 0.″2, smaller than the angular resolution).
The structure of the outflow is well determined in the case of 89 Her, because the hourglass-shaped structure is absolutely clear in the observational data. In the case of R Sct, its extended outflow structure with cavities is clear according to the velocity maps. The maps of IRAS 19125+0343 do not allow us to determine the shape of the outflow in detail, and only the extent along the symmetry axis is actually measured. We present a simple model to explain the observations of this source, as well as an alternative model similar to those used in R Sct and many pPNe which is also compatible with the data and serves to demonstrate the uncertainties in the structure of IRAS 19125+0343. The case of the outflow of AC Her is complex. We detect weak emission of the extended component in the PV diagrams, but the shape of the outflow is not well determined. For this reason we assume properties and shape similar to those of the Red Rectangle as they are similar objects. These assumptions clearly increase the uncertainty of our results and we can only give an approximate upper limit to the mass of the outflow.
Other uncertainties in the modeling also affect our main results, and particularly crucial for our discussion is the determination of the mass of the various components. From a comparison of several alternative models, we see that the assumed nebular gas distribution affects the derived mass values only slightly. The derived density distribution and mass are inversely proportional to the assumed CO abundances. The values we adopted, X(12CO) ~ 1 − 2 × 10−4 and X(13CO) ~ 2 × 10⁻⁵, have been extensively studied in previous works on those post-AGB sources (Bujarrabal et al. 1990, 2013a, 2016) and are accurate to within less than a factor of two. The dependence of the mass on the gas temperature is lower, less than proportional (see detailed discussion in Bujarrabal et al. 2013a). Our temperature distributions are again very similar to those usually found in these objects and are constrained by the observed brightness in optically thick areas (where the brightness is almost equal to the gas temperature after correcting for dilution within the beam). The effects of the temperature on the mass determination uncertainty are therefore a minor contribution.
The distances of these objects are very uncertain and affect other parameters of the models. The size of the nebula determined by the model scales linearly with distance d. The density varies with d−1 because the column density must be conserved to yield the same optical depth in all lines of sight. A change of distance or density implies that the volume of the nebula also changes, which implies that the mass of the nebula varies. The mass scales with d2. According to the model, the typical values of temperature T and velocity field are not affected by a change in the distance. These dependencies on the distance are those usually encountered when modeling nebulae.
Physical conditions in the molecular disk and outflow of R Sct derived from the model fitting of the CO data.
6 Conclusions
We present interferometric NOEMA maps of 12CO and 13CO J = 2–1 in 89 Her and 12CO J = 2–1 in AC Her, IRAS 19125+0343, and R Sct. These objects belong to the binary post-AGB stars sample with NIR excess, and are thought to be surrounded by rotating disks and outflowing disk winds that show axial and equatorial symmetry (see Sect. 1). We carefully modeled our observations and find that they are always compatible with this paradigm. The masses and sizes derived from our model fitting are given in Table 7.
AC Her
Our maps are more sensitive than previously published ones (Bujarrabal et al. 2015). The goal of this work is to study the presence of an extended outflowing component whose presence is not obvious in the observation. The PV diagram along PA = 136.1° (nebula equator) is exactly coincident with Keplerian dynamics. To study the presence of the outflow we analyzed the observational data in detail and tentatively detect its emission: ≲10 mJy beam−1 km s−1. The disk radius is 1.4 × 1016 cm. We find densities between 105 and 107 cm−3 and temperatures between 20 and 200 K. The rotational velocity field is purely Keplerian in the disk and is compatible with a central (total) stellar mass of ~1 M⊙. The mass of the disk is 8.1 × 10⁻⁴ M⊙, the same value as in previous works: ~8 × 10⁻⁴ M⊙ from single-dish observations (Bujarrabal et al. 2013a) with d = 1100 pc (same as in this work); 1.5 × 10⁻³ M⊙ from mm-wave interferometric observations (Bujarrabal et al. 2015) with d = 1600 pc (which implies ~8 × 10⁻⁴ M⊙ rescaling to the distance of this work). We modeled an extended structure that surrounds the disk, assuming a structure similar to the one found in the Red Rectangle. We find that the mass of the outflow must be ≲5% of the total mass. We conclude that AC Her is clearly a binary post-AGB star surrounded by a disk-dominated nebula, because ≳95% of the total mass corresponds to the disk. However, even more sensitive maps will be necessary to confirm our model of the low-mass and extended component of AC Her.
89 Her
We can see an extended hourglass-like structure in the velocity maps and PV diagrams. The detected outflow emission corresponds to a size of 1.5 × 1017 cm. We can also see a central clump of strong emission with relatively low dispersion of velocity, which we think that a Keplerian disk must be responsible for. Due to the limited spatial resolution, we cannot resolve the inner structure of the disk. We find that the line profile from the most central compact component, which arises from the unresolved Keplerian disk and very inner outflow, shows the characteristic double-peak shape of rotating disks (see Sect. 4.2 and Appendix B). The PV diagram along the nebula equator, PA ~ 150°, is compatible with characteristics of Keplerian dynamics, and we derive the main properties of the rotating disk directly from the model fitting. We find that the disk radius must be ≤6 × 1015 cm and Keplerian rotation that is compatible with a central stellar mass of 1.7 M⊙. The nebula of 89 Her contains a total mass of 1.4 × 10⁻² M⊙, of which theoutflow is responsible for 41–53% (see Sect. 5.2).
Mass and size values for the disk and outflow of our post-AGB stars sample.
IRAS 19125+0343
We cannot resolve the disk structure in our data. We developed a model with a rotating disk with Keplerian dynamics surrounded by an outflow ~5.0 × 1016 cm in size in the axial direction, which is completely consistent with the observations. We find that the disk radius must be ≤ 6.0 × 1015 cm. The Keplerian rotation of IRAS 19125+0343 is compatible with a central stellar mass of 1.1 M⊙. However, we note that the disk structure and dynamics are particularly difficult to study from our observations and that the results on this object are less reliable; the existence of an inner rotating disk is mostly based on our experience in the analysis of single-dish profiles and the satisfactory model fitting (see Sect. 5.3). Observations with higher resolution are required in order to confirm these results. The total mass of the nebula of IRAS 19125+0343 is 1.1 × 10⁻² M⊙ (1.3 × 10⁻² M⊙ in the alternative model), of which 3.3 × 10⁻³ M⊙ correspondsto the Keplerian disk mass, meaning that ~71% (~74%) of the total mass conforms the outflow escaping from the Keplerian disk. Therefore, IRAS 19125+0343 is an outflow-dominated post-AGB nebula.
R Sct
Velocity maps and PV diagrams show strong emission from an inner region, which has a relatively low velocity dispersion. This central clump is not resolved in our maps and the interpretation of the central emission in this source is less reliable than for our other sources; see Sect. 4.4. Nevertheless, we think that this condensation is probably an unresolved rotating disk, as also argued in Sect. 4.4, according to the velocity dispersion and slight redshift, comparable to those observed in similar sources, and that our models easily reproduce its observational properties. In addition, we find a line profile coming from the very central region of the nebula that shows the characteristic double peak shape of rotating disks (see Sect. 4.4 and Appendix B). The nature of R Sct is not yet clear (Sect. 2.4), but our observations strongly suggest that R Sct is also a post-AGB star surrounded by a Keplerian disk (and by a high-mass extended outflow). Therefore, we suspect a binary nature for the central star of R Sct. We present the model composed of a compact rotating disk with Keplerian dynamics and an outflow. The outflow shows two cavities that are clearly identified in the observations and are very extended, ~5.2 × 1017 cm. The main properties of the disk derived from the model are necessarily uncertain. The disk radius is ≤1.5 × 1016 cm and the Keplerian rotation is compatible with a central stellar mass of 1.7 M⊙. The total mass of the nebula is ~3.2 × 10⁻² M⊙. Taking into account that the disk represents 26.5% of the total mass and the large size of the outflow (compared with other similar objects), it is clear that R Sct is an outflow-dominated post-AGB nebula. Although the presented results are consistent with the observational data, it would be necessary to observe R Sct with higher resolution to resolve the disk and firmly conclude on the nature of the source.
Based on the presented results for 89 Her, IRAS 19125+0343, and R Sct, we conclude that there is a new subclass of binary post-AGB stars with NIR excess: the outflow-dominated nebulae. These present massive outflows, even more massive than their disks. These outflows are mostly composed of cold gas. There are other single-dish observed sources, such as AI CMi and IRAS 20056+1834, that present narrow CO line profiles with strong wings. These could also belong to this new subclass. We also observed AC Her, where the outflow is barely detected. We estimate an upper limit to its mass of ≲5% of the total mass, which is even smaller than those of the disk-dominated subclass (the Red Rectangle, IW Carinae, and IRAS 08544−4431). 89 Her is an intermediate source in between disk-dominated and outflow-dominated nebula.
Acknowledgements
We are grateful to the anonymous referee for the relevant recommendations and comments. This work is based on observations of IRAM telescopes. IRAM is supported by INSU/CNRS (France), MPG (Germany), and IGN (Spain). This work is part of the AxiN and EVENTs / NEBULAE WEB research programs supported by Spanish AEI grants AYA 2016-78994-P and PID2019-105203GB-C21. I.G.C. acknowledges Spanish MICIN the funding support of BES2017-080616.
Appendix A Flux comparison
A.1 NOEMAvs. 30 m
Here, we show the comparison between the interferometric flux and the single-dish integrated flux (data taken from Bujarrabal et al. 2013a). In the case of AC Her, no significant amount of flux was filtered out in the interferometric data (Fig. A.1). The flux loss in 12CO J = 2–1 is ~30 and ~50% in the wings of 13CO J = 2–1 for 89 Her (Figs. A.2 and A.3, respectively). In the case of IRAS 19125+0343, the interferometric visibilities were merged with zero-spacing data obtained with the 30 m IRAM telescope, which guarantees that there is not lost flux in final maps. There is no flux loss for R Sct, because our NOEMA observations were merged with large single-dish maps.
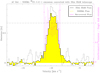 |
Fig. A.1 Comparison of the NOEMA flux (yellow histogram) of 12CO J = 2–1 with 30 m observation (white histogram) for AC Her. The points show the recovered flux across velocity channels (right vertical axis), with error bars including uncertainties in the calibration of both instruments. |
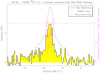 |
Fig. A.2 Comparison of the NOEMA flux (yellow histogram) of 12CO J = 2–1 with 30 m observation (white histogram) for 89 Her. The points show the recovered flux across velocity channels (right vertical axis), with error bars including uncertainties in the calibration of both instruments. |
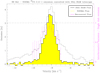 |
Fig. A.3 Comparison of the NOEMA flux (yellow histogram) of 13CO J = 2–1 with 30 m observation (white histogram) for 89 Her. The points show the recovered flux across velocity channels (right vertical axis), with error bars including uncertainties in the calibration of both instruments. |
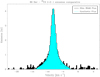 |
Fig. A.4 Comparison between the 30 m IRAM 13CO J = 2–1 line profile (black histogram) and the synthetic one (cyan histogram). The synthetic line profile corresponds to the model after increasing the width of the hourglass of the standard model. |
A.2 Flux lossin 89 Her: implications for the mass value
In this appendix, we present the synthetic 13CO J = 2–1 emission convolved with the 30 m IRAM telescope for 89 Her (see Fig. A.4) compared with the observational data (obtained from Bujarrabal et al. 2013a). The flux derived of the standard model (see Table 4) is undervalued. We focus our analysis on 13CO J = 2–1, which is a transition that is more sensitive to density than 12CO J = 2–1. After increasing the width of the outflow walls of our standard model by ~70%, we see that we can recover the lost flux. Therefore, we conclude that the mass derived from this modified model, 1.4 × 10⁻² M⊙, is realistic (see Sect. 5.2 and Table 4).
Appendix B Analyzing the inner region of the nebulae
In this appendix, we show the observational line profile from the central component of the nebula of 89 Her, IRAS 19125+0343, and R Sct (see Fig. B.1). The lines of 89 Her and IRAS 19125+0343 come from maps in which longer baselines are favored. The line of R Sct come from interferometric maps without the 30 m IRAM telescope contribution. In addition, all these selected spectra come from the most inner region because we select a central region with the size of the beam. For these reasons, only a fraction of the total flux can be seen. We tentatively see the double peak line profile in the case of 89 Her and R Sct. We must clarify that it is impossible to distinguish the disk emission from emission and absorption of the innermost and dense outflow gas, which limits the reach of our discussion. In the case of IRAS 19125+0343 we cannot see the double-peak shape in the line profile. We think that the inclination of the disk with the line of sight (130°, see Sect. 5.3) must be a key factor to explain the absence of that double peak in this case because this profile shape tends to disappear for face-on disks. We remind the reader that AC Her, for instance, clearly presents a disk with Keplerian rotation and there is no sign of that effect in its single-dish CO line profiles (see Bujarrabal et al. 2013a).
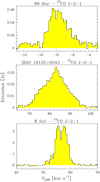 |
Fig. B.1 Observational line profiles of 89 Her (top), IRAS 19125+0343 (middle), and R Sct (bottom) from the innermost region of each nebulae. See main text for details. |
Appendix C Detailed analysis of AC Her maps
This Appendix explains how we estimate the exact position angle that best reveals the Keplerian dynamics of the rotating disk. We also calculate an upper limit to the outflow emission through the observational data. We developed a code that allows us to analyze the emission of a rotating disk and is adapted to the case of disk-dominated pPNe such as AC Her (see Sect. 4.1 and previous works).
Figure C.1 shows PV diagrams of AC Her along different PA. The PA is indicated in the top right corner of each panel. We have drawn hyperbolic functions (r−1∕2) in each panel to help in the visual inspection. Additionally, we divided each panel in four quadrants (Qi), which are enumerated in order (counter clockwise starting from the upper right quadrant).
A disk with Keplerian dynamics must show the typical and well-known “butterfly” shape in the PV diagram along the equatorial direction. Therefore, in an ideal situation (pure Keplerian rotation and infinite spatial resolution), the emission should only appear in two opposite quadrants. The same applies for the case of a bipolar outflow with linear velocity gradient, but when we take the PV diagram along the symmetry axis. On the contrary, in an isotropically expanding envelope, the emission should be the same in all four quadrants regardless of the orientation. In our case here, a source dominated by the central rotating disk, we can use these properties to infer the orientation of the major axes of the nebula, equatorial and axial, by finding the PA that maximizes the emission in two opposite quadrants, QI and QIII for instance, with respect to the other two. The emission in each quadrant Qi has been spatially averaged and added in velocity. This emission along different PA is shown in Fig. C.2 with red dots (QI + QIII emission). We derived this PA by the numerical fitting of a sinusoidal function. The optimal value is found to be 136.1° ± 1.4°.
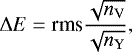
The presence of a putative outflow should be present in the PV diagram along the nebula axis. The PA along the nebula axis will be 46.1° because the PA along the equator disk is 136.1°. The theoretical PV diagram along the nebula axis in the presence of a rotating disk must show emission with a form similar to a rhombus with equal emission in all four quadrants. The subtraction of QI + QIII emission (red dots) from QII + QIV emission (blue dots) removes the disk contribution emission (“Outflow” in black dots in Fig. C.2) and reveals excess emission. The emission of an outflow will be the one of “Outflow” at PA = 46.1°. The excess emission at this PA is 8.3 mJy beam−1 km s−1. Taking into account the uncertainty of the PA, the different values of PA = 44.7° and PA = 47.5° are measurements of the derived outflow intensity. Thus, we find that the excess emission that we attribute to the outflow emission is 8.3 mJy beam−1 km s−1. We must highlight that the three different PAs present positive emission. In addition, the formal error for the trigonometrical fitting yields an uncertainty of 2.4 mJy beam−1 km s−1, which is highly consistent with the previous calculated uncertainty.
There is another option to estimate the emission of the putative outflow through the PV diagram along the nebula axis. We see how the emission at central velocities is inclined in the right panel of Fig. 2. We see an excess emission in quadrants QI and QIII, with central velocities of ± 0.5 km s−1 and extreme offsets of ± 0.″8. This excess emission could be explained by the presence of an outflow. Taking into account the emission (~10 mJy beam−1) and the width of that emission in terms of velocity (~0.75 km s−1), the putative outflow presents an emission of ~10 mJy beam−1 km s−1. The uncertainty for this value, ΔE, is:
 (C.1)
(C.1)
where rms is the noise of the map (4.8 mJy beam−1), nV is the number of velocity channels used in that region (~0.75 km s−1 / 0.2 km s−1 = 3.8), and nY is the number of position channels in that region (0.″5 / 0.″07 = 7.1). We find ΔE = 3.5 mJy beam−1 km s−1. Therefore, we conclude that the emission of the outflow is 10 ± 3.5 mJy beam−1 km s−1.
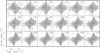 |
Fig. C.1 AC Her position–velocity diagrams found along different position angles from 0° to 170° with a step of 10°. The PA is indicated in each panel in the top right corner. The name of each quadrant is indicated in the panel showing the first velocity channel. Contours are the same as in the corresponding channel maps (Fig. 1). To help in the identification of the Keplerian dynamics, we show hyperbolic functions in each panel. |
 |
Fig. C.2 Variation of the emission of the first and third quadrants (QI and QIII in red dots) and the second and fourth quadrants (QII and QIV in blue dots)with the PA for our observation of AC Her (see Fig. C.1). The maximum emission of the mean of QI and QIII indicates thePA, for which the rotational effect of the Keplerian dynamics along the nebula equator are best detected. The angle found is: PA = 136.1°. The subtraction of what we name QI + QIII and QII + QIV shows the excess emission of the putative outflow along the nebula axis (black dots). We use thesame colors as in Fig. C.1. The magenta dotted lines represents PA = 46.1° and PA= 136.1°. These PA values represent the cut along the nebula axis and equator, respectively. The emission of the putative outflow is represented as a star at PA = 46.1° ± 1.4°. The error bar is the same for each point. The emission at the PA along the nebula axis is shown in the inset of the right corner. |
We obtained very close values for the outflow emission through two very different methods, which reinforces our conclusions about the presence of an extended outflow in AC Her. Therefore, we consider the outflow tentatively detected with an emission of ≲10 mJy beam−1 km s−1.
Appendix D Outflow kinetic and rotational temperatures
The sources studied in this work present relatively massive and extended outflows, which show low rotational temperatures (see Sects. 5.2–5.4). When densities are very low, these rotational temperatures may significantly depart from the kinetic ones. We must remember that “excitation temperature” is always defined as an equivalent temperature for a given line, while “rotational temperature” is defined as the typical value or average of the excitation temperatures of the relevant rotational lines (in our case, low-J transitions including the observed one), and is used to approximately calculate the partition function and the absorption and emission coefficients. In the limit of thermalization (LTE), which is attained for sufficiently high densities, all excitation temperatures are the same, and equal to the rotational and kinetic temperatures.
In Fig. D.1 we present theoretical estimates of the equivalence between kinetic temperatures (TK) and excitation temperatures (Tex) for relevant lines as a function of density. (In the case of very low excitation temperatures, <10 K, only the three lowest levels of CO are significantly populated.) To perform these calculations, we used a standard LVG code very similar to that described for example by Bujarrabal & Alcolea (2013), with the simplest treatment of the velocity field, taking logarithmic velocity gradient to be equal to 1. Three cases are considered, very low optical depths, optically thick case, and calculations with intermediate optical depths. In the optically thick and intermediate opacity cases, we varied the characteristic lengths of the considered regions at the same time as the density, in order to keep opacities of ~10 and 1, respectively.
 |
Fig. D.1 Estimates of the equivalent excitation temperature as a function of the kinetic temperature and the density for J = 2–1 (top) and J = 1–0 (bottom) transitions. |
As we can see, for larger density values we find that Tex= TK. However, for lower density values we find Tex < TK, as expected.In some cases, the difference is significant; for the very diffuse extended layers around R Sct, a rotational temperature of ~7 K corresponds to kinetic temperatures of over ~15 K.
Appendix E Additional figures of model calculation
In this appendix, we show the maps and PV diagrams derived from models for the four analyzed sources. We present the synthetic velocity maps of AC Her for 12CO J = 2–1 (see Fig. E.2) for our best-fit model (Sect. 5.1). Additionally, we show synthetic velocity maps and PV diagrams along the equator and nebula axis for a disk-only model (the standard model of Table 3 and Fig. 11 without the outflow) in Figs. E.2 and E.3. We also show an alternative model of AC Her where the size of the outflow is somewhat larger than the standard one (see Figs. E.11, E.4, and E.5), both cases being compatible with observations.
We present synthetic velocity maps of 89 Her for 12CO and 13CO J = 2–1 emission for our best-fit model (see Sect. 5.2 and Fig. E.6). The hourglass-shaped structure is present in the synthetic velocity maps for 12CO and 13CO J = 2–1. We show velocity maps of IRAS 19125+0343 for 12CO J = 2–1 (see Fig. E.7) of our best-fit model (see Sect. 5.3). Additionally, we present synthetic velocity maps for the alternative model of IRAS 19125+0343 and PV diagrams along the equator disk and nebula axis (see Fig. E.8, E.9, and E.12).
We present synthetic velocity maps of R Sct for 12CO J = 2–1 for our best-fit model (see Fig. E.10 and Sect. 5.4). These maps are similar to those of Fig. 8. We note that cavities of the extended outflow are also present.
 |
Fig. E.1 Synthetic maps predicted by the alternative model of the 12CO J = 2–1 line emission for the nebula around AC Her. To be compared with Fig. 1, the scales and contours are the same. |
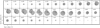 |
Fig. E.2 Synthetic maps predicted by the disk-only model of the 12CO J = 2–1 line emission for the nebula around AC Her. To be compared with Fig. 1, the scales and contours are the same. |
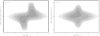 |
Fig. E.3 Left: synthetic position-velocity diagram from our disk-only best-fit model of 12CO J = 2–1 in AC Her along the direction PA = 136.1°. To be compared with the left panel of Fig. 2, the scales and contours are the same. Right: same as in left but along PA = 46.1°. |
 |
Fig. E.4 Synthetic maps predicted by the alternative model of the 12CO J = 2–1 line emission for the nebula around AC Her. To be compared with Fig. 1, the scales and contours are the same. |
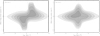 |
Fig. E.5 Left: synthetic position-velocity diagram from our best-fit alternative model of 12CO J = 2–1 in AC Her with an outflow. To be compared with Fig. 2, the scales and contours are the same. Right: same as in left but along PA = 46.1°. |
 |
Fig. E.6 Synthetic maps predicted by the model of the 12CO J = 2–1 line emission(top) and 13CO J = 2–1 (bottom) for the nebula around 89 Her. To be compared with Fig. 3, the scales and contours are the same. |
 |
Fig. E.7 Synthetic maps predicted by the model of the 12CO J = 2–1 line emission for the nebula around IRAS 19125+0343. To be compared with Fig. 6, the scales and contours arethe same. |
 |
Fig. E.8 Same as in Fig. E.7 but for the alternative model. To be compared with Fig. 6, the scales and contours are the same. |
 |
Fig. E.9 Left: synthetic position-velocity diagram from our alternative best-fit model of 12CO J = 2–1 in IRAS 19125+0343 along the direction PA = −40°. To be compared with the left panel of Fig. 7, the scales and contours are the same. Right: same as in left but along PA = 50°. |
 |
Fig. E.10 Synthetic maps predicted by the model of the 12CO J = 2–1 line emission for the nebula around R Sct. To be compared with Fig. 8, the scales and contours and units are the same. |
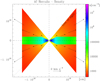 |
Fig. E.11 Structure and distribution of the density of our alternative best-fit model for the disk and outflow of AC Her. The Keplerian disk presents density values ≥105 cm−3. The expansion velocity is represented with arrows. |
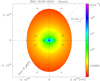 |
Fig. E.12 Structure and distribution of the density of our best-fit alternative model for the disk and outflow of IRAS 19125+0343. The Keplerian disk presents density values ≥106 cm−3. The expansion velocity is represented with arrows. |
References
- Alcolea, J., & Bujarrabal, V. 1991, A&A, 245, 499 [NASA ADS] [Google Scholar]
- Alcolea, J., & Bujarrabal, V. 1995, A&A, 303, L21 [NASA ADS] [Google Scholar]
- Alcolea, J., Neri, R., & Bujarrabal, V. 2007, A&A, 468, L41 [NASA ADS] [CrossRef] [EDP Sciences] [Google Scholar]
- Bailer-Jones, C. A. L., Rybizki, J., Fouesneau, M., Mantelet, G., & Andrae, R. 2018, AJ, 156, 58 [NASA ADS] [CrossRef] [Google Scholar]
- Blackman, E. G., & Lucchini, S. 2014, MNRAS, 440, L16 [Google Scholar]
- Bujarrabal, V., & Alcolea, J. 2013, A&A, 552, A116 [NASA ADS] [CrossRef] [EDP Sciences] [Google Scholar]
- Bujarrabal, V., Alcolea, J., & Bachiller, R. 1990, A&A, 234, 355 [NASA ADS] [Google Scholar]
- Bujarrabal, V., Castro-Carrizo, A., Alcolea, J., & Sánchez Contreras, C. 2001, A&A, 377, 868 [NASA ADS] [CrossRef] [EDP Sciences] [Google Scholar]
- Bujarrabal, V., Castro-Carrizo, A., Alcolea, J., & Neri, R. 2005, A&A, 441, 1031 [NASA ADS] [CrossRef] [EDP Sciences] [Google Scholar]
- Bujarrabal, V., van Winckel, H., Neri, R., et al. 2007, A&A, 468, L45 [NASA ADS] [CrossRef] [EDP Sciences] [Google Scholar]
- Bujarrabal, V., Alcolea, J., Van Winckel, H., Santander-García, M., & Castro-Carrizo, A. 2013a, A&A, 557, A104 [NASA ADS] [CrossRef] [EDP Sciences] [Google Scholar]
- Bujarrabal, V., Castro-Carrizo, A., Alcolea, J., et al. 2013b, A&A, 557, L11 [NASA ADS] [CrossRef] [EDP Sciences] [Google Scholar]
- Bujarrabal, V., Castro-Carrizo, A., Alcolea, J., & Van Winckel, H. 2015, A&A, 575, L7 [NASA ADS] [CrossRef] [EDP Sciences] [Google Scholar]
- Bujarrabal, V., Castro-Carrizo, A., Alcolea, J., et al. 2016, A&A, 593, A92 [NASA ADS] [CrossRef] [EDP Sciences] [Google Scholar]
- Bujarrabal, V., Castro-Carrizo, A., Alcolea, J., et al. 2017, A&A, 597, L5 [NASA ADS] [CrossRef] [EDP Sciences] [Google Scholar]
- Bujarrabal, V., Castro-Carrizo, A., Van Winckel, H., et al. 2018, A&A, 614, A58 [NASA ADS] [CrossRef] [EDP Sciences] [Google Scholar]
- Castro-Carrizo, A., Bujarrabal, V., Sánchez Contreras, C., Alcolea, J., & Neri, R. 2002, A&A, 386, 633 [NASA ADS] [CrossRef] [EDP Sciences] [Google Scholar]
- Castro-Carrizo, A., Quintana-Lacaci, G., Neri, R., et al. 2010, A&A, 523, A59 [NASA ADS] [CrossRef] [EDP Sciences] [Google Scholar]
- De Marco, O., & Izzard, R. G. 2017, PASA, 34, e001 [Google Scholar]
- de Ruyter, S., van Winckel, H., Maas, T., et al. 2006, A&A, 448, 641 [NASA ADS] [CrossRef] [EDP Sciences] [Google Scholar]
- Dominik, C., Dullemond, C. P., Cami, J., & van Winckel, H. 2003, A&A, 397, 595 [NASA ADS] [CrossRef] [EDP Sciences] [Google Scholar]
- Fong, D., Meixner, M., Sutton, E. C., Zalucha, A., & Welch, W. J. 2006, ApJ, 652, 1626 [Google Scholar]
- Frank, A., & Blackman, E. G. 2004, ApJ, 614, 737 [Google Scholar]
- Gezer, I., Van Winckel, H., Bozkurt, Z., et al. 2015, MNRAS, 453, 133 [Google Scholar]
- Gielen, C., Bouwman, J., van Winckel, H., et al. 2011, A&A, 533, A99 [NASA ADS] [CrossRef] [EDP Sciences] [Google Scholar]
- Gielen, C., van Winckel, H., Min, M., Waters, L. B. F. M., & Lloyd Evans, T. 2008, A&A, 490, 725 [NASA ADS] [CrossRef] [EDP Sciences] [Google Scholar]
- Gueth, F., Guilloteau, S., & Bachiller, R. 1996, A&A, 307, 891 [NASA ADS] [Google Scholar]
- Guilloteau, S., Di Folco, E., Dutrey, A., et al. 2013, A&A, 549, A92 [NASA ADS] [CrossRef] [EDP Sciences] [Google Scholar]
- Hillen, M., Verhoelst, T., Van Winckel, H., et al. 2013, A&A, 559, A111 [NASA ADS] [CrossRef] [EDP Sciences] [Google Scholar]
- Hillen, M., Menu, J., Van Winckel, H., et al. 2014, A&A, 568, A12 [NASA ADS] [CrossRef] [EDP Sciences] [Google Scholar]
- Hillen, M., de Vries, B. L., Menu, J., et al. 2015, A&A, 578, A40 [NASA ADS] [CrossRef] [EDP Sciences] [Google Scholar]
- Hillen, M., Van Winckel, H., Menu, J., et al. 2017, A&A, 599, A41 [NASA ADS] [CrossRef] [EDP Sciences] [Google Scholar]
- Jura, M. 2003, ApJ, 582, 1032 [Google Scholar]
- Kalaee, M. J.,& Hasanzadeh, A. 2019, New A, 70, 57 [Google Scholar]
- Kluska, J., Van Winckel, H., Hillen, M., et al. 2019, A&A, 631, A108 [NASA ADS] [CrossRef] [EDP Sciences] [Google Scholar]
- Matsuura, M., Yamamura, I., Zijlstra, A. A., & Bedding, T. R. 2002, A&A, 387, 1022 [NASA ADS] [CrossRef] [EDP Sciences] [Google Scholar]
- Oomen, G.-M., Van Winckel, H., Pols, O., et al. 2018, A&A, 620, A85 [NASA ADS] [CrossRef] [EDP Sciences] [Google Scholar]
- Oomen, G.-M., Van Winckel, H., Pols, O., & Nelemans, G. 2019, A&A, 629, A49 [CrossRef] [EDP Sciences] [Google Scholar]
- Pollard, K. R., Cottrell, P. L., Lawson, W. A., Albrow, M. D., & Tobin, W. 1997, MNRAS, 286, 1 [Google Scholar]
- Sahai, R., Claussen, M. J., Schnee, S., Morris, M. R., & Sánchez Contreras, C. 2011, ApJ, 739, L3 [Google Scholar]
- Shenton, M., Evans, A., & Williams, P. M. 1995, MNRAS, 273, 906 [Google Scholar]
- Soker, N. 2002, ApJ, 568, 726 [Google Scholar]
- Tessore, B., Lèbre, A., & Morin, J. 2015, in SF2A-2015: Proceedings of the Annual meeting of the French Society of Astronomy and Astrophysics, 429–433 [Google Scholar]
- Van Winckel, H. 2003, ARA&A, 41, 391 [Google Scholar]
- Van Winckel, H. 2018, ArXiv e-prints [arXiv:1809.00871] [Google Scholar]
All Tables
Physical conditions in the molecular disk and outflow of AC Her derived from the model fitting of the CO data.
Physical conditions in the molecular disk and outflow of 89 Her derived from the model fitting of the CO data.
Physical conditions in the molecular disk and outflow of IRAS 19125+0343 derived from the model fitting of the CO data.
Physical conditions in the molecular disk and outflow of R Sct derived from the model fitting of the CO data.
All Figures
|
Fig. 1 NOEMA maps per velocity channel of 12CO J = 2–1 emission from AC Her. The beam size (HPBW) is 0.″35 × 0.″35. The contour spacing is logarithmic: ±9, 18, 36, 76, and 144 mJy beam−1 with a maximum emission peak of 230 mJy beam−1. The LSR velocity is indicated in the upper left corner of each velocity-channel panel and the beam size is shown in the last panel. |
| In the text | |
|
Fig. 2 Left: position–velocity diagram from our NOEMA maps of 12CO J = 2–1 in AC Her along the direction PA = 136.1°, corresponding to the nebula equator. The contour spacing is logarithmic: ±9, 18, 36, 76, and 144 mJy beam−1 with a maximum emission peak of 230 mJy beam−1. The dashedlines show the approximate central position and systemic velocity. Right: same as in left but along the perpendicular direction PA = 46.1°. |
| In the text | |
|
Fig. 3 Top: NOEMA maps per velocity channel maps of 12CO J = 2–1 from 89 Her. The beam size (HPBW) is 1.″02 × 0.″83, the major axis being oriented at PA = 115°. The contour spacing is logarithmic: ± 70, 140, 280, and 560 mJy beam−1 with a maximum emission peak of 870 mJy beam−1. Bottom: same as in top but for 13CO J = 2–1. The beam size (HPBW) is 0.″74 × 0.″56, the major axis being oriented at PA = 28°. The contour spacing is logarithmic: ± 11, 22, 44, 88, and 144 mJy beam−1 with a maximum emission peak of 225 mJy beam−1. The LSR velocity is indicated in the upper left corner of each velocity-channel panel and the beam size is shown in the last panel. |
| In the text | |
|
Fig. 4 Left: position–velocity diagram from our NOEMA maps of 12CO J = 2–1 in 89 Her along the direction PA = 150°, corresponding to the nebula equator. The contour spacing is logarithmic: ± 70, 140, 280, and 560 mJy beam−1 with a maximum emission peak of 870 mJy beam−1. The dashed lines show the approximate central position and systemic velocity. The beam is represented in the last panel. Right: same as in left but along PA = 60°. |
| In the text | |
|
Fig. 5 Left: same as Fig. 4 (left) but for 13CO J = 2–1 emission. The contours are ± 11, 22, 44, 88, and 144 mJy beam−1 with a maximum emission peak of 225 mJy beam−1. The dashed lines show the approximate centroid in velocity and position. Right: same as in left but along the perpendicular direction PA = 60°. |
| In the text | |
|
Fig. 6 Maps per velocity channel of 12CO J = 2–1 emission from IRAS 19125+0343. The beam size (HPBW) is 0.″70 × 0.″70. The contour spacing is logarithmic: ±20, 40, 80, 160, and 320 mJy beam−1 with a maximum emission peak is 413 mJy beam−1. The LSR velocity is indicated in the upper left corner of each velocity-channel panel and the beam size is shown in the last panel. |
| In the text | |
|
Fig. 7 Left: position–velocity diagram from our maps of 12CO J = 2–1 in IRAS 19125+0343 along the direction PA = −40°, corresponding to the nebula equator. The contour spacing is logarithmic: ±40, 80, 160, and 320 mJy beam−1 with a maximum emission peak of 413 mJy beam−1. The dashedlines show the approximate central position and systemic velocity. Right: same as in left but along the perpendicular direction PA = 50°. |
| In the text | |
|
Fig. 8 Maps per velocity channel of 12CO J = 2–1 emission from R Sct. The beam size (HPBW) is 3.″12 × 2.″19, the major axis oriented at PA = −185°. The contour spacing is logarithmic: ± 50, 100, 200, 400, 800 and 1600 mJy beam−1 with a maximum emission peak of 2.4 Jy beam−1. The LSR velocity is indicated in the upper left corner of each velocity-channel panel and the beam size is shown in the last panel. |
| In the text | |
|
Fig. 9 Left: position–velocity diagram from our maps of 12CO J = 2–1 in R Sct along the direction PA = 0°, corresponding to the nebula equator. The contour spacing is logarithmic: ± 25, 50, 100, 200, 400, 800, and 1600 mJy beam−1 with a maximum emission peak of 2.4 Jy beam−1. The dashedlines show the approximate central position and systemic velocity. Right: same as in left but along the perpendicular direction PA = 90°. |
| In the text | |
|
Fig. 10 Left: synthetic PV diagram from our best-fit model of 12CO J = 2–1 in AC Her with an outflow. For ease of comparison with Fig. 2 the scales and contours are the same. Right: same as in left but along PA = 46.1°. |
| In the text | |
|
Fig. 11 Structure and distribution of the density of our best-fit model for the disk and outflow of AC Her. The Keplerian disk presentsdensity values ≥105 cm−3. The expansion velocity is represented with arrows. |
| In the text | |
|
Fig. 12 Structure and distribution of the density of our best-fit model for the disk and outflow of 89 Her. The lower inset shows a zoom into the inner region of the nebula where the Keplerian disk presents density values ≥107 cm−3. The expansion velocity is represented with arrows. |
| In the text | |
|
Fig. 13 Left: synthetic PV diagram from our best-fit model of 12CO J = 2–1 in 89 Her along the direction PA = 150°. To be compared with the left panel of Fig. 4, the scales and contours are the same. Right: same as in left but along PA = 60°. |
| In the text | |
|
Fig. 14 Same as in Fig. 13 but for 13CO J = 2–1. To be compared with Fig. 5, the scales and contours are the same. |
| In the text | |
|
Fig. 15 Left: synthetic PV diagram from our best-fit model of 12CO J = 2–1 in IRAS 19125+0343 along the direction PA = −40°. To be compared with the left panel of Fig. 7, the scales and contours are the same. Right: same as in left but along PA = 50°. |
| In the text | |
|
Fig. 16 Structure and distribution of the density of our best-fit model for the disk and outflow of IRAS 19125+0343. The Keplerian disk presents density values ≥106 cm−3. The expansion velocity is represented with arrows. |
| In the text | |
|
Fig. 17 Left: synthetic PV diagram from our best-fit model of 12CO J = 2–1 in R Sct along the direction PA = 0°. To be compared with the left panel of Fig. 9, the scales and contours are the same. Right: same as in left but along PA = 90°. |
| In the text | |
|
Fig. 18 Structure and distribution of the density of our best-fit model for the disk and outflow of R Sct. The lower inset shows a zoom into the inner region of the nebula where the Keplerian disk presents density values ≥106 cm−3. The expansion velocity is represented with arrows. |
| In the text | |
|
Fig. A.1 Comparison of the NOEMA flux (yellow histogram) of 12CO J = 2–1 with 30 m observation (white histogram) for AC Her. The points show the recovered flux across velocity channels (right vertical axis), with error bars including uncertainties in the calibration of both instruments. |
| In the text | |
|
Fig. A.2 Comparison of the NOEMA flux (yellow histogram) of 12CO J = 2–1 with 30 m observation (white histogram) for 89 Her. The points show the recovered flux across velocity channels (right vertical axis), with error bars including uncertainties in the calibration of both instruments. |
| In the text | |
|
Fig. A.3 Comparison of the NOEMA flux (yellow histogram) of 13CO J = 2–1 with 30 m observation (white histogram) for 89 Her. The points show the recovered flux across velocity channels (right vertical axis), with error bars including uncertainties in the calibration of both instruments. |
| In the text | |
|
Fig. A.4 Comparison between the 30 m IRAM 13CO J = 2–1 line profile (black histogram) and the synthetic one (cyan histogram). The synthetic line profile corresponds to the model after increasing the width of the hourglass of the standard model. |
| In the text | |
|
Fig. B.1 Observational line profiles of 89 Her (top), IRAS 19125+0343 (middle), and R Sct (bottom) from the innermost region of each nebulae. See main text for details. |
| In the text | |
|
Fig. C.1 AC Her position–velocity diagrams found along different position angles from 0° to 170° with a step of 10°. The PA is indicated in each panel in the top right corner. The name of each quadrant is indicated in the panel showing the first velocity channel. Contours are the same as in the corresponding channel maps (Fig. 1). To help in the identification of the Keplerian dynamics, we show hyperbolic functions in each panel. |
| In the text | |
|
Fig. C.2 Variation of the emission of the first and third quadrants (QI and QIII in red dots) and the second and fourth quadrants (QII and QIV in blue dots)with the PA for our observation of AC Her (see Fig. C.1). The maximum emission of the mean of QI and QIII indicates thePA, for which the rotational effect of the Keplerian dynamics along the nebula equator are best detected. The angle found is: PA = 136.1°. The subtraction of what we name QI + QIII and QII + QIV shows the excess emission of the putative outflow along the nebula axis (black dots). We use thesame colors as in Fig. C.1. The magenta dotted lines represents PA = 46.1° and PA= 136.1°. These PA values represent the cut along the nebula axis and equator, respectively. The emission of the putative outflow is represented as a star at PA = 46.1° ± 1.4°. The error bar is the same for each point. The emission at the PA along the nebula axis is shown in the inset of the right corner. |
| In the text | |
|
Fig. D.1 Estimates of the equivalent excitation temperature as a function of the kinetic temperature and the density for J = 2–1 (top) and J = 1–0 (bottom) transitions. |
| In the text | |
|
Fig. E.1 Synthetic maps predicted by the alternative model of the 12CO J = 2–1 line emission for the nebula around AC Her. To be compared with Fig. 1, the scales and contours are the same. |
| In the text | |
|
Fig. E.2 Synthetic maps predicted by the disk-only model of the 12CO J = 2–1 line emission for the nebula around AC Her. To be compared with Fig. 1, the scales and contours are the same. |
| In the text | |
|
Fig. E.3 Left: synthetic position-velocity diagram from our disk-only best-fit model of 12CO J = 2–1 in AC Her along the direction PA = 136.1°. To be compared with the left panel of Fig. 2, the scales and contours are the same. Right: same as in left but along PA = 46.1°. |
| In the text | |
|
Fig. E.4 Synthetic maps predicted by the alternative model of the 12CO J = 2–1 line emission for the nebula around AC Her. To be compared with Fig. 1, the scales and contours are the same. |
| In the text | |
|
Fig. E.5 Left: synthetic position-velocity diagram from our best-fit alternative model of 12CO J = 2–1 in AC Her with an outflow. To be compared with Fig. 2, the scales and contours are the same. Right: same as in left but along PA = 46.1°. |
| In the text | |
|
Fig. E.6 Synthetic maps predicted by the model of the 12CO J = 2–1 line emission(top) and 13CO J = 2–1 (bottom) for the nebula around 89 Her. To be compared with Fig. 3, the scales and contours are the same. |
| In the text | |
|
Fig. E.7 Synthetic maps predicted by the model of the 12CO J = 2–1 line emission for the nebula around IRAS 19125+0343. To be compared with Fig. 6, the scales and contours arethe same. |
| In the text | |
|
Fig. E.8 Same as in Fig. E.7 but for the alternative model. To be compared with Fig. 6, the scales and contours are the same. |
| In the text | |
|
Fig. E.9 Left: synthetic position-velocity diagram from our alternative best-fit model of 12CO J = 2–1 in IRAS 19125+0343 along the direction PA = −40°. To be compared with the left panel of Fig. 7, the scales and contours are the same. Right: same as in left but along PA = 50°. |
| In the text | |
|
Fig. E.10 Synthetic maps predicted by the model of the 12CO J = 2–1 line emission for the nebula around R Sct. To be compared with Fig. 8, the scales and contours and units are the same. |
| In the text | |
|
Fig. E.11 Structure and distribution of the density of our alternative best-fit model for the disk and outflow of AC Her. The Keplerian disk presents density values ≥105 cm−3. The expansion velocity is represented with arrows. |
| In the text | |
|
Fig. E.12 Structure and distribution of the density of our best-fit alternative model for the disk and outflow of IRAS 19125+0343. The Keplerian disk presents density values ≥106 cm−3. The expansion velocity is represented with arrows. |
| In the text | |
Current usage metrics show cumulative count of Article Views (full-text article views including HTML views, PDF and ePub downloads, according to the available data) and Abstracts Views on Vision4Press platform.
Data correspond to usage on the plateform after 2015. The current usage metrics is available 48-96 hours after online publication and is updated daily on week days.
Initial download of the metrics may take a while.