Fig. 9
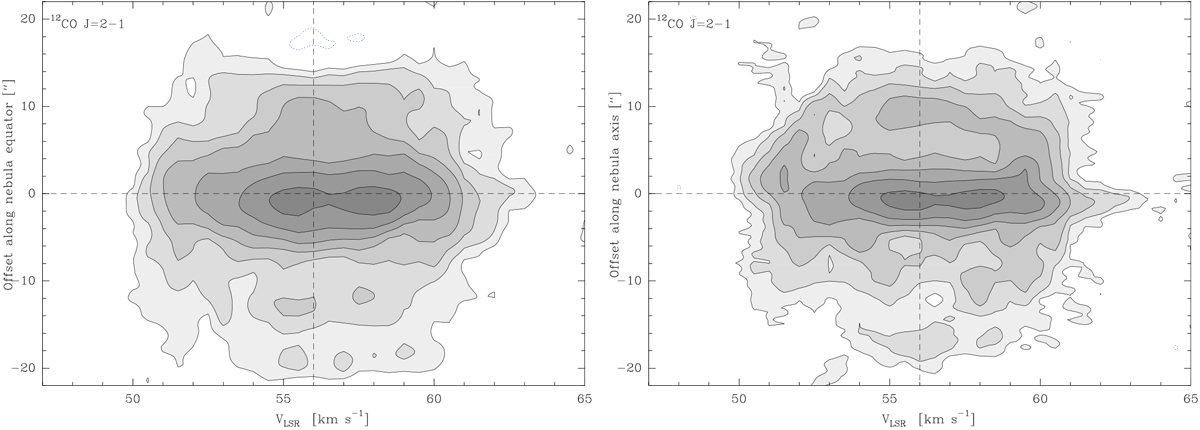
Left: position–velocity diagram from our maps of 12CO J = 2–1 in R Sct along the direction PA = 0°, corresponding to the nebula equator. The contour spacing is logarithmic: ± 25, 50, 100, 200, 400, 800, and 1600 mJy beam−1 with a maximum emission peak of 2.4 Jy beam−1. The dashedlines show the approximate central position and systemic velocity. Right: same as in left but along the perpendicular direction PA = 90°.
Current usage metrics show cumulative count of Article Views (full-text article views including HTML views, PDF and ePub downloads, according to the available data) and Abstracts Views on Vision4Press platform.
Data correspond to usage on the plateform after 2015. The current usage metrics is available 48-96 hours after online publication and is updated daily on week days.
Initial download of the metrics may take a while.