Free Access
Fig. 5
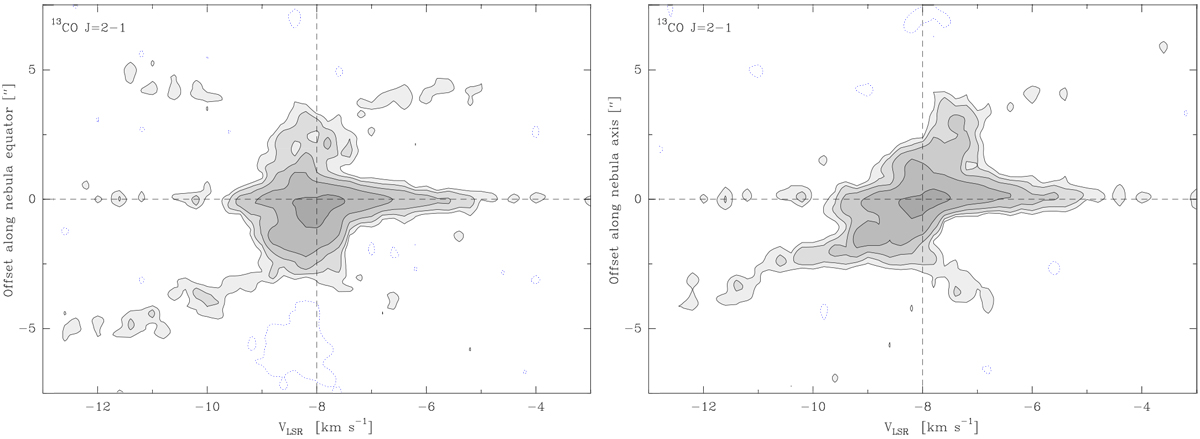
Left: same as Fig. 4 (left) but for 13CO J = 2–1 emission. The contours are ± 11, 22, 44, 88, and 144 mJy beam−1 with a maximum emission peak of 225 mJy beam−1. The dashed lines show the approximate centroid in velocity and position. Right: same as in left but along the perpendicular direction PA = 60°.
Current usage metrics show cumulative count of Article Views (full-text article views including HTML views, PDF and ePub downloads, according to the available data) and Abstracts Views on Vision4Press platform.
Data correspond to usage on the plateform after 2015. The current usage metrics is available 48-96 hours after online publication and is updated daily on week days.
Initial download of the metrics may take a while.