Free Access
Fig. 12
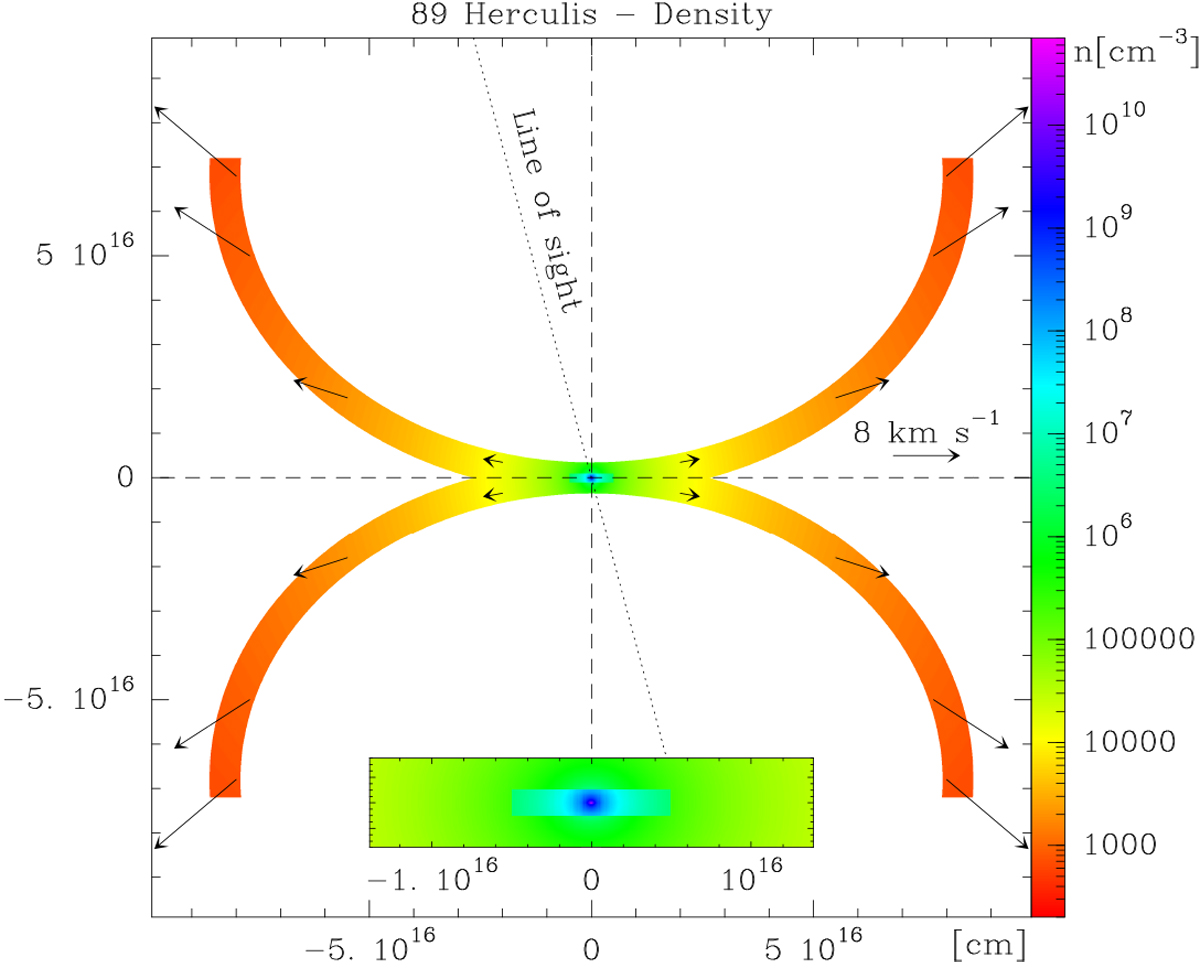
Structure and distribution of the density of our best-fit model for the disk and outflow of 89 Her. The lower inset shows a zoom into the inner region of the nebula where the Keplerian disk presents density values ≥107 cm−3. The expansion velocity is represented with arrows.
Current usage metrics show cumulative count of Article Views (full-text article views including HTML views, PDF and ePub downloads, according to the available data) and Abstracts Views on Vision4Press platform.
Data correspond to usage on the plateform after 2015. The current usage metrics is available 48-96 hours after online publication and is updated daily on week days.
Initial download of the metrics may take a while.