Free Access
Fig. E.5
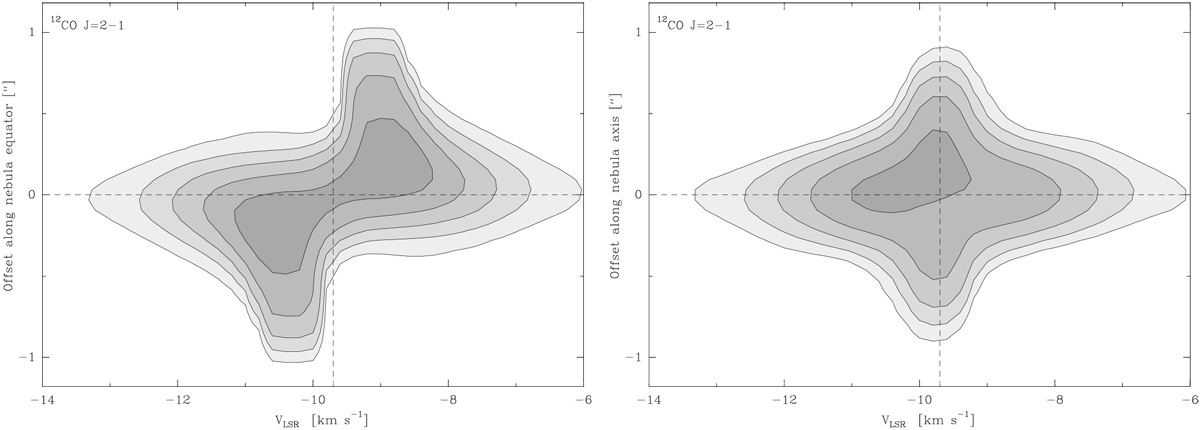
Left: synthetic position-velocity diagram from our best-fit alternative model of 12CO J = 2–1 in AC Her with an outflow. To be compared with Fig. 2, the scales and contours are the same. Right: same as in left but along PA = 46.1°.
Current usage metrics show cumulative count of Article Views (full-text article views including HTML views, PDF and ePub downloads, according to the available data) and Abstracts Views on Vision4Press platform.
Data correspond to usage on the plateform after 2015. The current usage metrics is available 48-96 hours after online publication and is updated daily on week days.
Initial download of the metrics may take a while.