Fig. C.2
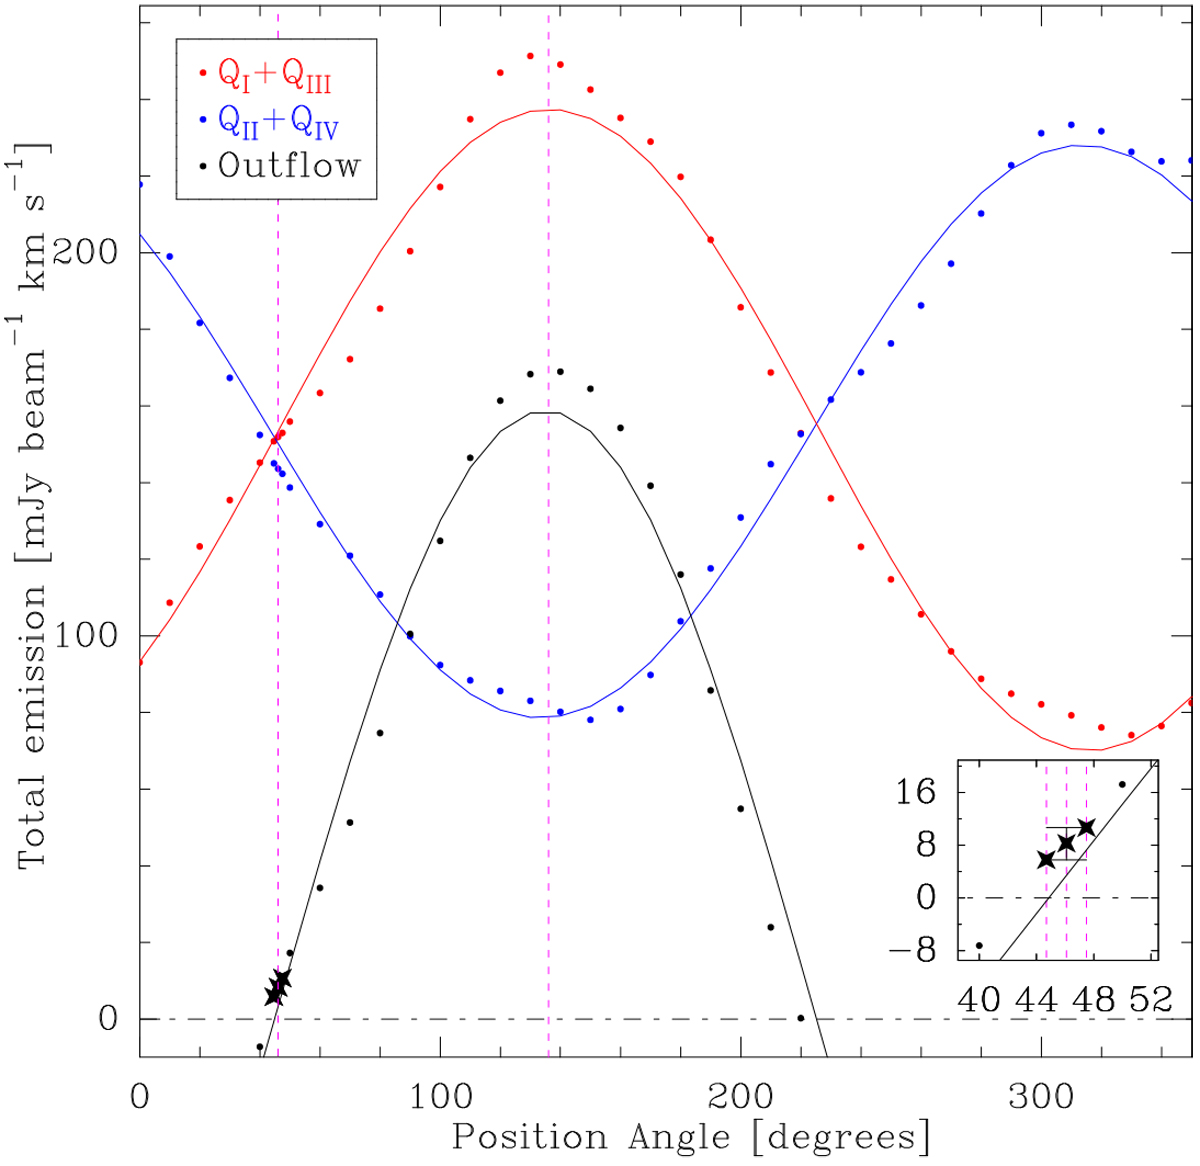
Variation of the emission of the first and third quadrants (QI and QIII in red dots) and the second and fourth quadrants (QII and QIV in blue dots)with the PA for our observation of AC Her (see Fig. C.1). The maximum emission of the mean of QI and QIII indicates thePA, for which the rotational effect of the Keplerian dynamics along the nebula equator are best detected. The angle found is: PA = 136.1°. The subtraction of what we name QI + QIII and QII + QIV shows the excess emission of the putative outflow along the nebula axis (black dots). We use thesame colors as in Fig. C.1. The magenta dotted lines represents PA = 46.1° and PA= 136.1°. These PA values represent the cut along the nebula axis and equator, respectively. The emission of the putative outflow is represented as a star at PA = 46.1° ± 1.4°. The error bar is the same for each point. The emission at the PA along the nebula axis is shown in the inset of the right corner.
Current usage metrics show cumulative count of Article Views (full-text article views including HTML views, PDF and ePub downloads, according to the available data) and Abstracts Views on Vision4Press platform.
Data correspond to usage on the plateform after 2015. The current usage metrics is available 48-96 hours after online publication and is updated daily on week days.
Initial download of the metrics may take a while.