Fig. C.1
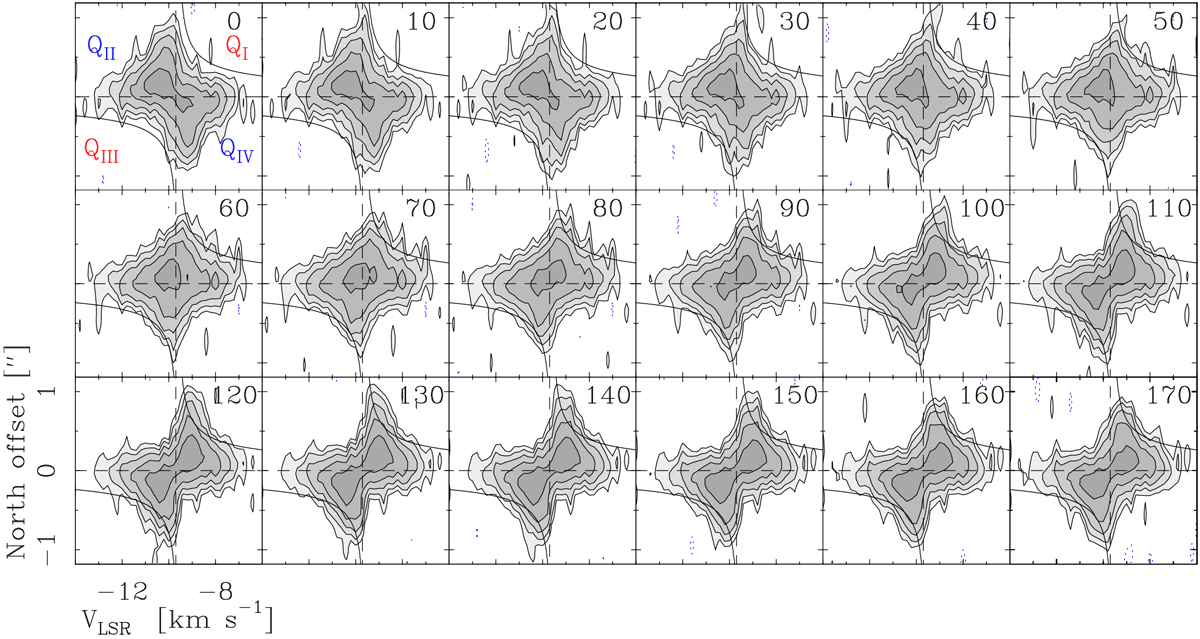
AC Her position–velocity diagrams found along different position angles from 0° to 170° with a step of 10°. The PA is indicated in each panel in the top right corner. The name of each quadrant is indicated in the panel showing the first velocity channel. Contours are the same as in the corresponding channel maps (Fig. 1). To help in the identification of the Keplerian dynamics, we show hyperbolic functions in each panel.
Current usage metrics show cumulative count of Article Views (full-text article views including HTML views, PDF and ePub downloads, according to the available data) and Abstracts Views on Vision4Press platform.
Data correspond to usage on the plateform after 2015. The current usage metrics is available 48-96 hours after online publication and is updated daily on week days.
Initial download of the metrics may take a while.