| Issue |
A&A
Volume 644, December 2020
|
|
|---|---|---|
| Article Number | A160 | |
| Number of page(s) | 19 | |
| Section | Interstellar and circumstellar matter | |
| DOI | https://doi.org/10.1051/0004-6361/202039059 | |
| Published online | 15 December 2020 | |
ATLASGAL-selected massive clumps in the inner Galaxy
VIII. Chemistry of photodissociation regions★
1
Max-Planck-Institut für Radioastronomie,
Auf dem Hügel 69,
53121
Bonn, Germany
2
Instituto de Radioastronomía Milimétrica,
Avenida Divina Pastora 7,
18012
Granada,
Spain
e-mail: This email address is being protected from spambots. You need JavaScript enabled to view it.
3
School of Physical Sciences, University of Kent,
Ingram Building,
Canterbury,
Kent CT2,7NH, UK
4
European Southern Observatory,
Alonso de Córdova 3107,
Vitacura Casilla
7630355,
Santiago, Chile
5
Institute for Astrophysical Research, 725 Commonwealth Ave, Boston University Boston,
MA
02215, USA
6
Department of Astronomy, University of Maryland,
College Park,
MD
20742, USA
Received:
29
July
2020
Accepted:
28
September
2020
Abstract
Aims. We study ten molecular transitions obtained from an unbiased 3 mm molecular line survey using the IRAM 30 m telescope toward 409 compact dust clumps identified by the APEX Telescope Large Area Survey of the Galaxy (ATLASGAL) to better understand the photodissociation regions (PDRs) associated with these clumps. The main goal of this study is to investigate whether the abundances of the selected molecules show any variations resulting from the PDR chemistry in different clump environments.
Methods. We selected HCO, HOC+, C2H, c-C3H2, CN, H13CN, HC15N, and HN13C as PDR tracers, and H13CO+ and C18O as dense gas tracers. By using estimated optical depths of C2H and H13CN and assuming optically thin emission for other molecular transitions, we derived the column densities of those molecules and their abundances. To assess the influence of the presence and strength of ultra-violet radiation, we compare abundances of three groups of the clumps: HII regions, infrared bright non-HII regions, and infrared dark non-HII regions.
Results. We detected C18O, H13CO+, C2H, c-C3H2, CN, and HN13C toward most of the observed dust clumps (detection rate >94%), and H13CN is also detected with a detection rate of 75%. On the other hand, HCO and HC15N show detection rates of 32 and 39%, respectively, toward the clumps, which are mostly associated with HII region sources: detection rates of HCO and HC15N toward the HII regions are 66 and 79%. We find that the abundances of HCO, CN, C2H, and c-C3H2 decrease as the H2 column density increases, indicating high visual extinction, while those of high-density tracers (i.e., H13CO+ and HC15N) are constant. In addition, N(HCO)/N(H13CO+) ratios significantly decrease as H2 column density increases, and, in particular, 82 clumps have X(HCO) ≳ 10−10 and N(HCO)/N(H13CO+) ≳ 1, which are indications of far-ultraviolet (FUV) chemistry. This suggests the observed HCO abundances are likely associated with FUV radiation illuminating the PDRs. We also find that high N(c-C3H2)/N(C2H) ratios found for HII regions that have high HCO abundances (≳10−10) are associated with more evolved clumps with high Lbol/Mclump. This trend might be associated with grain-surface processes, which determine the initial abundances of these molecules, and time-dependent effects in the clumps corresponding to the envelopes around dense PDRs and HII regions. In addition, some fraction of the measured abundances of the small hydrocarbons of the HII sources may be the result of the photodissociation of PAH molecules.
Key words: astrochemistry / surveys / ISM: molecules / HII regions / photon-dominated region
Full Tables 2, 3, 4, 6 are only available at the CDS via anonymous ftp to cdsarc.u-strasbg.fr (130.79.128.5) or via http://cdsarc.u-strasbg.fr/viz-bin/cat/J/A+A/644/A160
© ESO 2020
1 Introduction
Newly born high-mass stars ( >8 M⊙) dramatically affect their environments in various ways, for example, by powerful outflows, creation of ionized gas regions via ultraviolet (UV) radiation, stellar winds, etc. (Zinnecker & Yorke 2007). Their intense UV radiation impinging on the surrounding molecular gas creates photodissociation regions (PDRs, e.g., Tielens & Hollenbach 1985; Tielens 2013). The UV inducing photo-chemistry and many other factors, such as the geometric structure of molecular gas, volume density of H2, and turbulence, control the formation and destruction of molecules, leading to a complex chemistry in PDRs. To date, most detailed studies of PDRs have concentrated on a few nearby regions (e.g., the Horsehead nebula and the Orion Bar; Rodriguez-Franco et al. 1998; Teyssier et al. 2004; Pety et al. 2005; Gerin et al. 2009; Cuadrado et al. 2015).
According to the detailed molecular excitation studies of the Orion Bar by Hogerheijde et al. (1995) and Jansen et al. (1995), the PDR layer consists of at least two components: a low-density inter-clump medium (n(H2) ≈ 3 × 104 cm−3) and high-density clumps (n(H2) ≈ 1 × 106 cm−3). More recent observational studies have indicated the presence of dense PDRs between the ionized and neutral gas in the Orion Bar and Monoceros R2 (Mon R2) (Rodriguez-Franco et al. 1998; Rizzo et al. 2005). High H2 densities (> 4 × 106 cm−3) were found in its PDRs, especially toward Mon R2 (Rizzo et al. 2005), which are illuminated by intense UV radiation (G0 1 = 5 × 10⁵; Rizzo et al. 2003), unlike low- and moderate-UV illuminated PDRs (e.g., the Horsehead nebula) (G0 = 100−2600; Pilleri et al. 2013), and they are geometrically thin (≲0.001 pc). At the other extreme, PDRs surrounding compact HII or ultracompact (UC HII) regions in molecular clumps have different physical conditions than the aforementioned “weak” PDRs, such as those associated with the Horsehead nebula. Their high densities suggest that UC HII regions could be pressure-confined by the surrounding high-density neutral gas (Rizzo et al. 2005). The observations toward Mon R2 provided a good understanding of a particular type of dense PDR illuminated by high-UV radiation (hν > 13.6 eV) from embedded high-mass stars. It is, however, hard to build a comprehensive view of such PDRs by studying only one object. Therefore, it is important that the sample is not biased by any evolutionary stages, and it is critical to have access to various molecular species to identify appropriate tracers of different layers of the PDRs.
In our previous studies (Kim et al. 2017, 2018), we identified HII regions toward compact dust clumps selected from the ATLASGAL compact source catalogs (Contreras et al. 2013; Urquhart et al. 2014) using hydrogen radio recombination lines (RRLs) at (sub)millimeter wavelengths and radio continuum surveys. The clumps with RRL detections are associated with more energetic UV radiation fields from mostly O-stars, whereas the clumps with only radio continuum associations may have weaker UV fields provided by early B-stars. Many of the remaining clumps without those signposts have embedded massive young stellar objects (MYSOs) that provide even weaker radiation fields. Finally, some of the clumps without embedded objects, which are classified as infrared (IR) dark clumps, may only be affected by cosmic-ray in their interior or by external radiation fields from nearby star-forming complexes. The ATLASGAL compact source catalogues, therefore, allow us to investigate PDRs produced in a wide range of UV field strengths and physical conditions.
In general, dense and compact PDRs occur in complex star-forming regions that are embedded in their parental molecular clouds. It is critical to find molecular tracers whose abundance is primarily driven by PDR chemistry. Infrared diagnostics provide direct information about PDRs, but they are not easily observable from the ground and accessible in the presence of high extinction. Alternatively, several molecular species are linked to UV photochemistry without suffering high extinction and also offer additional information on the velocity fields that allow us to investigate the kinematics and turbulence in PDRs. Rizzo et al. (2005) identified two groups of moleculesas PDR tracers: the first group is related to the surface layers of the PDR (visual extinction 2 mag < AV < 5 mag) that are exposed to a high-UV field (referred to as high UV or HUV). Molecular species in this group are reactive ions (e.g., CO+ and HOC+) and small hydrocarbons (e.g., C2H and c-C3 H2; Sternberg & Dalgarno 1995). The second group is found in deeper parts of PDRs (5 mag < AV < 10 mag) where they are less exposed to the UV field (i.e., low UV, 6 eV < hν < 13.6 eV; referred to as FUV) and close to cold gas regions (Schilke et al. 2001; Rizzo et al. 2005). Radicals (e.g., HCO, C2 H and CN) are considered to belong to this group.
In this paper, we analyze 3 mm line survey data taken with the Institut de Radioastronomie Millimétrique (IRAM) 30 m telescope toward 409 ATLASGAL dust clumps. These observations contain a large number of rotational transitions of molecular species. Based on previous observational studies (e.g., Rizzo et al. 2005; Boger & Sternberg 2005; Gerin et al. 2009), we selected eight molecules that are regarded as typical PDR tracers: HCO, HOC+, C2 H, c-C3 H2, H13 CN, HC15 N, HN13 C and CN. In addition, C18O and H13 CO+ were chosen as general probes of column density and dense gas in the dust clumps. The selected molecular transitions are given in Table 1.
The structure of the paper is as follows. The selected molecules are described in Sect. 2. The observations, source types, and data reduction are explained in Sect. 3. Detected molecular lines and detection rates are presented inSect. 4, including a description of several sources with CN self-absorption line profiles. The estimated column densities and abundances of the selected molecules are given in Sect. 5 along with a comparison with H2 column densities. Column density ratios of some of the selected molecular lines (i.e., HCO, H13 CO+, C2 H, and c-C3H2) and their correlations are discussed in Sect. 6. Finally, we summarize our main results in Sect. 7.
2 Line selection
2.1 C18O
As a rare isotopologue of carbon monoxide, C18O is an excellent tracer of column density in star-forming regions. Chemically, it is relatively stable compared to other species. C18 O, like all carbon monoxide isotopologues, can be affected by depletion on dust grains surfaces, but this only occurs in the innermost, densest and lowest temperature cloud core regions (e.g., Caselli et al. 1999; Bacmann et al. 2002; Giannetti et al. 2014). C18 O is, therefore, used as a reference molecule to measure the relative abundances of the other molecules in this paper.
2.2 H13 CO+, HOC+, and HCO
H13 CO+ is a rare isotopologue of HCO+ (formylium) and mostly optically thin in molecular clouds. HCO+ is a high-density tracer (critical density ~ 105 cm−3 for HCO+ (J = 1−0) with the collisional rate at 20 K taken from the Leiden Atomic and Molecular Database; Schöier et al. 2005) that shows enhanced abundances in regions of higher fractional ionization and toward outflows where shock-generated radiation fields are present (Rawlings et al. 2000). Hydroxy methylidyne (HOC+) is a reactive ion that is almost exclusively related to regions with a high ionizing flux (either PDRs or X-ray-dominated regions; Fuente et al. 2003; Rizzo et al. 2003, 2005). However, there are few reported detections of this rare molecule. HOC+ has been detected toward the UC HII of Mon R2 together with the other reactive ion CO+ (Rizzo et al. 2003). The Formyl radical (HCO) has been mostly studied in PDRs toward the Orion Bar (Schilke et al. 2001), the Horsehead nebula (Gerin et al. 2009), and even the starburst galaxy M82 (García-Burillo et al. 2002). In the Horsehead nebula, its emission strongly correlates with polycyclic aromatic hydrocarbon (PAH) and C2 H emission, and its measured abundance reaches X(HCO) ≃ 1−2 × 10⁻⁹ (Gerin et al. 2009). In addition, the HCO/H13CO+ column density ratio in PDRs with HII regions (e.g., Schenewerk et al. 1988; Schilke et al. 2001; Gerin et al. 2009) shows higher values than in regions without HII regions or any other signpost of star formation.
2.3 C2H and c-C3H2
The ethynyl radical (C2H) and cyclopropynylidyne (c-C3H2) are small hydrocarbon species and well known for their association with PAH molecules (Rizzo et al. 2005). Enhanced abundances of these small hydrocarbons were found in PDRs with intense UV fields (Fuente et al. 2003, 2005; Teyssier et al. 2004; Pety et al. 2005; Rizzo et al. 2005; Ginard et al. 2012). Their spatial distribution follows PAH emission in general, but it is slightly different in extent (Pilleri et al. 2013; Cuadrado et al. 2015). In the PDRs of Mon R2 and the Orion Bar, the abundance of C2 H is constant fora broad range of incident UV radiation strength, but the abundance of c-C3H2 appeared in the usage of high for low-UV PDRs (Cuadrado et al. 2015). In addition, C2 H shows higher column densities in high-UV irradiated PDRs, whereas column densities of c-C3H2 are predicted to decrease for such PDRs (Cuadrado et al. 2015).
Observed molecular transitions.
2.4 HN13C, H13 CN, HC15N, and CN
Hydrogen cyanide (HCN) and hydrogen isocyanide (HNC) are used as tracers of dense gas within molecular clouds (e.g., Vasyunina et al. 2011). The column density ratio HCN/HNC significantly depends on the temperature of the cloud as has been found in the Orion molecular cloud and several high-mass star-forming regions (Goldsmith et al. 1986; Schilke et al. 1992; Jin et al. 2015). The cyanide radical (CN) at millimeter wavelengths is often used as a probe of dense gas and PDRs in the Galactic interstellar medium (Rodriguez-Franco et al. 1998; Boger & Sternberg 2005). Previous observational and theoretical studies have shown that CN abundances are enhanced in PDRs (Fuente et al. 1993; Rodriguez-Franco et al. 1998). In particular, the observations toward the Orion Bar PDRs showed that the CN emission is located between the molecular ridge and the ionization fronts (Jansen et al. 1995; Simon et al. 1997; Rodriguez-Franco et al. 1998).
3 Observations, source type, and data reduction
3.1 Observations and source type
The molecular line data were taken from unbiased spectral line surveys covering a frequency range of ~84−115 GHz (see Csengeri et al. 2016 for details). They contain a number of molecular lines with different rotational energy levels. The line survey is observed with the Eight MIxer Receiver (EMIR)2 of the IRAM 30 m telescope (Project IR: 181-10 and 037-12) toward 409 clumps selected from the ATLASGAL compact source catalog. The velocity resolution of these spectral line data is ~0.5 km s−1. The largestbeam size in the 3 mm atmospheric window is ~29″. We applied the forward efficiency (ηl = 0.95) and the main-beam efficiency (ηMB = 0.81) to convert antenna temperatures,  , to the main beam brightness temperatures, TMB. Here we divide the ATLASGAL sample into two groups, which are HII and non-HII regions, according to the presence of HII regions based on detection of mm-RRL and radio continuum emission (see Kim et al. 2017 for details). Table 2 displays information about the observed sources and the clump classification from Urquhart et al. (2018). This classification is used to further divide the group of non-HII region sources into IR bright non-HII and IR dark non-HII regions.
Observed sources.
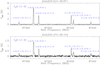 |
Fig. 1 Spectra of C2H hyperfine lines toward two example sources (AGAL015.013−00.671 and AGAL045.474+00.134). |
3.2 Data reduction
We utilized the CLASS software3 of the GILDAS package (Pety 2005) for data reduction of the molecular line data and the WEEDS4 package within CLASS for line identification. The hyperfine structures of the C2 H (N = 1−0) and H13 CN (J = 1−0) transitions were fit (see Figs. 1 and 2) with the hyperfine structure (HFS) fit method5 of the CLASS software. The HFS fit method assumes that all hyperfine components share a single excitation temperature and local thermodynamic equilibrium (LTE). The HFS fit yields the radial velocity (vLSR), the line width (Δv) at the full-width of half maximum, and the total optical thickness (τtot). The line parameters of the other molecular lines were fitted with multi-Gaussian components if one Gaussian fit was insufficient.
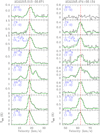 |
Fig. 2 From top to bottom: spectra of HCO, CN, c-C3H2, HC15 N, H13 CN, HN13 C, H13 CO+, and C18 O toward the same example sources as in Fig. 1. Hyperfine structure fitting was used for H13 CN, and Gaussian profiles for the other molecular lines. The green lines represent Gaussian and HFS fitting results, and the red lines indicate the systemic velocity. HCO (1−0) was not detected toward AGAL045.474+00.134. |
4 Results
4.1 Line parameters
Since the local standard of rest (LSR) velocities of the sources were unknown when the observations were carried out, they were observed with a velocity of 0 km s−1. Consequently, due to cases with a significantly different LSR velocity, the numbers of observed and detected lines in the sources vary slightly, and the molecules non-detected toward each source are given in Table 2. Tables 3 and 4 provide an example of the full tables of the HFS-fit, and Gaussian-fit line parameters, which are only available at the CDS. In cases where several velocity components were found ( ~1−8% of the detected sources), we only selected a component with a common velocity in all detected lines. Figures 1 and 2 show the spectral lines and fitted line profiles of AGAL015.013−00.671 and AGAL045.474+00.134 as examples (see captions for details on transitions presented).
For CN and HCO, we performed a single Gaussian fit to the molecular lines although several of their hyperfine lines have been detected. CN hyperfine lines at 3 mm wavelengths have substantial deviations from their relative intensities expected in LTE, making the hyperfine fits uncertain. In particular, this effect is stronger for the brightest three components than for the weakest component, which is considered to be optically thin. To reduce optical depth effects and to avoid non-LTE excitation, we used the weakest component of CN (NJF = 1(1∕2)3∕2−0(1∕2)3∕2) for all analysis presented in this work. In addition to these hyperfine anomalies, some sources show self-absorption in the three brightest components,which will be discussed in Sect. 4.2. The four HCO hyperfine lines are considerably weaker than the other molecular lines, and thus only a few sources have all the four HCO hyperfine components clearly detected. The brightest component (NJF = 1(3∕2)2−0(1∕2)1) is strong enough to secure a detection of the molecule. But to increase the signal-to-noise ratio (S/N), the detection rates and Gaussian fits of HCO are based on stacked spectra. The stacked HCO lines are scaled to the brightest component transition. For the stacking, each HFS component is weighted and scaled by its relative intensity. The stacking increased the S/N by a factor of 2. As shown in Fig. 2, the three hyperfine components of H13 CN observed toward the clumps hosting HII regions are often blended. As a result, the measured line parameter of H13 CN toward some sources are associated with high uncertainties, and we will discuss this in later sections.
Line parameters of hyperfine lines of C2H (N = 1−0) and H13 CN (J = 1−0).
Gaussian line parameters of C18O, HCO, H13CO+, c-C3 H2, CN, HC15N, and HN13C.
4.2 Self-absorption profiles of CN emission lines
Self-absorption features are found in the three strongest CN lines (F = 3∕2−3∕2, F = 3∕2−1∕2 and F = 1∕2−1∕2) toward 25 HII and 15 non-HII region clumps. The features indicate the clumps have inhomogeneous structures in temperatureand density, and, because of such structures, diffuse and low-temperature gas in the foreground absorbs the emitted radiation from CN molecules along the line of sight. Figure 3 displays two example sources showing self-absorption features. These line profiles represent different kinds of gas motions within the clumps. All CN self-absorption spectral lines plots are available at CDS. In the left panel of Fig. 3, AGAL011.936−00.616 shows red-skewed emission features with self-absorption, which might be caused by the expansion of molecular cores (Smith et al. 2012) or outflows. On the contrary, we find blue-skewed emission features with self-absorption toward AGAL031.261+00.062 (right panel). Blue-skewed profiles indicate potential infall motions within clumps (Lucas 1976; Myers et al. 1996; Wyrowski et al. 2016).
Detection rates of the observed molecules.
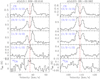 |
Fig. 3 Self-absorption of CN lines of AGAL011.936−00.616 (left) and AGAL031.281+0.062 (right). The displayed spectral lines are CN (NJ = 1(1∕2)−0(1∕2)) and 13 CN (N = 1− 0, J = 3∕2−1∕2, F1 = 2−1, F = 3−2) transitions. The red vertical lines indicate the systemic velocities measured by H13 CO+ lines. |
4.3 Detection rates
Table 5 shows detection rates for the whole sample, including HII and non-HII regions. The detection of molecules was based on applying a 3 σrms threshold. We detect C18O lines toward all the observed clumps (100%). This result shows that the ATLASGAL dust clumps trace the high column density parts of molecular clouds. In addition, we also find high detection rates for H13 CO+ (99%), C2 H (99%), c-C3H2 (99%), CN (94%), and HN13C (94%). We find a reasonably high detection rate for H13CN (75%). Even the rare isotopologue HC15N is detected with a rate of 39%. However, the other cation, HOC+ was detected in only five clumps (below 3 σ with an rms ~0.041 K), which are marked in Table 2. It is probably due to its low abundance (including unknown beam dilution). HOC+ fractional abundances toward typical PDRs, including the Orion Bar and Mon R2, are in a range of ~ 9 × 10⁻¹¹−7 × 10⁻¹³ (Savage & Ziurys 2004). In addition, its large dipole moment and Aij imply the critical density of this molecule is probably higher than others with small dipole moment if collisional rates are similar. These tentative detections of HOC+ are excluded from the following statistical analyses.
Figure 4 shows the detection rates of the nine molecules toward HII (orange bars) and non-HII (cyan bars) region sources. Differences in detection rates for some molecular transitions (i.e., H13 CN, HC15N, and HCO) toward the two groups are distinct, with the HII regions showing higher detection rates that can be related to higher column densities. According to Kolmogorov-Smirnov tests and median values of H2 column densities (N(H2)) for the ATLASGAL clumps, the median value of the N(H2) determined for the HII region sources is not significantly different from the value found for non-HII region sources. The N(H2) are taken from König et al. (2017), and Urquhart et al. (2018) and were derived by analyzing dust continuum emission with adopting dust opacity of 1.85 cm2 g−1 and  of 2.8 that is mean molecular weight of the interstellar gas for a hydrogen molecule. The N(H2) values of both HII and non-HII regions are mostly in a range of ~ 4−6 × 1022 cm−2 (for HII regions, 1.14 × 1022 cm−2 ≤N(H2) ≤ 1.06 × 1024 cm−2 compared to 1.25 × 1022 cm−2 ≤ N(H2) ≤ 3.43 × 1023 cm−2 for non-HII regions). Another possibility is a distance effect leading to weaker molecular lines for more distant sources. However, this can be excluded because of the detection rates for all the molecules for a distance limited sample (3–5 kpc) are approximately the same (see Fig. A.1).
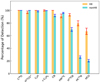 |
Fig. 4 Detection rates of typical PDR tracer molecules and C18O as a reference molecule. Binomial statistics were used for estimating uncertainties marked with the red and blue error bars. |
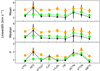 |
Fig. 5 Mean, median, and a standard deviation (σ) of line widths of the selected molecular lines. The σ shows the source to source variation of the widths. The error bars for the mean and median values are based on typical Gaussian fit errors with 2σ. The error bars of the standard deviation of line widths is the standard deviation error. Different colors show three subgroups of our sample, which are HII in orange, IR bright in green, and IR dark non-HII regions in black. |
4.4 Line widths and integrated fluxes
To investigate whether different molecular lines are originating from the same gas or show different amounts of turbulence, we compared the mean, median, and standard deviations of the measured line widths. Figure 5 shows these values with their uncertainties. The molecular line widths increase from less evolved clumps to more evolved clumps. Such a trend, broader molecular lines detected toward clumps in evolved stages, was also found in ammonia (Wienen et al. 2012; Urquhart et al. 2013) and H13 CO+ (Kim et al. 2017) data. The HCO line widths have considerable higher fit uncertainties due to the low line intensities (or lower S/N). Nevertheless, comparing the IR bright non-HII and HII regions, which have small fitting uncertainty, we find that broad HCO lines are often associated with HII regions. The HCO, H13 CN, and HC15N lines observed toward IR dark non-HII regions seem to be broader than the other molecular lines, but their errors are also obviously larger than those of the other source groups. The third panel from the top of Fig. 5 exhibits the standard deviations (σ) of line width and its associated uncertainty. Except for C2H, CN, and HC15N, the other molecular lines have broader distributions toward the HII region sources compared with those toward non-HII region sources.
Figure 6 shows scatter plots comparing line widths of the lines from selected molecules with C18 O line widths. Covariance error ellipses are overlapped over the data points to visualize two-dimensional Gaussian distributed data6. The ellipses and data points of H13 CO+ and C18 O display pronounced correlations and well align on the equality line. On the other hand, the other molecular lines show some deviations from the equality lines. Some sources have remarkably broader line widths in H13 CN with small uncertainty. Such broadening can be a result of high optical depth, leading to a blending of the HFS lines. If any internal turbulence within clumps causes these broad line widths, we also expect to find such a trend in HC15N. But no sources with notably broader line widths of HC15N are found.
To identify similarities in the line widths between the clump groups, we performed KS tests for the molecular line widths. The null hypotheses are rejected with small p-values less than 3σ (p-value ≪ 0.0013, i.e., the confidence of >99.87%). This means that statistically the line widths are significantly broader for the HII regions than for the non-HII regions, consistent with the results in Fig. 5. One possible cause for this may be distance bias. To test this, we compared molecular line widths and distances of the clumps (see Fig. B.1), but we do not find significant correlations.The distance effect cannot, therefore, be the main reason for the broad line widths of the HII region group. For the HII region group, we compared the line widths of molecular lines with RRL line widths. If the molecular lines are mainly emitted in PDRs, we might expect to find some correlations between them due to the dynamical interaction between ionized and photodissociated gas. However, we could not find any significant correlations.
Integrated intensity ratios of molecular lines have been used as a chemical clock tracing different evolutionary sequences of high-mass stars in molecular clumps (e.g., Rathborne et al. 2016; Urquhart et al. 2019). With the assumption that observed lines are optically thin, integrated intensity ratios gives us approximate abundance ratios of molecular lines compared with each other. Figure 7 shows cumulative distributions of the integrated intensity ratios of C2 H, c-C3H2, and CN (i.e., C2 H/c-C3H2 in the left panel, CN/c-C3H2 in the middle panel, and CN/HN13C in the right panel). We performed KS tests for the ratio differences among the three groups and found that we can reject the null hypotheses for the similarities of their ratios with small p-values ≪ 3σ. The HII regions show brighter ratios of those molecular lines than the other two groups. The well separated cumulative distributions of C2 H/c-C3H2 show that the relative intensities of the small hydrocarbons increase with the evolution of high-mass clumps. This trend is also found for ATLASGAL sources in the Southern hemisphere (Urquhart et al. 2019).
5 Analysis
5.1 Column densities
To compare abundances of the selected molecules with respect to H2 for different environments in dust clumps, as the first step, we estimated column densities of the molecules. Since the observed data only contain a single transition per molecule, several assumptions are required to derive column densities (N): (1) the molecular lines are emitted under LTE condition because the critical densities of the observed molecular transitions are lower than the H2 densities (> 105 cm−3) in high-mass star-forming regions; (2) at these high densities, the gas and dust temperatures are in equilibrium; (3) the observed line emission is considered to be optically thin. For optically thin emission, the total column density is given by,
![Mathematical equation: \begin{align*}N_{\textrm{tot}}^{\textrm{thin}}\,{=}&\,\left(\frac{8\pi\nu^{3}}{c^{3}A_{\textrm{ul}}} \right)\left(\frac{Q(T)}{g_{\textrm{u}}} \right)\frac{\textrm{exp} \left(\frac{E_{u}}{k_{\textrm{B}}T_{\textrm{ex}}} \right)}{\textrm{exp}\left( \frac{h\nu}{k_{\textrm{B}}T_{\textrm{ex}}}\right) -1} \nonumber\\ &\,{\times}\,\frac{1}{[J_{\nu}(T_{\textrm{ex}}) - J_{\nu}(T_{\textrm{bg}})]} \int{\frac{T_{\textrm{MB}}}{f}}\,\textrm{d}\textit{\varv}, \end{align*}](/articles/aa/full_html/2020/12/aa39059-20/aa39059-20-eq3.png) (1)
(1)
where ν is the frequency of a selected molecular transition, Aul is the Einstein coefficient for spontaneous emission, and gu is the statistical weight of the upper state level. Q(T) and kB are the partition function and Boltzmann constant, respectively. Eu is the energy of the upper level of the selected transition. TMB is a main beam temperatureof an observed source, and f is the beam filling factor, which is the fraction of the beam filled by the source. Here we consider calculated column densities are beam-averaged values, and the medium is spatially homogeneous and larger than the size of the beam. These assumptions return the beam filling factor as 1. Jν (T) is the Rayleigh-Jeans temperature, 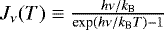 . Tex is the excitation temperature which we approximate with the dust temperature, and Tbg is the background emission temperature assumed to be 2.7 K that is the cosmic microwave background radiation.
Since the optical depths of the C2H and H13 CN lines were obtained by HFS fitting, correct column densities of these lines were estimated by multiplying Eq. (1) by a factor of τ∕(1 − e−τ) for the non-optically thin case. For the other molecular lines, we utilized the optically thin case of Eq. (1), which gives us a lower limit of column density in case the lines become optically thick. We note that in some cases we failed to measure a τtot with a fitting uncertainty below 50%, either because some of C2H and H13 CN hyperfine components are not separated sufficiently (e.g., the H13CN spectral line of AGAL045.474+00.134 in Fig. 2) or their relative intensities have substantial deviations from the predicted LTE values.Consequently, we only estimated column densities of these molecules using their optical thickness when the uncertainty of the fit was smaller than 50%. For the remaining sources with high τtot uncertainties, we calculated their column densities as lower limits using the optically thin approximation (Eq. (1)) and their values in Table 6, but do not use them for following statistical analysis. The dust temperatures used in the analysis were determined by Urquhart et al. (2018) using the method for the dust temperature determination from König et al. (2017). We estimated the partition function for an individual source and molecule by interpolating the data provided by the Cologne Database for Molecular Spectroscopy (CDMS, Müller et al. 2001) and the Jet Propulsion Laboratory (JPL, Pickett et al. 1998)line databases for a given temperature. The partition functions obtained from CDMS and JPL take into account the hyperfine splitting and ortho- and para-transitions. Overall, our column density measurements agree with those reported in previous studies (e.g., Sanhueza et al. 2012; Gerner et al. 2014). However, we find no clear differences between the sources representative of different evolutionary stages. We used simplifying assumptions such as the optically thin case, equating the dust temperature and gas temperature and neglecting some factors, such as size of the emitting region. The measured column densities of a portion of all the observed clumps are tabulated in Table 6.
Figure 8 shows scatter plots of column density of H2 versus that of selected molecules. H13 CO+ and HC15N exhibit an excellent correlation (Pearson correlation coefficient, r, ≥ 0.8 with p-value ≪0.0013) for both the HII and non-HII region groups. In addition, C2H, c-C3H2, CN, H13CN and HN13C also show a good correlation (r ~ 0.6–0.7 withp−values ≪ 0.0013). On the other hand, the N(HCO) has poor correlations for both groups (r = 0.3 for HII and r = 0.2 for non-HII regions) with N(H2). HCO has been found to be enhanced in PDRs rather than in cold, dense molecular regions toward both Galactic objects (Schilke et al. 2001; Gerin et al. 2009), and extragalactic sources (García-Burillo et al. 2002). The weak correlation supports the hypothesis that, where detected, the HCO emission is associated with PDRs on surfaces of the clumps and not their colder material. The column densities of H13 CO+, c-C3H2, CN, and HN13C for the two groups are significantly different from each other (KS tests gives p-values ≪ 0.0013).
For HCO, H13CN, and HC15N, we cannot find significant differences between these groups according to KS tests that yield p-values ≳ 0.004. Sanhueza et al. (2012) also did not find any increasing trend for N(C2H) with evolutionary stages. In our results, N(HN13C) is higher toward HII regions, but this trend was not apparent in the results of Sanhueza et al. (2012). For comparison, Miettinen (2020) found some evidence that the C2H abundance decreases with clump evolution. Overall, the column densities of all molecules are higher in HII regions than in the other groups.
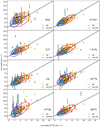 |
Fig. 6 Orange circles indicate ATLASGAL clumps containing HII regions and the cyan circles represent clumps without the presenceof HII regions, which consist of IR bright non-HII and dark non-HII regions. The black dashed lines indicate equality. The error bars are obtained from Gaussian or HFS fits. The red and blue ellipses are covariance error ellipses with 1σ (inner ellipse) and 2σ (outer ellipse) for the two groups. |
 |
Fig. 7 Cumulative distribution plots of integrated intensity ratios of C2H to c-C3 H2 (left panel), CN to c-C3H2 (middle panel), and to HN13C (right panel). The orange curves are HII regions. The green and black curves indicate IR bright non-HII and IR dark non-HII regions. |
Column density of molecules in units of cm−2.
5.2 Molecular abundances
Figure 9 shows abundances relative to C18 O, f(mol), and fractional abundances relative to H2, X(mol), of the selected molecules. In addition, scatter plots of the abundances relative to C18O are displayed in Fig. C.1. The symbols and error bars represent the median values and full ranges of the molecular abundances, respectively. The median abundances are listed in Table 7. In Fig. 9, there are no significant abundance differences among the three source groups. When considering the uncertainties in the calculations, these results are not significantly different from the results of Gerner et al. (2014), who assumed higher temperatures for evolved sources such as HII regions.
In Fig. 10, we plot the relationships of X(mol) and N(H2) of the observed clumps for the HCO, CN, C2H and c-C3H2 molecules; these molecules have been found to show good spatial correlations with some PDRs, such as the Horsehead nebula, the Orion Bar and Mon R2 (Teyssier et al. 2004; Rizzo et al. 2005; Gerin et al. 2009; Ginard et al. 2012; Cuadrado et al. 2015). In the bottom panels of Fig. 10, the abundances of dense gas tracers, X(H13CO+) and X(HC15N), are found to be independent of N(H2). On the contrary, X(HCO) significantly drops for the clumps with high N(H2) corresponding to a large AV. The X(CN), X(C2H) and X(c-C3H2) display similar trends as seen in the X(HCO) plot, but are less pronounced.
The X(HCO) measured in this work may also contain a contribution from HCO molecules originating in cold gas regions of clumps, not only from PDRs. To analyze this quantitatively, we use a simple toy model; it assumes a high abundance (2.0 × 10⁻¹⁰) of HCO (AV < 5 mag) in a PDR and a low abundance (8.0 × 10⁻¹¹) in the dense molecular region. The resulting average abundance changes as a smooth progression between a PDR and a cold gas region. The gray dashed line on the HCO plot in the most upper left panel of Fig. 10 shows the result of the model. It fits our data points (orange, green and black symbols) and might indicate that the trends of decreasing abundances with N(H2) are caused by abundance jumps from the PDRs into the cold molecular clouds. Besides, at a given N(H2), X(HCO) values determined for the HII regions seem to be slightly higher than toward non-HII regions. The HCO molecule is referred to as a good tracer of FUV; its emission in the Horsehead nebula was found in a range 1.5 ≲ AV ≲ 3.0 and its abundance has been found to decrease when the gas is shielded from the FUV radiation (Gerin et al. 2009). In contrast, in the Orion Bar HCO emission was found deeper into PDRs toward molecular regions with 5 ≲ AV ≲ 10 (Schilke et al. 2001). Some of the non-HII region sources (all IR bright non-HIIs and potentially some of IR dark non-HIIs) host early stages of star formation (i.e., YSOs) but they do not yet show centimeter free-free emission or mm-RRLs. Thus, their embedded YSOs cannot provide FUV radiation, although shock associated with outflow from them potentially could. However, some of the IR dark non-HII regions are possibly influenced by external radiation fields from nearby star-forming complex regions (e.g., IR dark non-HII regions in M17 SW). Therefore, we presume that bright PDRs are only found in the HII region sources because of abundant UV radiation from their massive stars. This might be the reason that the HII regions show slightly higher X(HCO) than the others. We also found that all the ATLASGAL clumps have higher X(HCO) compared to nine local cold dark clouds (brown squares) taken from Agúndez et al. (2015) with distances of around 140−500 pc, at a given N(H2) (the most upper left panel of Fig. 10). On the contrary, X(HCO) (blue star) in the cold gas region in the Horsehead nebula is similar to the abundances in the dust clumps, while X(HCO) (purple star) estimated toward the PDR of the Horsehead is higher than any of the sources in the plot. While Gerin et al. (2009) measured the HCO abundances from separated cold gas and PDRs, the estimated abundances in this study are likely averages of cold gas and PDRs in the clumps, similar to the result of the simple abundance jump model (gray dashed line). Also, we cannot exclude the possibility that the low detection rates of HCO toward non-HII regions (especially toward IR dark non-HIIs) are due to a lack of UV radiation and/or a distance effect.
C2H and c-C3H2 are known as tracers of the surface layers of PDRs exposed to a strong UV field (their highest abundances have been found at visual extinctions of 2 mag < AV < 5 mag, in typical PDRs; Rizzo et al. 2005; Pety et al. 2005; Ginard et al. 2012). These small hydrocarbons have also shown good spatial correlations with H and PAH 8 μm emission observed toward the Horsehead nebula, the Orion Bar, and Mon R2 (Teyssier et al. 2004; Pety et al. 2005; Pilleri et al. 2013; Cuadrado et al. 2015). They were, however, also found in UV shielded regions (Beuther et al. 2008). In Fig. 10, their abundances as well as X(CN) decrease with a more moderate slope compared to the X(HCO) plot. The abundance decrease in the four molecules might be associated with the transitions of the PDRs and the cold envelopes in the clumps.
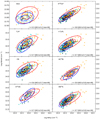 |
Fig. 8 Column density of a given molecule as a function of H2 column density toward HII and non-HII regions with IR dark non-HII regions superposed with black triangles. The ellipses show similar confidence contours as in Fig. 6. The r parameter indicates Pearson correlation coefficients for HII and non-HII regions. |
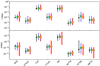 |
Fig. 9 Abundance of the selected molecular species. Upper: relative abundances (f) normalized by C18O column density. Lower: fractional abundances (X) with respect to H2. The red circles, cyan squares, and black triangles indicate HII, IR bright non-HII, and IR dark non-HII regions, respectively.The error bars show full ranges of fractional abundances for each molecule. |
Column densities (N) and fractionalabundances (X and f) relative to H2 and C18 O for HII, IR bright, and dark non-HII regions in a(x) = a × 10x.
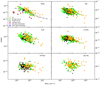 |
Fig. 10 Fractional abundance of HCO, H13CO+, C2 H, c-C3 H2, H13 CO+, and HC15N relative to H2 as a function of N(H2). The orange indicates HII regions, while green and black symbols are IR bright and dark non-HII regions. Most upper left panel: the brown squares indicate nine cold dark clouds from Agúndez et al. (2015). The purple and blue star symbols are HCO abundances from a PDR and cold gas region, which are resolved by the observation, in the Horsehead nebula (Gerin et al. 2009). Top left panel: the gray dashed line represents a simple abundance jump model. |
6 Column density ratios
Molecular abundances are used to quantify the number of molecules in dense clumps. However, column density ratios of chemically related molecules are a more direct way to diagnose chemical enhancement of a specific molecule within a clump. Furthermore, these ratios are insensitive to the unknown beam filling factor, the H2 column density, and uncertainties in the assumed physical conditions for molecular species with similar excitation (Ginard et al. 2012). We here focus on column density ratios of HCO/H13CO+ and c-C3H2/C2H. Before discussing these column density ratios for each pair, we will briefly explain the proposed formation and destruction of HCO and small hydrocarbons in order to assist in interpreting the column density ratios of these molecules.
6.1 Formation of HCO and observational HCO/H13CO+ column density ratio
In prior studies (Gerin et al. 2009; Goicoechea et al. 2009), the HCO and H13 CO+ abundances in cold gas were found to be constant, whereas in PDRs the abundances of these molecules changed due to different chemical reactions. The primary destruction process of H13 CO+ in PDRs is dissociative recombination with electrons, and this happens quickly: H13 CO+ + e− → 13CO + H. On the other hand, the formation of HCO is closely related to FUV radiation in PDRs, and several formation routes have been proposed to describe the high HCO abundance in PDRs via gas-phase reaction or photodissociation (Gerin et al. 2009). The gas-phase formation route has two possible chemical reactions. The first one is a vital formation route of HCO in FUV shielded regions (Schenewerk et al. 1988; Gerin et al. 2009):
 (2)
(2)
The most plausible pure gas-phase route is a reaction of atomic oxygen with carbon radicals in PDRs (Watt 1983; Leung et al. 1984; Schenewerk et al. 1988):
 (3)
(3)
Another suggested formation route is the gas-grain reaction through FUV radiation: photodissociation of formaldehyde (H2 CO) or grain photodesorption. The first route by FUV has been proposed by Schilke et al. (2001),
 (4)
(4)
The second route is by grain photodesorption: HCO forms on grain mantles, and subsequently it is desorpted from the grains into the gas-phase via thermal or/and photo-desorption processes (Gerin et al. 2009). In cold gas regions below ~30 K, thermal desorption does not play a primary role (Gerin et al. 2009), whereas, in warm regions like HII regions, it possibly contributes to HCO desorption. If thermal desorption is not essential, ice-mantle photo-desorption induced by FUV radiation is an alternative process (Willacy & Williams 1993; Bergin et al. 1995). The fact that high X(HCO) is always found in PDRs also supports this photo-desorption process (Schenewerk et al. 1988; Schilke et al. 2001; Gerin et al. 2009).
Since HCO and HCO+ result from different chemical reactions in PDRs and cold gas regions, we compare column densities of these molecules to constrain the origin of the detected HCO and H13 CO+ toward ATLASGAL clumps. H13 CO+ is used to avoid high optical thicknesses. In the upper panel of Fig. 11, N(HCO)/N(H13CO+) ratios decrease with an increase in N(H2), which is closely related to a decrease in X(HCO) because X(H13CO+) is mostly independent of N(H2) (Fig. 10). Besides, results of linear fits for different source types show that HII region sources (red line, slope = −1.02) are slightly shifted toward higher N(HCO)/N(H13CO+) ratios than non-HII region sources (blue line, slope = −1.08). Visually, the separation (as their confidence ellipses) between them is small, and the slope of their fitting lines are similar. However, a small p-value (0.01) from a two-dimensional KS test on the two group distributions indicates that these groups are significantly different samples.
We added X(HCO) and N(HCO)/N(H13CO+) values obser- ved toward a PDR and a cold gas region in the Horsehead nebula (Gerin et al. 2009) in the upper panel of Fig 11, as a reference for the origin of HCO toward ATLASGAL clumps. N(HCO)/N(H13CO+) ratios toward HII (orange color) and non-HII regions (green and black colors) are distributed between the values in the PDR (purple star, HCO peak in the Horsehead nebula) and the cold gas region (blue star, DCO+ peak in the Horse nebula). The HCO in the cold gas area is considered to be originated from the low column density surface of the cold gas regions, not from the UV shielded cold gas region.
The clumps with bigger symbol size indicate X(HCO) greater than10−10, which Gerin et al. (2009) proposed as an indicator of the presence of FUV radiation. All of them are located above a black dashed line corresponding to N(HCO)/N(H13CO+) of 1. According to modeling results for the Horsehead nebula (Gerin et al. 2009), X(HCO) ≳ 10−10 and N(HCO)/ N(H13CO+) ≳ 1 together suggest on-going FUV photochemistry. In addition to that, the observational and modeling results for Mon R2 (Ginard et al. 2012) also found HCO abundant only in PDRs with FUV radiation field (G0 < 103 in units of the Habing field), but not with HUV (like the center of Mon R2, 5 × 10⁵). A high HCO/HCO+ ratio (>0.2) was only found in the low-UV irradiated region. Therefore, the HCO abundances for the clumps with X(HCO) ≳ 10−10 and N(HCO)/N(H13CO+) ≳ 1 probably probe the presence of PDR illuminated by FUV radiation in clumps. It is likely one of the reasons why high X(HCO) and N(HCO)/N(H13CO+) ratios are not always found for HII region sources but also for non-HII regions (especially IR dark non-HII regions marked with black symbols). In previous HCO observations toward starless cores (e.g., Frau et al. 2012; Agúndez et al. 2015), HCO lines were often detected toward sources with H2 column densities lower than 1023 cm−2 (~ some 1022 cm−2). High X(HCO) (≳ 10−10) in our sources is found mostly from the clumps with N(H2) < 1023 cm−2. HCO emission in the clumps with H2 column density of ≥ 1023 cm−2 is detectable because bright, massive star-forming regions provide enough radiation to irradiate such high H2 column density regions, or their surfaces are illuminated by nearby massive stars. Also, it is possible that the UV radiation from the deeply embedded high-mass stars can still penetrate the dense clumps and create the embedded PDRs. The line widths of HCO emission found toward the HII region clumps are significantly broader than those of H13 CO+, which is abundant in cold, dense gas regions as seen in the Horsehead nebula (Gerin et al. 2009), with a small fitting uncertainty (see Fig. 5). This also supports that the HCO emission lines detected toward the clumps with high H2 column densities are not emitted from the dense regions.
In the lower panel of Fig. 11, we compare the column density ratio with dust temperature because one possible HCO formation route is related to thermal grain desorption. The plot shows that thermal-desorption from grains does not seem to play an important role since no correlation is found between the ratios and dust temperatures. The lack of correlation with the dust temperature might indirectly explain the reason that we also found high X(HCO) for non-HII regions, not only HII regions. Even if grain thermal-desorption processes contributes to the observed abundances, it is difficult to probe such a reaction with our current low angular resolution observational data that average HCO emission and dust temperatures over large clumps within single-dish telescope beams. Therefore, the possibility of thermal desorption is not fully excluded from the formation of HCO. If HCO is mainly formed on grain mantles and is desorpted by photons, we need to compare HCO with H2 CO, CH3O and CH3OH. These molecules are also formed on grain mantles by hydrogenation reactions of CO-ice (Tielens & Whittet 1997; Charnley et al. 1997). Studying both HCO and the other molecules allows us to test whether grain photo-desorption processes cause the main formation reaction of HCO in massive clumps. In addition, we also need to have better angular resolution to separate relative contributions of HCO emission from PDRs and cold gas regions. Our observed abundances are lower limit because their emission is averaged over the clumps. Observing with interferometers toward the HCO clumps will allow us more accurate HCO abundances and to have a better understanding of its formation and destruction, and furthermore, complex organic molecules that are formed after HCO.
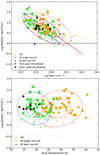 |
Fig. 11 Column density ratio of HCO and H13CO+ molecules as a functionof N(H2) (upper panel) and Tdust (lower panel). The symbols are the same as explained in Fig. 10. The bigger dots indicate sources with their X(HCO) higher than 10−10 (Gerin et al. 2009). The purple and blue stars (upper panel only) represent N(HCO)/N(H13CO+) ratios from the PDR and cold gas region in the Horsehead nebula (Gerin et al. 2009). The red and blue dashed line ellipses are confidence ellipses showing distributions of these two populations (HII and non-HII regions) with 1 and 2σ levels. In the upper plot, the red and blue lines indicate the best-linear regression fits data points of HII and non-HII regions (IR bright and IR dark non-HIIs). Upper panel: the black horizontal dashed line presents that N(HCO)/N(H13CO+) ratios is 1. |
6.2 Formation of small hydrocarbons and observational c-C3H2/C2 column density ratio
The formation of small hydrocarbons is still not fully understood, but several processes of their formation in PDRs have been proposed: gas-phase reactions and grain-surface reactions, such as the photodestruction of PAHs or very small grains (VSGs). In highly UV-illuminated PDRs with high gas temperatures (a few hundreds ~1000 K), within an atomic layer of the PDRs, the gas-phase formation of small hydrocarbon dominates when ionized carbon and electrons are abundant (Cuadrado et al. 2015). Under these conditions, C2 H is formed before c-C3H2 because c-C3H2 needs an additional carbon atom. C2H can be formed by recombination of C2H+,  , or
, or  with electrons in PDRs (e.g., Mookerjea et al. 2012; Cuadrado et al. 2015) via barrierless hydrogenation reactions, for example,
 (5)
(5)
Also, C2H can be formed by photodissociation of acetylene (C2 H2) in gas phase (Lee 1984);
 (6)
(6)
For the gas-phase formation of c-C3H2, C2 H2 and C+ form C3 H+ that reacts with H2 and then produces the linear and cyclic C3 H isomers (Maluendes et al. 1993; McEwan et al. 1999). Through dissociative recombination of these molecules (Fossé et al. 2001), linear and cyclic-C3H2 are formed as
 (7)
(7)
Both C3 H2 isomers are destroyed by photodissociation in a strong-UV radiation field, which in general should destroys small hydrocarbons. Thus, their observed abundances in such PDRs cannot be explained with gas-phase reactions only. Besides, the c-C3H2 abundances in Mon R2 were found to be higher close to the UV-exposed PDR than the C2 H abundances (Pilleri et al. 2013). The formation sequences mentioned above cannot easily result in the high c-C3H2 abundances, and reproducing observed c-C3H2 values with PDR models has been difficult (e.g., c-C3H2 abundances in M8, Tiwari et al. 2019). Another possible way to produce c-C3H2 is grain-surface formation via photons. The photodissociation of small PAHs or VSGs in PDRs provides fresh small hydrocarbons in highly illuminated PDRs (Fuente et al. 2003; Pety et al. 2005) and laboratory experiments also have demonstrated the production of small hydrocarbons from small PAHs (number of carbons ≤ 24, Useli Bacchitta & Joblin 2007). In particular, PAH-related photochemistry enhances the abundance of c-C3H2 in PDRs via dissociative recombination of C3 H with electrons ejected from PAHs or fragmentation of PAHs (Mookerjea et al. 2012; Pilleri et al. 2013).
Although those small hydrocarbons are well-known PDR tracers, their abundances vary from one PDR to the other (e.g., Pety et al. 2005; Mookerjea et al. 2012; Pilleri et al. 2013; Cuadrado et al. 2015; Tiwari et al. 2019). By investigating their abundances for ATLASGAL clumps, we may gain insight into the origin of the detected small hydrocarbons (i.e., C2 H and c-C3H2). Unlike the other PDR tracer, HCO, N(c-C3H2)/N(C2H) in the upper panel of Fig. 12 does not show any correlation with N(H2). The presence of UV radiation and C+ is a necessary factor for the formation of C2H and c-C3H2, and thus, we mark with bigger dots sources with X(HCO) ≳ 10−10 and N(HCO)/N(H13CO+) ≳ 1, which are proposed as diagnostics of the presence of FUV radiation fields and probably C+ (Gerin et al. 2009). However, these sources also do not show any correlation with any of the parameters.
While HCO is found toward a few sources, these small hydrocarbons are ubiquitous in molecular clouds although they are probably more abundant in PDRs. To compare with our beam (~ 30″ corresponding to a size of 0.73 pc at a median distance of 5 kpc for the observed sources), highly illuminated or dense PDRs surrounding young HII regions are spatially very small and thin ( ~0.001 pc, Pilleri et al. 2013). Therefore, the contribution of small hydrocarbons in the cold and low-density molecular envelope surrounding such PDRs and HII regions is presumably dominating the observed emission, as in the case of the molecular envelope of Mon R2. The small hydrocarbons column densities we find in this study are close to averaged values of the molecular envelope and PDRs in Mon R2 or to those of the envelope (Pilleri et al. 2013). We suggest that the origin of the measured abundances of C2 H and c-C3H2 might be from the envelope of clumps rather than the PDR regions.
In low-density ( cm−3) envelopes with low kinetic temperature (Tkin ~ 35 K), many species are presumably locked in the icy mantles of dust grains, and some fraction of them sublimate into the gas-phase during the collapse of prestellar cores (Pilleri et al. 2013). We, therefore, investigated the influences of the kinetic temperature on the small hydrocarbon abundances in ATLASGAL clumps. The lower panel of Fig. 12 shows the N(c-C3H2)/N(C2H) ratio versus the dust temperature of the clumps. Without separating different source groups (HII and non-HII regions), the ratios seem to be constant over the range of dust temperatures (10−40 K) with a large scatter. Previously, Viti et al. (2004) and Pilleri et al. (2013) showed that final abundances of these small hydrocarbons did not show differences in the temperature range of 10−35 K because most of the molecular species are still on grain mantles below Tdust = 35 K. However, when we focus on only HII regions (orange dots), there is a trend of N(c-C3H2)/N(C2H) ratios increasing with dust temperature, and in particular, the sources with high HCO abundances (bigger dots) show an even better correlation (red solid-line confidence ellipses). The dust temperatures of clumps are associated with the evolution of the clumps. In Fig. 13, we compare the small hydrocarbons with bolometric luminosity over clump mass (Lbol∕Mclump) that is used as an evolutionary stage indicator of clumps, and thus higher Lbol∕Mclump refer to more evolved clumps. It is evident that high N(c-C3H2)/N(C2H) ratios are found toward more evolved clumps that are associated with HII regions and have high HCO abundances indirectly probing the presence of FUV radiation fields. According to results of the models for the molecular envelope in Mon R2 and DR21 (Mookerjea et al. 2012; Pilleri et al. 2013), in the cold and low-density molecular envelopes of the regions, grain-surface processes (i.e., CO freeze-out) and time-dependent effects become an important role in the formation and destruction of these molecules. In particular, while abundances of C2 H and c-C3H2 do not vary until 104 yr, after about 105 yr with the development of UC HII regions, the N(c-C3H2)/N(C2H) ratios steeply go up. Depending on early freeze-out fractions, which control the initial small hydrocarbons abundances in the gas-phase, final abundances of these molecules predicted in the models vary. Since we do not have any information about the initial physical conditions in our clumps, it is hard to predict how the grain-surface processes and time-dependent effects affect our observed results. The Stratospheric Observatory for Infrared Astronomy (SOFIA) observations toward M17SW (Pérez-Beaupuits et al. 2012) showed that [C ii] emission was found interestingly throughout deeper parts of the molecular cloud, and a significant fraction of its emission was not associated with other PDR tracers (i.e., CO J = 13−12 and [C i]). This means that C+ gas, probed by [C ii] spectral lines, can exist in deeper molecular clouds. Thus, we cannot exclude that C+ can contribute to the formation of small hydrocarbon via gas-phase reactions in such molecular envelop regions. In addition, photodissociation of PAH molecules in different strengths of UV radiation fields can add some fraction of small hydrocarbons abundances in gas-phase. According to Murga et al. (2020), in high-UV illuminated regions (i.e., the Orion Bar), the PAH dissociation becomes more important at AV > 3.5 molecular gas region than gas-phase reaction to produce C2 H2, which is one of precursors of C2H and c-C3H2 as mentioned above. On the other hand, in low-UV radiation, pure gas-phase reaction is a main route to increase the production rate of C2 H2. Since the more evolved clumps shown in Fig. 13 emit stronger UV radiation, it is possible that the measured abundances of the small hydrocarbons are still associated with the photodissociation. We suggest that the small hydrocarbons we observe toward clumps hosting HII regions likely originate mostly in the molecular envelope around dense PDRs and HII regions. In particular, abundances of these molecules might be a combined result of grain-surface processes controlling initial molecular abundances in the gas-phase and subsequent time-dependent evolution in environments with a significant C+ abundance. Also, some fraction of these small hydrocarbon abundances in the HII sources can be resulted of photodissociation of PAH molecules by the UV radiation from the newly born high-mass stars.
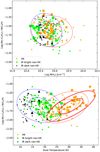 |
Fig. 12 Upper: column density ratio of c-C3H2 and C2 H as a function of N(H2). Lower: N(c-C3H2)/N(C2H) ratios as a function of Tclump. Symbols and lines are the same as Fig. 11. |
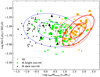 |
Fig. 13 Column density ratio of c-C3H2 and C2 H as a function of clump bolometirc luminosity over their mass (Lbol∕Mclump). Symbols and lines are the same as in Fig. 11. |
7 Summary and conclusion
We have investigated ten molecular transitions from HCO, H13 CO+, HOC+, C2 H, c-C3H2, CN, H13CN, HC15N, HN13C, and C18 O covered in an unbiased molecular line survey of the 3 mm band that was observed using the IRAM 30 m telescope toward 409 ATLASGAL clumps. TheATLASGAL clumps were divided into three groups based on the presence of HII regions and infrared emission: HII, IR bright non-HII, and dark non-HII region sources. We carried out an analysis of the column density and abundance of the selected molecules, and our main results are as follows:
-
C18O, H13CO+, C2H, c-C3H2, CN, and HN13C. H13CN show high detection rates (higher than 94%), whereas H13CN, HCO, and HC15N are detected with detection rates of 75, 32, and 39%, respectively. The non-detections of the HCO, H13CN and HC15N transitions are mostly from the IR-bright and IR-dark non-HII regions, while high detection rates of the molecular transitions toward HII region sources were found, namely HCO in 66%, H13CN in 93% and HC15N in 79% of the regions.
-
While the abundances of high column density tracers (i.e., H13CO+, and HC15N) are almost constant over the range of H2 column densities, the abundances of HCO, CN, C2H and c-C3H2 drop with an increase of H2 column density. In particular, the HCO abundances are prominently reduced in high H2 column density, and they seem higher toward HII regions than toward non-HII regions for a given H2 column density.
-
We also find that N(HCO)/N(H13CO+) ratios decrease as H2 column density increase, and 61 clumps have X(HCO) ≳ 10−10 and N(HCO)/N(H13CO+) ≳ 1. This implies that the HCO detected toward ATLASGAL clumps is likely connected to PDRs, and the sources with high HCO abundances are associated with on-going FUV chemistry in their PDRs. However, due to low angular resolution of our data, the measured HCO abundances in the ATLASGAL clumps are averages over their PDRs and FUV shielded molecular gas regions.
-
The c-C3H2/C2H ratios toward the dust clumps are constant with H2 column density and dust temperature, although with large scatter. However, toward only HII regions having high HCO abundances, their c-C3H2/C2H ratios evidently rise with dust temperatures. Especially, high c-C3H2/C2H ratios are found toward more evolved clumps with high Lbol/Mclump. These results show similar trends with the model results of Pilleri et al. (2013) that predict increasing c-C3H2/C2H ratios with the time after the age of 105 yr. Therefore, the measured abundances of small hydrocarbons in this study are possibly results of grain-surface processes (CO freeze-out fractions) and time-dependent effects in the clumps rather than in the PDRs. In addition, some fraction of the measured abundances toward the HII sources can be added as the result of the photodissociation of PAH molecules.
Acknowledgements
We would like to thank the referee for their constructive comments and suggestions that have helped to improve thispaper. W.-J.K.was supported for this research through a stipend from the International Max Planck Research School (IMPRS) for Astronomy and Astrophysics at the Universities of Bonn and Cologne. This work was partially funded by the Collaborate Research Council 956, subproject A6, funded by the Deutsche Forschungsgemeinschaft. The ATLASGAL project is a collaboration between the Max-Planck-Gesellschaft, the European Southern Observatory (ESO) and the Universidad de Chile. It includes projects E-181.C-0885, E-078.F-9040(A), M-079.C-9501(A), M-081.C-9501(A) plus Chilean data. This document was produced using the Overleaf web application, which can be found at www.overleaf.com.
Appendix A Detection rates of molecular lines with source distance
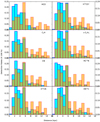 |
Fig. A.1 Detection rate as a function of distance. |
Appendix B Linewidth of molecular lines with source distance
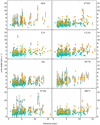 |
Fig. B.1 Line width as a function of distance. |
Appendix C Integrated intensity ratios
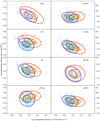 |
Fig. C.1 Integrated intensity ratio of X/C18O as a functionof integrated intensity of C18O. The X refers to noted molecular species. The orange and cyan symbols indicate HII and non-HII regions, respectively. The red (HII regions) and blue (non-HII regions) eclipses represent covariance error ellipses showing the distributions of the data points. |
References
- Agúndez, M., Cernicharo, J., & Guélin, M. 2015, A&A, 577, L5 [NASA ADS] [CrossRef] [EDP Sciences] [Google Scholar]
- Bacmann, A., Lefloch, B., Ceccarelli, C., et al. 2002, A&A, 389, L6 [NASA ADS] [CrossRef] [EDP Sciences] [Google Scholar]
- Bergin, E. A., Langer, W. D., & Goldsmith, P. F. 1995, ApJ, 441, 222 [NASA ADS] [CrossRef] [Google Scholar]
- Beuther, H., Semenov, D., Henning, T., & Linz, H. 2008, ApJ, 675, L33 [NASA ADS] [CrossRef] [Google Scholar]
- Boger, G. I., & Sternberg, A. 2005, ApJ, 632, 302 [NASA ADS] [CrossRef] [Google Scholar]
- Caselli, P., Walmsley, C. M., Tafalla, M., Dore, L., & Myers, P. C. 1999, ApJ, 523, L165 [Google Scholar]
- Charnley, S. B., Tielens, A. G. G. M., & Rodgers, S. D. 1997, ApJ, 482, L203 [NASA ADS] [CrossRef] [Google Scholar]
- Contreras, Y., Schuller, F., Urquhart, J. S., et al. 2013, A&A, 549, A45 [NASA ADS] [CrossRef] [EDP Sciences] [Google Scholar]
- Csengeri, T., Leurini, S., Wyrowski, F., et al. 2016, A&A, 586, A149 [NASA ADS] [CrossRef] [EDP Sciences] [Google Scholar]
- Cuadrado, S., Goicoechea, J. R., Pilleri, P., et al. 2015, A&A, 575, A82 [NASA ADS] [CrossRef] [EDP Sciences] [Google Scholar]
- Fossé, D., Cernicharo, J., Gerin, M., & Cox, P. 2001, ApJ, 552, 168 [NASA ADS] [CrossRef] [Google Scholar]
- Frau, P., Girart, J. M., & Beltrán, M. T. 2012, A&A, 537, L9 [NASA ADS] [CrossRef] [EDP Sciences] [Google Scholar]
- Fuente, A., Martin-Pintado, J., Cernicharo, J., & Bachiller, R. 1993, A&A, 276, 473 [NASA ADS] [Google Scholar]
- Fuente, A., Rodrıguez-Franco, A., Garcıa-Burillo, S., Martın-Pintado, J., & Black, J. H. 2003, A&A, 406, 899 [NASA ADS] [CrossRef] [EDP Sciences] [Google Scholar]
- Fuente, A., García-Burillo, S., Gerin, M., et al. 2005, ApJ, 619, L155 [NASA ADS] [CrossRef] [Google Scholar]
- García-Burillo, S., Martín-Pintado, J., Fuente, A., Usero, A., & Neri, R. 2002, ApJ, 575, L55 [NASA ADS] [CrossRef] [Google Scholar]
- Gerin, M., Goicoechea, J. R., Pety, J., & Hily-Blant, P. 2009, A&A, 494, 977 [NASA ADS] [CrossRef] [EDP Sciences] [Google Scholar]
- Gerner, T., Beuther, H., Semenov, D., et al. 2014, A&A, 563, A97 [NASA ADS] [CrossRef] [EDP Sciences] [Google Scholar]
- Giannetti, A., Wyrowski, F., Brand, J., et al. 2014, A&A, 570, A65 [NASA ADS] [CrossRef] [EDP Sciences] [Google Scholar]
- Ginard, D., González-García, M., Fuente, A., et al. 2012, A&A, 543, A27 [NASA ADS] [CrossRef] [EDP Sciences] [Google Scholar]
- Goicoechea, J. R., Pety, J., Gerin, M., Hily-Blant, P., & Le Bourlot, J. 2009, A&A, 498, 771 [NASA ADS] [CrossRef] [EDP Sciences] [Google Scholar]
- Goldsmith, P. F., Irvine, W. M., Hjalmarson, A., & Ellder, J. 1986, ApJ, 310, 383 [NASA ADS] [CrossRef] [PubMed] [Google Scholar]
- Hogerheijde, M. R., Jansen, D. J., & van Dishoeck, E. F. 1995, A&A, 294, 792 [NASA ADS] [Google Scholar]
- Jansen, D. J., Spaans, M., Hogerheijde, M. R., & van Dishoeck, E. F. 1995, A&A, 303, 541 [NASA ADS] [Google Scholar]
- Jin, M., Lee, J.-E., & Kim, K.-T. 2015, ApJS, 219, 2 [NASA ADS] [CrossRef] [Google Scholar]
- Kim, W.-J., Wyrowski, F., Urquhart, J. S., Menten, K. M., & Csengeri, T. 2017, A&A, 602, A37 [NASA ADS] [CrossRef] [EDP Sciences] [Google Scholar]
- Kim, W. J., Urquhart, J. S., Wyrowski, F., Menten, K. M., & Csengeri, T. 2018, A&A, 616, A107 [NASA ADS] [CrossRef] [EDP Sciences] [Google Scholar]
- König, C., Urquhart, J. S., Csengeri, T., et al. 2017, A&A, 599, A139 [NASA ADS] [CrossRef] [EDP Sciences] [Google Scholar]
- Lee, L. C. 1984, ApJ, 282, 172 [NASA ADS] [CrossRef] [Google Scholar]
- Leung, C. M., Herbst, E., & Huebner, W. F. 1984, ApJS, 56, 231 [NASA ADS] [CrossRef] [Google Scholar]
- Lucas, R. 1976, A&A, 46, 473 [NASA ADS] [Google Scholar]
- Maluendes, S. A., McLean, A. D., Yamashita, K., & Herbst, E. 1993, J. Chem. Phys., 99, 2812 [NASA ADS] [CrossRef] [Google Scholar]
- McEwan, M. J., Scott, G. B. I., Adams, N. G., et al. 1999, ApJ, 513, 287 [NASA ADS] [CrossRef] [Google Scholar]
- Miettinen, O. 2020, A&A, 639, A65 [CrossRef] [EDP Sciences] [Google Scholar]
- Mookerjea, B., Hassel, G. E., Gerin, M., et al. 2012, A&A, 546, A75 [NASA ADS] [CrossRef] [EDP Sciences] [Google Scholar]
- Müller, H. S. P., Thorwirth, S., Roth, D. A., & Winnewisser, G. 2001, A&A, 370, L49 [NASA ADS] [CrossRef] [EDP Sciences] [Google Scholar]
- Murga, M. S., Kirsanova, M. S., Vasyunin, A. I., & Pavlyuchenkov, Y. N. 2020, MNRAS, 497, 2327 [CrossRef] [Google Scholar]
- Myers, P. C., Mardones, D., Tafalla, M., Williams, J. P., & Wilner, D. J. 1996, ApJ, 465, L133 [NASA ADS] [CrossRef] [Google Scholar]
- Pérez-Beaupuits, J. P., Wiesemeyer, H., Ossenkopf, V., et al. 2012, A&A, 542, L13 [NASA ADS] [CrossRef] [EDP Sciences] [Google Scholar]
- Pety, J. 2005, SF2A-2005: Semaine de l’Astrophysique Francaise, eds. F. Casoli, T. Contini, J. M. Hameury, & L. Pagani, 721 [Google Scholar]
- Pety, J., Teyssier, D., Fossé, D., et al. 2005, A&A, 435, 885 [NASA ADS] [CrossRef] [EDP Sciences] [Google Scholar]
- Pickett, H. M., Poynter, R. L., Cohen, E. A., et al. 1998, J. Quant. Spectr. Rad. Transf., 60, 883 [Google Scholar]
- Pilleri, P., Treviño-Morales, S., Fuente, A., et al. 2013, A&A, 554, A87 [NASA ADS] [CrossRef] [EDP Sciences] [Google Scholar]
- Rathborne, J. M., Whitaker, J. S., Jackson, J. M., et al. 2016, PASA, 33, e030 [NASA ADS] [CrossRef] [Google Scholar]
- Rawlings, J. M. C., Taylor, S. D., & Williams, D. A. 2000, MNRAS, 313, 461 [NASA ADS] [CrossRef] [Google Scholar]
- Rizzo, J. R., Fuente, A., Rodríguez-Franco, A., & García-Burillo, S. 2003, ApJ, 597, L153 [NASA ADS] [CrossRef] [Google Scholar]
- Rizzo, J. R., Fuente, A., & García-Burillo, S. 2005, ApJ, 634, 1133 [NASA ADS] [CrossRef] [Google Scholar]
- Rodriguez-Franco, A., Martin-Pintado, J., & Fuente, A. 1998, A&A, 329, 1097 [NASA ADS] [Google Scholar]
- Sanhueza, P., Jackson, J. M., Foster, J. B., et al. 2012, ApJ, 756, 60 [NASA ADS] [CrossRef] [Google Scholar]
- Savage, C., & Ziurys, L. M. 2004, ApJ, 616, 966 [NASA ADS] [CrossRef] [Google Scholar]
- Schenewerk, M. S., Jewell, P. R., Snyder, L. E., Hollis, J. M., & Ziurys, L. M. 1988, ApJ, 328, 785 [NASA ADS] [CrossRef] [Google Scholar]
- Schilke, P., Walmsley, C. M., Pineau Des Forets, G., et al. 1992, A&A, 256, 595 [Google Scholar]
- Schilke, P., Pineau des Forêts, G., Walmsley, C. M., & Martín-Pintado, J. 2001, A&A, 372, 291 [NASA ADS] [CrossRef] [EDP Sciences] [Google Scholar]
- Schöier, F. L., van der Tak, F. F. S., van Dishoeck, E. F., & Black, J. H. 2005, A&A, 432, 369 [NASA ADS] [CrossRef] [EDP Sciences] [Google Scholar]
- Simon, R., Stutzki, J., Sternberg, A., & Winnewisser, G. 1997, A&A, 327, L9 [NASA ADS] [Google Scholar]
- Smith, R. J., Shetty, R., Stutz, A. M., & Klessen, R. S. 2012, ApJ, 750, 64 [NASA ADS] [CrossRef] [Google Scholar]
- Sternberg, A., & Dalgarno, A. 1995, ApJS, 99, 565 [NASA ADS] [CrossRef] [Google Scholar]
- Teyssier, D., Fossé, D., Gerin, M., et al. 2004, A&A, 417, 135 [NASA ADS] [CrossRef] [EDP Sciences] [Google Scholar]
- Tielens, A. G. G. M. 2013, Planets, Stars and Stellar Systems, eds. T. D. Oswalt, & G. Gilmore (Dordrecht: Springer), 499 [CrossRef] [Google Scholar]
- Tielens, A. G. G. M., & Hollenbach, D. 1985, ApJ, 291, 722 [NASA ADS] [CrossRef] [Google Scholar]
- Tielens, A. G. G. M., & Whittet, D. C. B. 1997, IAU Symp., 178, 45 [Google Scholar]
- Tiwari, M., Menten, K. M., Wyrowski, F., et al. 2019, A&A, 626, A28 [CrossRef] [EDP Sciences] [Google Scholar]
- Urquhart, J. S., Thompson, M. A., Moore, T. J. T., et al. 2013, MNRAS, 435, 400 [NASA ADS] [CrossRef] [Google Scholar]
- Urquhart, J. S., Csengeri, T., Wyrowski, F., et al. 2014, A&A, 568, A41 [NASA ADS] [CrossRef] [EDP Sciences] [Google Scholar]
- Urquhart, J. S., König, C., Giannetti, A., et al. 2018, MNRAS, 473, 1059 [NASA ADS] [CrossRef] [Google Scholar]
- Urquhart, J. S., Figura, C., Wyrowski, F., et al. 2019, MNRAS, 484, 4444 [NASA ADS] [CrossRef] [Google Scholar]
- Useli Bacchitta, F., & Joblin, C. 2007, Molecules in Space and Laboratory, 89 [Google Scholar]
- Vasyunina, T., Linz, H., Henning, T., et al. 2011, A&A, 527, A88 [NASA ADS] [CrossRef] [EDP Sciences] [Google Scholar]
- Viti, S., Collings, M. P., Dever, J. W., McCoustra, M. R. S., & Williams, D. A. 2004, MNRAS, 354, 1141 [NASA ADS] [CrossRef] [Google Scholar]
- Watt, G. D. 1983, MNRAS, 205, 321 [NASA ADS] [CrossRef] [Google Scholar]
- Wienen, M., Wyrowski, F., Schuller, F., et al. 2012, A&A, 544, A146 [NASA ADS] [CrossRef] [EDP Sciences] [Google Scholar]
- Willacy, K., & Williams, D. A. 1993, MNRAS, 260, 635 [NASA ADS] [Google Scholar]
- Wyrowski, F., Güsten, R., Menten, K. M., et al. 2016, A&A, 585, A149 [NASA ADS] [CrossRef] [EDP Sciences] [Google Scholar]
- Zinnecker, H., & Yorke, H. W. 2007, ARA&A, 45, 481 [NASA ADS] [CrossRef] [Google Scholar]
The UV radiation field is in Habing untits, which are a measure of the average far-UV interstellar radiation field; G0 = 1 corresponds to a flux of 1.6 × 10⁻³ erg cm−2 s−1.
In the two-dimensional case, 1σ and 2σ show 39.4 and 86.5% confidences, respectively.
All Tables
Column densities (N) and fractionalabundances (X and f) relative to H2 and C18 O for HII, IR bright, and dark non-HII regions in a(x) = a × 10x.
All Figures
|
Fig. 1 Spectra of C2H hyperfine lines toward two example sources (AGAL015.013−00.671 and AGAL045.474+00.134). |
| In the text | |
|
Fig. 2 From top to bottom: spectra of HCO, CN, c-C3H2, HC15 N, H13 CN, HN13 C, H13 CO+, and C18 O toward the same example sources as in Fig. 1. Hyperfine structure fitting was used for H13 CN, and Gaussian profiles for the other molecular lines. The green lines represent Gaussian and HFS fitting results, and the red lines indicate the systemic velocity. HCO (1−0) was not detected toward AGAL045.474+00.134. |
| In the text | |
|
Fig. 3 Self-absorption of CN lines of AGAL011.936−00.616 (left) and AGAL031.281+0.062 (right). The displayed spectral lines are CN (NJ = 1(1∕2)−0(1∕2)) and 13 CN (N = 1− 0, J = 3∕2−1∕2, F1 = 2−1, F = 3−2) transitions. The red vertical lines indicate the systemic velocities measured by H13 CO+ lines. |
| In the text | |
|
Fig. 4 Detection rates of typical PDR tracer molecules and C18O as a reference molecule. Binomial statistics were used for estimating uncertainties marked with the red and blue error bars. |
| In the text | |
|
Fig. 5 Mean, median, and a standard deviation (σ) of line widths of the selected molecular lines. The σ shows the source to source variation of the widths. The error bars for the mean and median values are based on typical Gaussian fit errors with 2σ. The error bars of the standard deviation of line widths is the standard deviation error. Different colors show three subgroups of our sample, which are HII in orange, IR bright in green, and IR dark non-HII regions in black. |
| In the text | |
|
Fig. 6 Orange circles indicate ATLASGAL clumps containing HII regions and the cyan circles represent clumps without the presenceof HII regions, which consist of IR bright non-HII and dark non-HII regions. The black dashed lines indicate equality. The error bars are obtained from Gaussian or HFS fits. The red and blue ellipses are covariance error ellipses with 1σ (inner ellipse) and 2σ (outer ellipse) for the two groups. |
| In the text | |
|
Fig. 7 Cumulative distribution plots of integrated intensity ratios of C2H to c-C3 H2 (left panel), CN to c-C3H2 (middle panel), and to HN13C (right panel). The orange curves are HII regions. The green and black curves indicate IR bright non-HII and IR dark non-HII regions. |
| In the text | |
|
Fig. 8 Column density of a given molecule as a function of H2 column density toward HII and non-HII regions with IR dark non-HII regions superposed with black triangles. The ellipses show similar confidence contours as in Fig. 6. The r parameter indicates Pearson correlation coefficients for HII and non-HII regions. |
| In the text | |
|
Fig. 9 Abundance of the selected molecular species. Upper: relative abundances (f) normalized by C18O column density. Lower: fractional abundances (X) with respect to H2. The red circles, cyan squares, and black triangles indicate HII, IR bright non-HII, and IR dark non-HII regions, respectively.The error bars show full ranges of fractional abundances for each molecule. |
| In the text | |
|
Fig. 10 Fractional abundance of HCO, H13CO+, C2 H, c-C3 H2, H13 CO+, and HC15N relative to H2 as a function of N(H2). The orange indicates HII regions, while green and black symbols are IR bright and dark non-HII regions. Most upper left panel: the brown squares indicate nine cold dark clouds from Agúndez et al. (2015). The purple and blue star symbols are HCO abundances from a PDR and cold gas region, which are resolved by the observation, in the Horsehead nebula (Gerin et al. 2009). Top left panel: the gray dashed line represents a simple abundance jump model. |
| In the text | |
|
Fig. 11 Column density ratio of HCO and H13CO+ molecules as a functionof N(H2) (upper panel) and Tdust (lower panel). The symbols are the same as explained in Fig. 10. The bigger dots indicate sources with their X(HCO) higher than 10−10 (Gerin et al. 2009). The purple and blue stars (upper panel only) represent N(HCO)/N(H13CO+) ratios from the PDR and cold gas region in the Horsehead nebula (Gerin et al. 2009). The red and blue dashed line ellipses are confidence ellipses showing distributions of these two populations (HII and non-HII regions) with 1 and 2σ levels. In the upper plot, the red and blue lines indicate the best-linear regression fits data points of HII and non-HII regions (IR bright and IR dark non-HIIs). Upper panel: the black horizontal dashed line presents that N(HCO)/N(H13CO+) ratios is 1. |
| In the text | |
|
Fig. 12 Upper: column density ratio of c-C3H2 and C2 H as a function of N(H2). Lower: N(c-C3H2)/N(C2H) ratios as a function of Tclump. Symbols and lines are the same as Fig. 11. |
| In the text | |
|
Fig. 13 Column density ratio of c-C3H2 and C2 H as a function of clump bolometirc luminosity over their mass (Lbol∕Mclump). Symbols and lines are the same as in Fig. 11. |
| In the text | |
|
Fig. A.1 Detection rate as a function of distance. |
| In the text | |
|
Fig. B.1 Line width as a function of distance. |
| In the text | |
|
Fig. C.1 Integrated intensity ratio of X/C18O as a functionof integrated intensity of C18O. The X refers to noted molecular species. The orange and cyan symbols indicate HII and non-HII regions, respectively. The red (HII regions) and blue (non-HII regions) eclipses represent covariance error ellipses showing the distributions of the data points. |
| In the text | |
Current usage metrics show cumulative count of Article Views (full-text article views including HTML views, PDF and ePub downloads, according to the available data) and Abstracts Views on Vision4Press platform.
Data correspond to usage on the plateform after 2015. The current usage metrics is available 48-96 hours after online publication and is updated daily on week days.
Initial download of the metrics may take a while.