Fig. 2
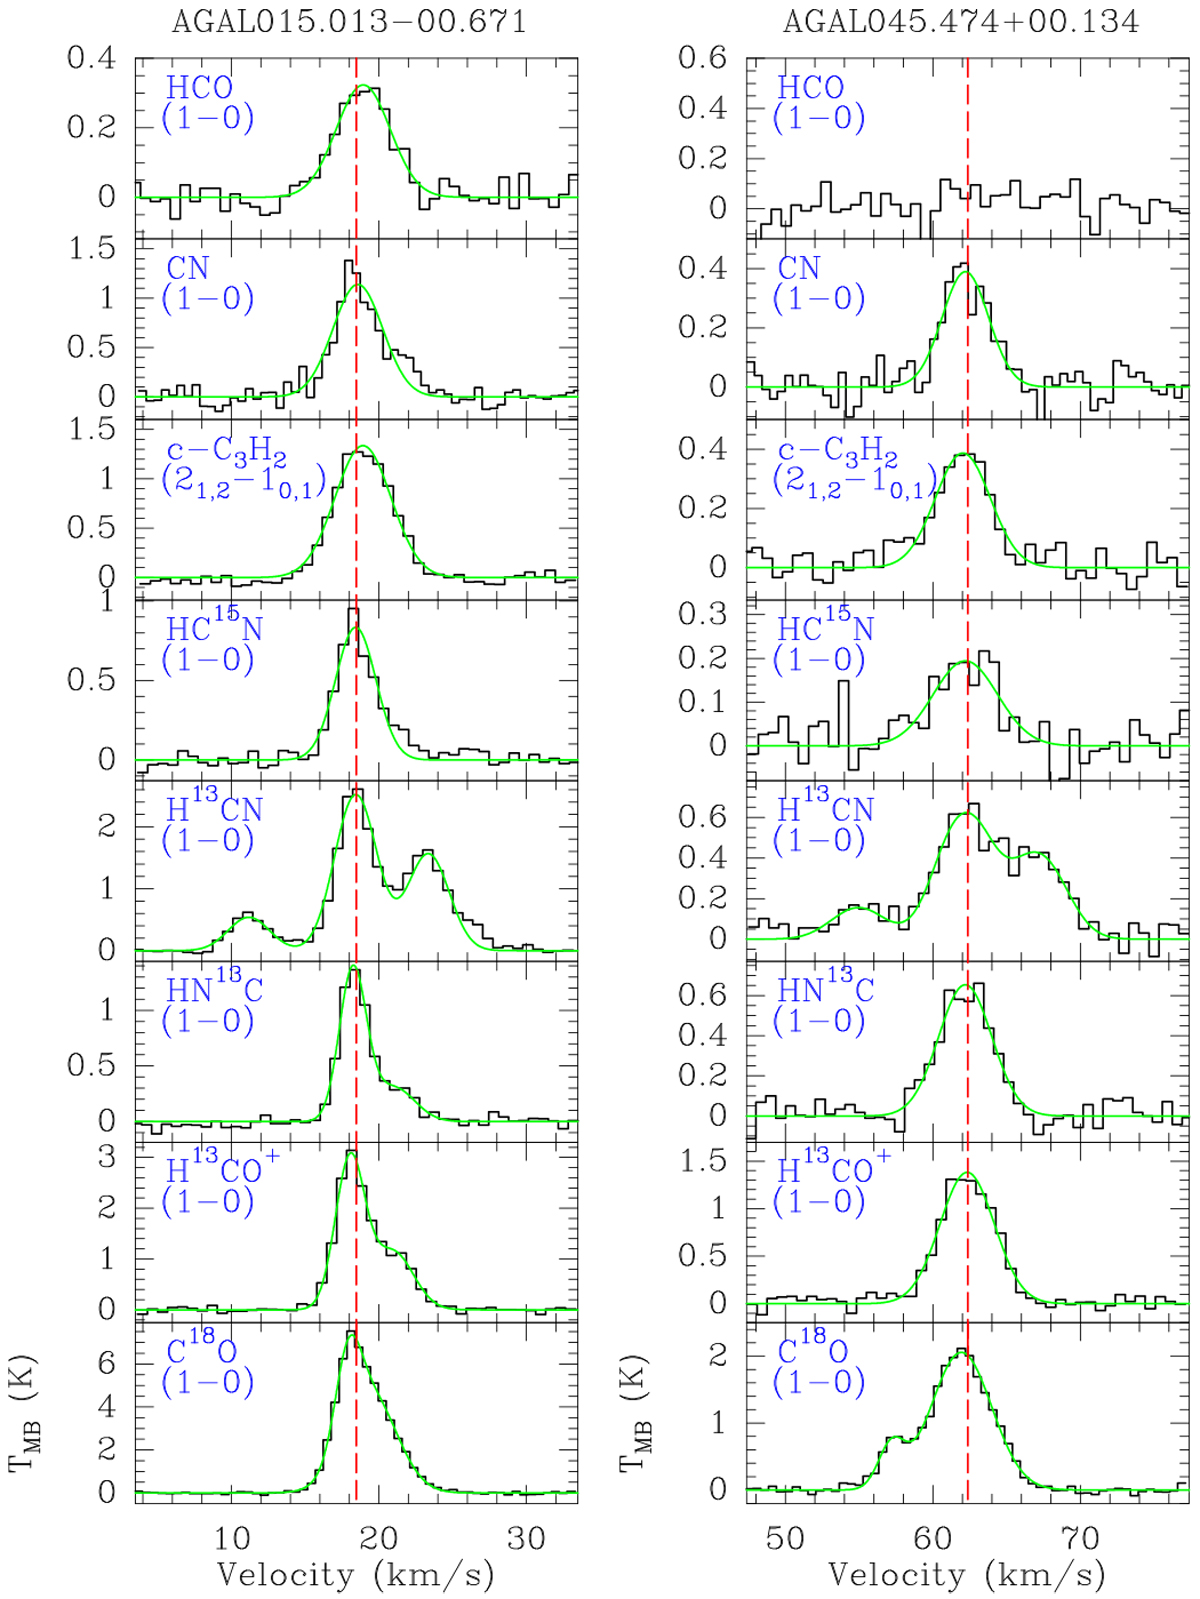
From top to bottom: spectra of HCO, CN, c-C3H2, HC15 N, H13 CN, HN13 C, H13 CO+, and C18 O toward the same example sources as in Fig. 1. Hyperfine structure fitting was used for H13 CN, and Gaussian profiles for the other molecular lines. The green lines represent Gaussian and HFS fitting results, and the red lines indicate the systemic velocity. HCO (1−0) was not detected toward AGAL045.474+00.134.
Current usage metrics show cumulative count of Article Views (full-text article views including HTML views, PDF and ePub downloads, according to the available data) and Abstracts Views on Vision4Press platform.
Data correspond to usage on the plateform after 2015. The current usage metrics is available 48-96 hours after online publication and is updated daily on week days.
Initial download of the metrics may take a while.