Fig. 10
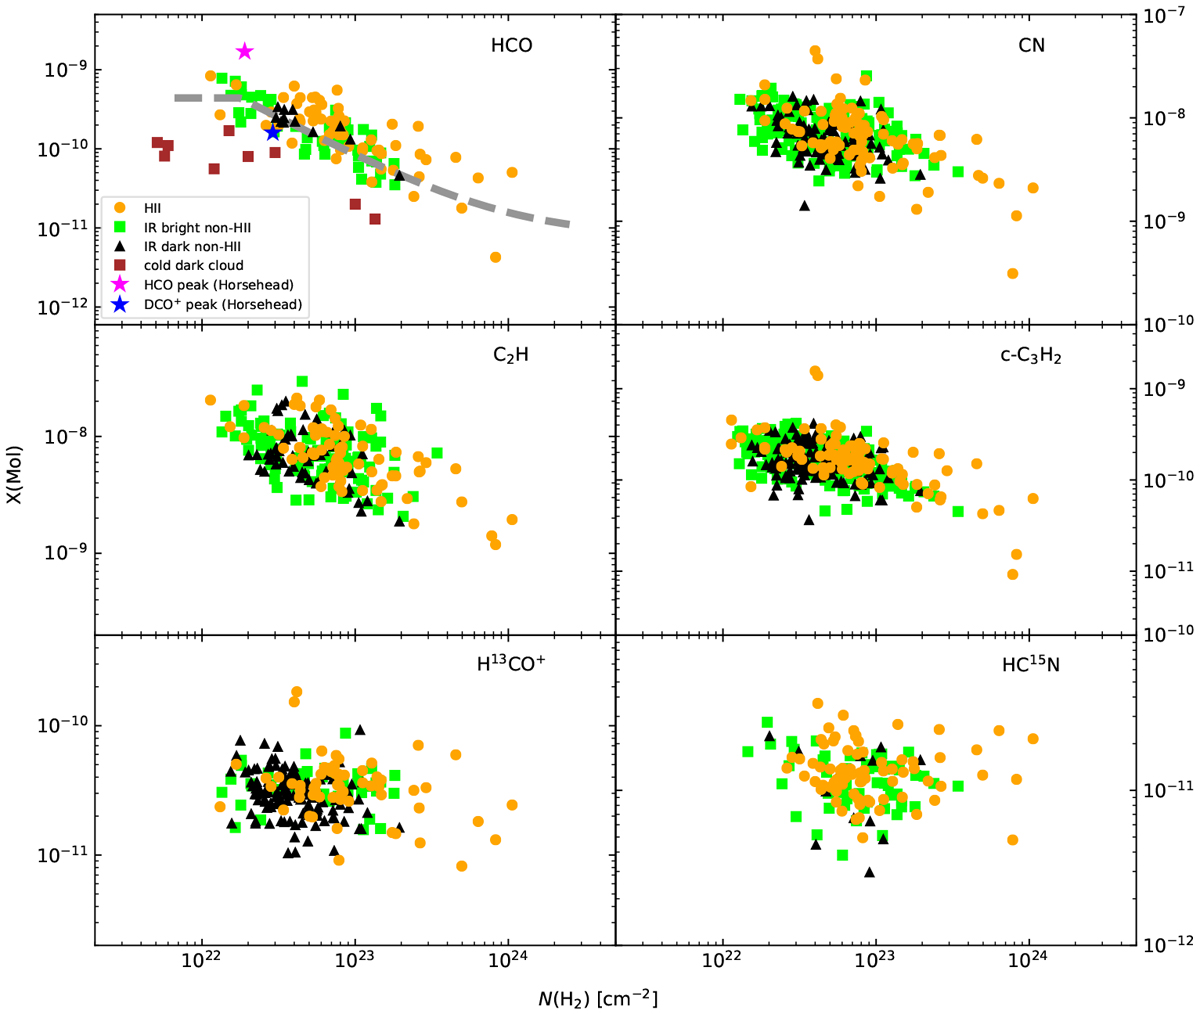
Fractional abundance of HCO, H13CO+, C2 H, c-C3 H2, H13 CO+, and HC15N relative to H2 as a function of N(H2). The orange indicates HII regions, while green and black symbols are IR bright and dark non-HII regions. Most upper left panel: the brown squares indicate nine cold dark clouds from Agúndez et al. (2015). The purple and blue star symbols are HCO abundances from a PDR and cold gas region, which are resolved by the observation, in the Horsehead nebula (Gerin et al. 2009). Top left panel: the gray dashed line represents a simple abundance jump model.
Current usage metrics show cumulative count of Article Views (full-text article views including HTML views, PDF and ePub downloads, according to the available data) and Abstracts Views on Vision4Press platform.
Data correspond to usage on the plateform after 2015. The current usage metrics is available 48-96 hours after online publication and is updated daily on week days.
Initial download of the metrics may take a while.