Fig. 9
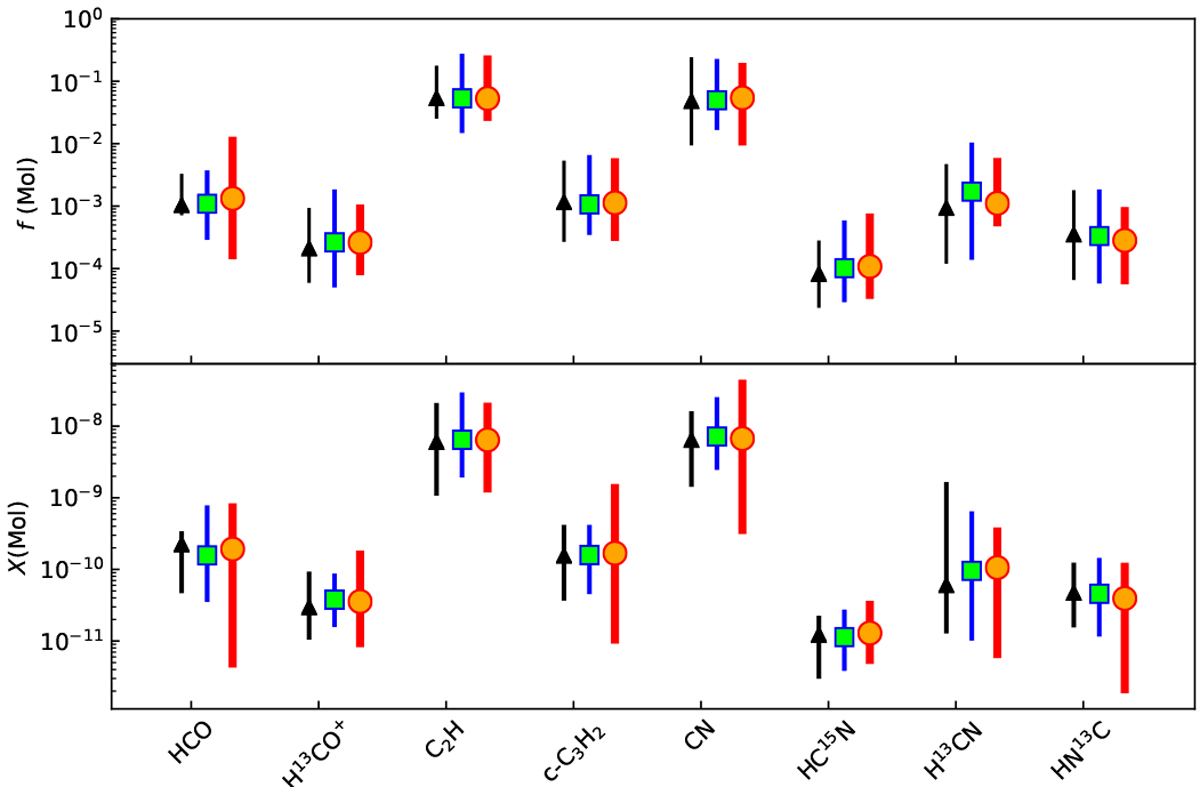
Abundance of the selected molecular species. Upper: relative abundances (f) normalized by C18O column density. Lower: fractional abundances (X) with respect to H2. The red circles, cyan squares, and black triangles indicate HII, IR bright non-HII, and IR dark non-HII regions, respectively.The error bars show full ranges of fractional abundances for each molecule.
Current usage metrics show cumulative count of Article Views (full-text article views including HTML views, PDF and ePub downloads, according to the available data) and Abstracts Views on Vision4Press platform.
Data correspond to usage on the plateform after 2015. The current usage metrics is available 48-96 hours after online publication and is updated daily on week days.
Initial download of the metrics may take a while.