Fig. C.1
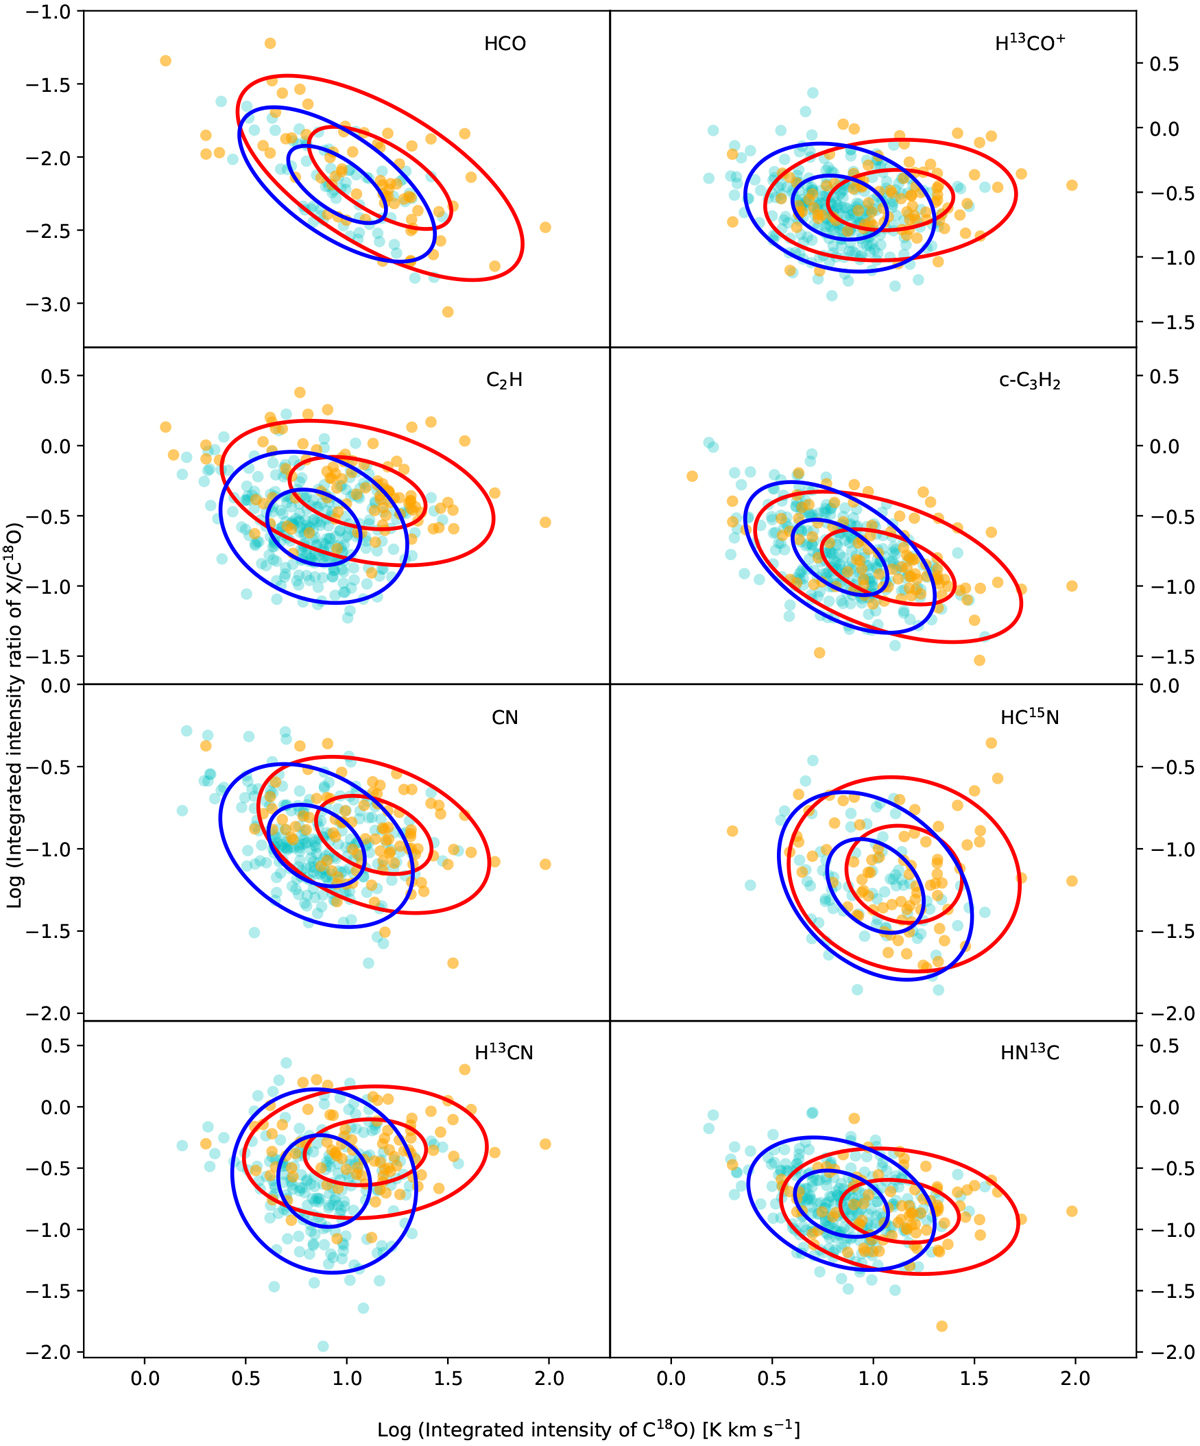
Integrated intensity ratio of X/C18O as a functionof integrated intensity of C18O. The X refers to noted molecular species. The orange and cyan symbols indicate HII and non-HII regions, respectively. The red (HII regions) and blue (non-HII regions) eclipses represent covariance error ellipses showing the distributions of the data points.
Current usage metrics show cumulative count of Article Views (full-text article views including HTML views, PDF and ePub downloads, according to the available data) and Abstracts Views on Vision4Press platform.
Data correspond to usage on the plateform after 2015. The current usage metrics is available 48-96 hours after online publication and is updated daily on week days.
Initial download of the metrics may take a while.