Fig. 11
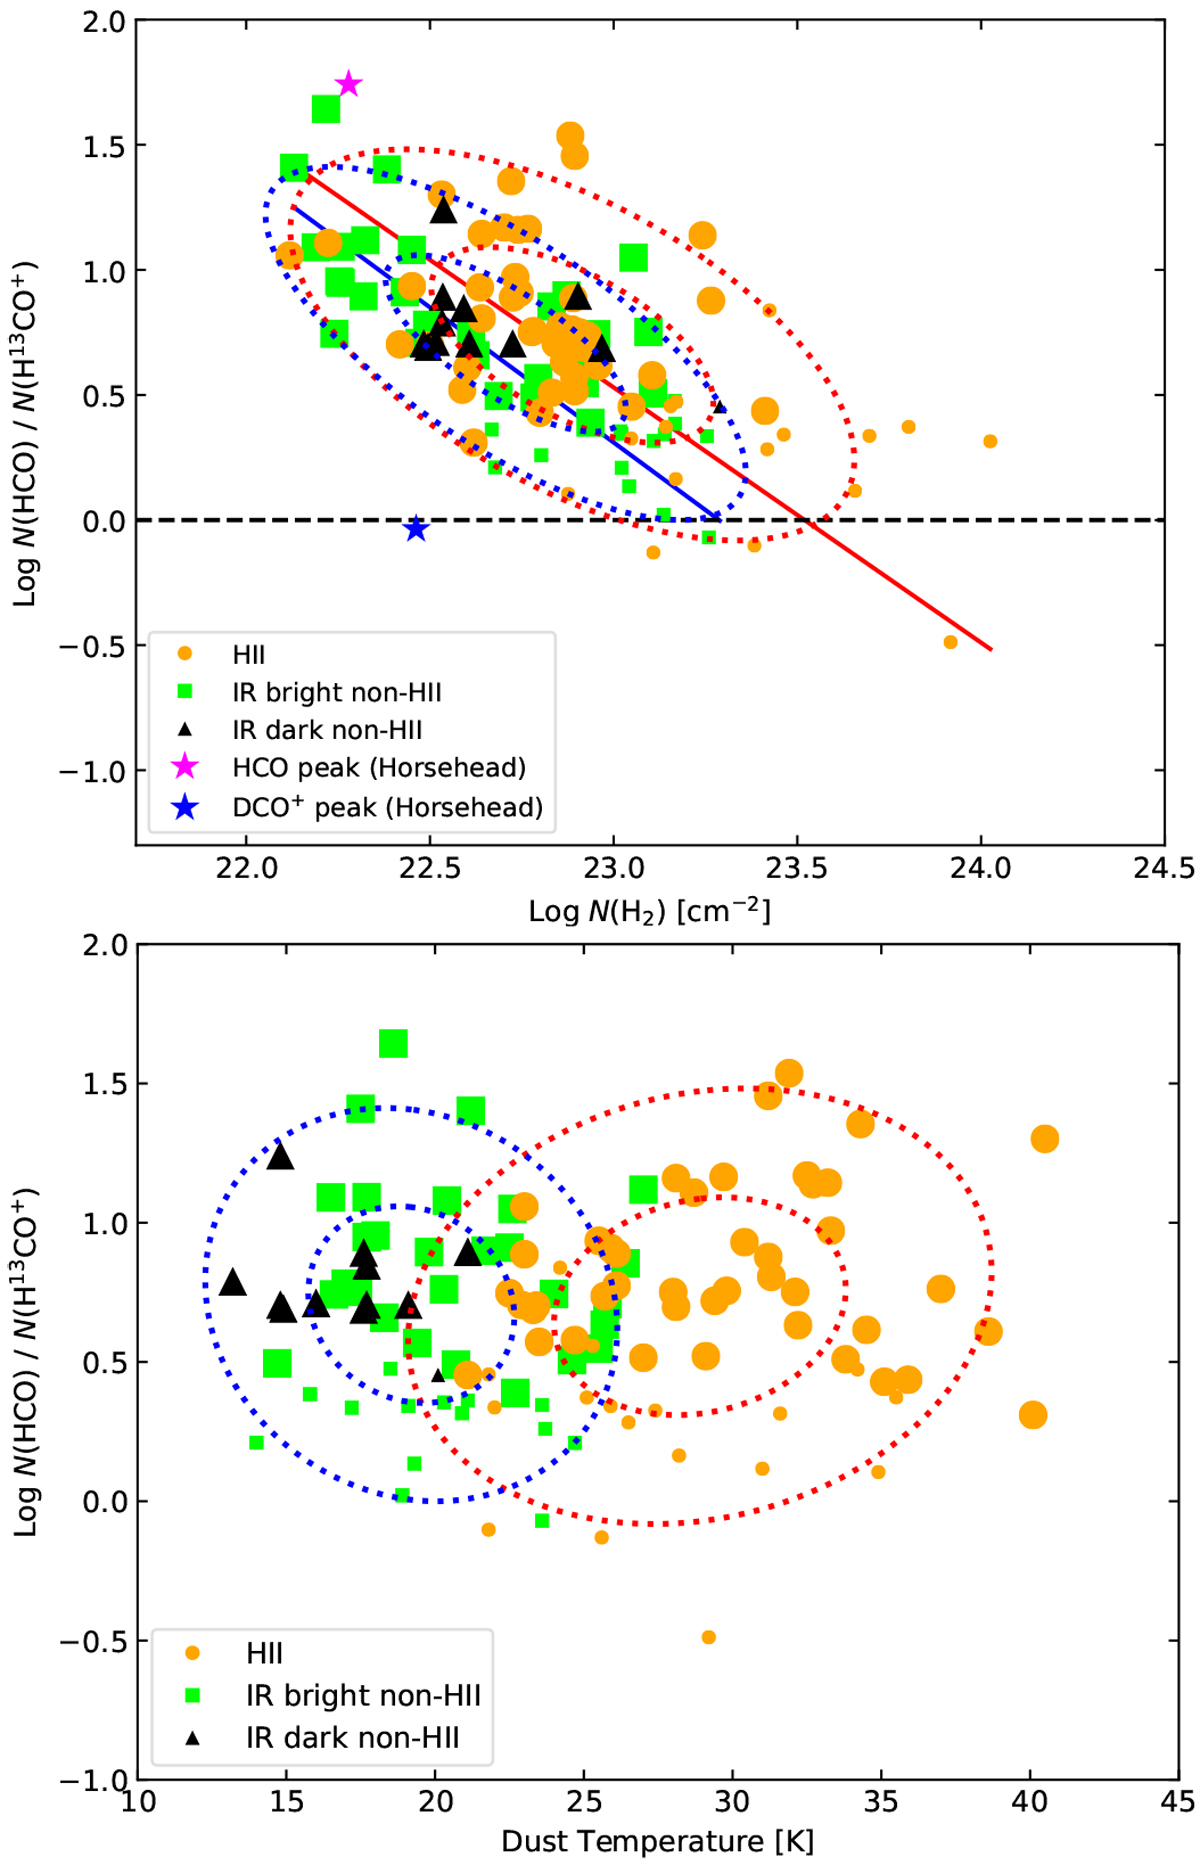
Column density ratio of HCO and H13CO+ molecules as a functionof N(H2) (upper panel) and Tdust (lower panel). The symbols are the same as explained in Fig. 10. The bigger dots indicate sources with their X(HCO) higher than 10−10 (Gerin et al. 2009). The purple and blue stars (upper panel only) represent N(HCO)/N(H13CO+) ratios from the PDR and cold gas region in the Horsehead nebula (Gerin et al. 2009). The red and blue dashed line ellipses are confidence ellipses showing distributions of these two populations (HII and non-HII regions) with 1 and 2σ levels. In the upper plot, the red and blue lines indicate the best-linear regression fits data points of HII and non-HII regions (IR bright and IR dark non-HIIs). Upper panel: the black horizontal dashed line presents that N(HCO)/N(H13CO+) ratios is 1.
Current usage metrics show cumulative count of Article Views (full-text article views including HTML views, PDF and ePub downloads, according to the available data) and Abstracts Views on Vision4Press platform.
Data correspond to usage on the plateform after 2015. The current usage metrics is available 48-96 hours after online publication and is updated daily on week days.
Initial download of the metrics may take a while.