Fig. 6
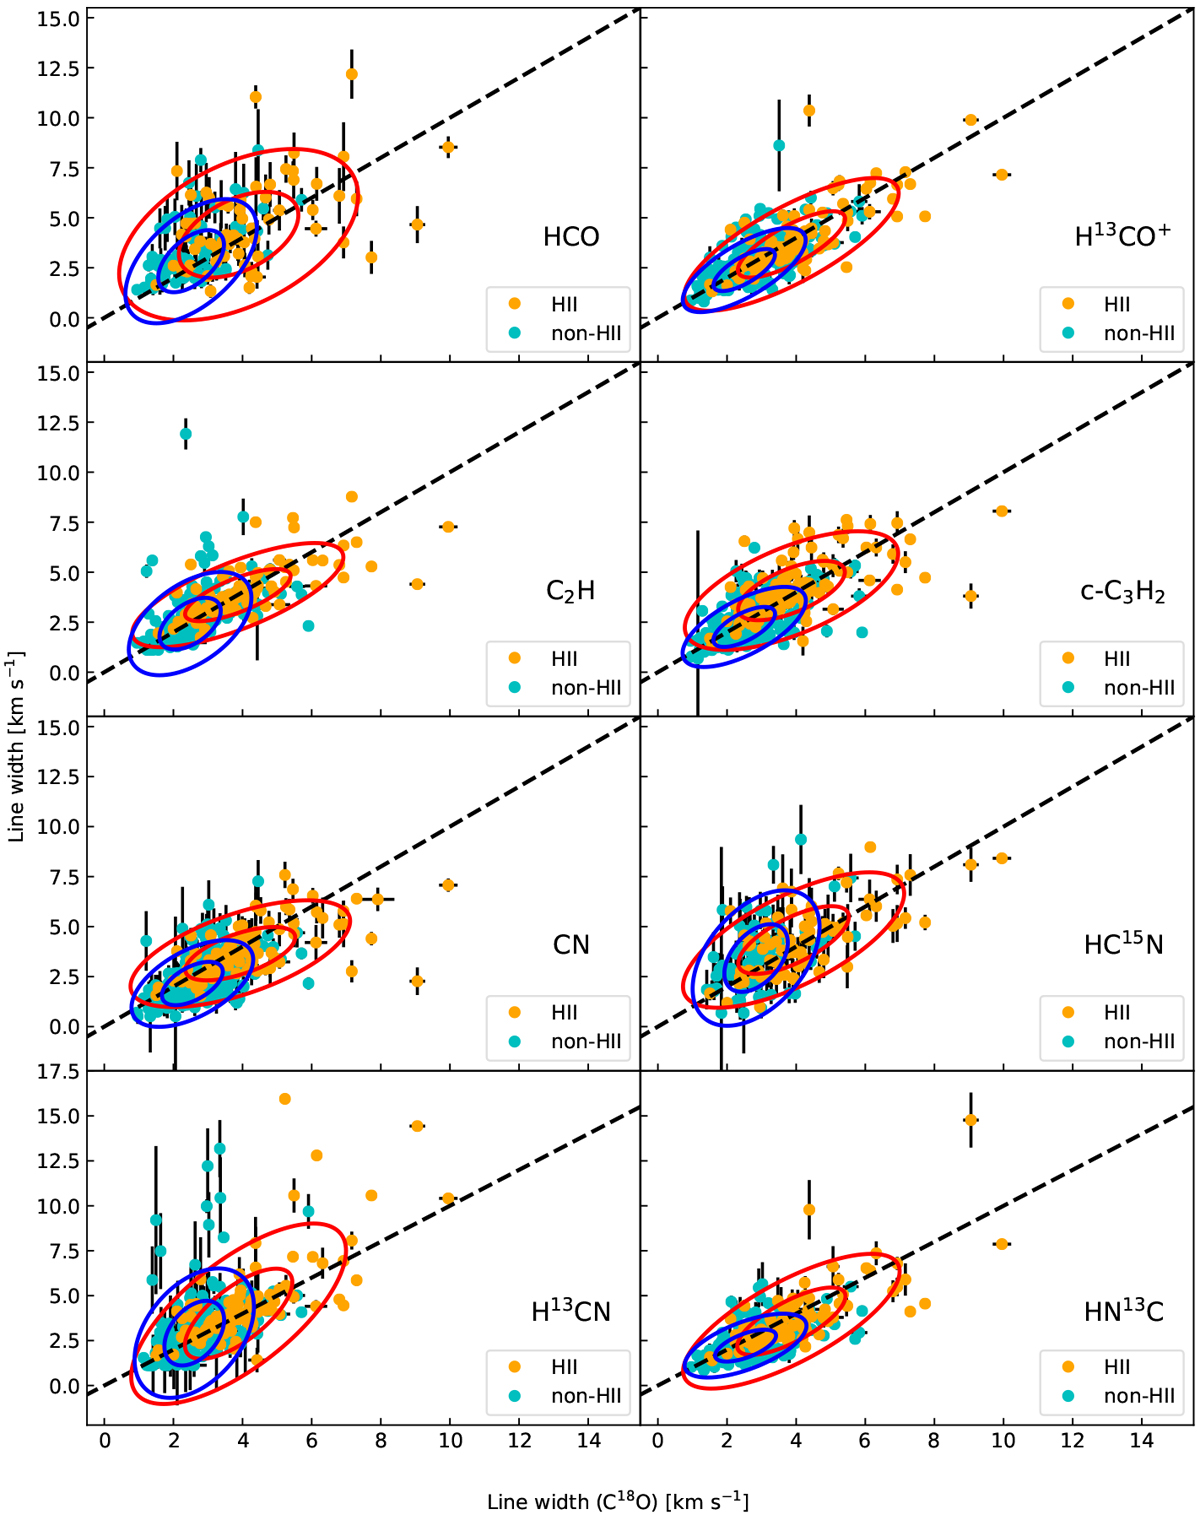
Orange circles indicate ATLASGAL clumps containing HII regions and the cyan circles represent clumps without the presenceof HII regions, which consist of IR bright non-HII and dark non-HII regions. The black dashed lines indicate equality. The error bars are obtained from Gaussian or HFS fits. The red and blue ellipses are covariance error ellipses with 1σ (inner ellipse) and 2σ (outer ellipse) for the two groups.
Current usage metrics show cumulative count of Article Views (full-text article views including HTML views, PDF and ePub downloads, according to the available data) and Abstracts Views on Vision4Press platform.
Data correspond to usage on the plateform after 2015. The current usage metrics is available 48-96 hours after online publication and is updated daily on week days.
Initial download of the metrics may take a while.