Fig. 5
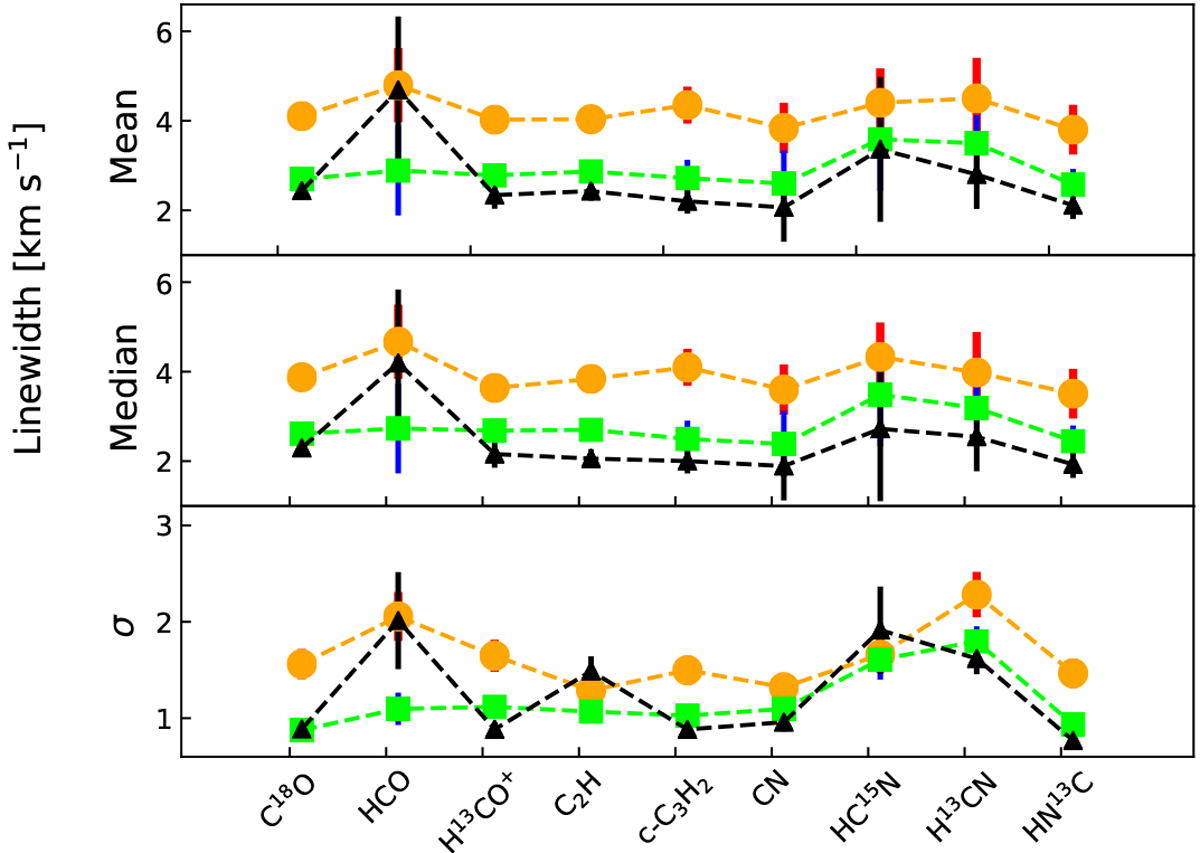
Mean, median, and a standard deviation (σ) of line widths of the selected molecular lines. The σ shows the source to source variation of the widths. The error bars for the mean and median values are based on typical Gaussian fit errors with 2σ. The error bars of the standard deviation of line widths is the standard deviation error. Different colors show three subgroups of our sample, which are HII in orange, IR bright in green, and IR dark non-HII regions in black.
Current usage metrics show cumulative count of Article Views (full-text article views including HTML views, PDF and ePub downloads, according to the available data) and Abstracts Views on Vision4Press platform.
Data correspond to usage on the plateform after 2015. The current usage metrics is available 48-96 hours after online publication and is updated daily on week days.
Initial download of the metrics may take a while.