Free Access
Fig. 7
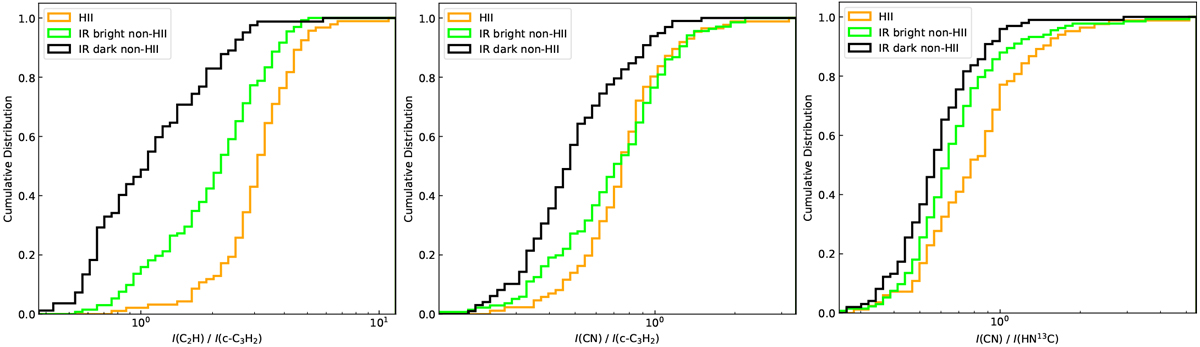
Cumulative distribution plots of integrated intensity ratios of C2H to c-C3 H2 (left panel), CN to c-C3H2 (middle panel), and to HN13C (right panel). The orange curves are HII regions. The green and black curves indicate IR bright non-HII and IR dark non-HII regions.
Current usage metrics show cumulative count of Article Views (full-text article views including HTML views, PDF and ePub downloads, according to the available data) and Abstracts Views on Vision4Press platform.
Data correspond to usage on the plateform after 2015. The current usage metrics is available 48-96 hours after online publication and is updated daily on week days.
Initial download of the metrics may take a while.