| Issue |
A&A
Volume 595, November 2016
|
|
|---|---|---|
| Article Number | A35 | |
| Number of page(s) | 24 | |
| Section | Stellar structure and evolution | |
| DOI | https://doi.org/10.1051/0004-6361/201628874 | |
| Published online | 26 October 2016 | |
Models of low-mass helium white dwarfs including gravitational settling, thermal and chemical diffusion, and rotational mixing⋆
1 Argelander-Institute für Astronomie, Universität Bonn, Auf dem Hügel 71, 53121 Bonn, Germany
e-mail: istrate@uwm.edu
2 Center for Gravitation, Cosmology and Astrophysics, Department of Physics, University of Wisconsin-Milwaukee, PO Box 413, Milwaukee, WI 53201, USA
3 Max-Planck-Institut für Radioastronomie, Auf dem Hügel 69, 53121 Bonn, Germany
Received: 8 May 2016
Accepted: 9 June 2016
A large number of extremely low-mass helium white dwarfs (ELM WDs) have been discovered in recent years. The majority of them are found in close binary systems suggesting they are formed either through a common-envelope phase or via stable mass transfer in a low-mass X-ray binary (LMXB) or a cataclysmic variable (CV) system. Here, we investigate the formation of these objects through the LMXB channel with emphasis on the proto-WD evolution in environments with different metallicities. We study for the first time the combined effects of rotational mixing and element diffusion (e.g. gravitational settling, thermal and chemical diffusion) on the evolution of proto-WDs and on the cooling properties of the resulting WDs. We present state-of-the-art binary stellar evolution models computed with MESA for metallicities of Z = 0.02, 0.01, 0.001 and 0.0002, producing WDs with masses between ~ 0.16−0.45 M⊙. Our results confirm that element diffusion plays a significant role in the evolution of proto-WDs that experience hydrogen shell flashes. The occurrence of these flashes produces a clear dichotomy in the cooling timescales of ELM WDs, which has important consequences e.g. for the age determination of binary millisecond pulsars. In addition, we confirm that the threshold mass at which this dichotomy occurs depends on metallicity. Rotational mixing is found to counteract the effect of gravitational settling in the surface layers of young, bloated ELM proto-WDs and therefore plays a key role in determining their surface chemical abundances, i.e. the observed presence of metals in their atmospheres. We predict that these proto-WDs have helium-rich envelopes through a significant part of their lifetime. This is of great importance as helium is a crucial ingredient in the driving of the κ-mechanism suggested for the newly observed ELM proto-WD pulsators. However, we find that the number of hydrogen shell flashes and, as a result, the hydrogen envelope mass at the beginning of the cooling track, are not influenced significantly by rotational mixing. In addition to being dependent on proto-WD mass and metallicity, the hydrogen envelope mass of the newly formed proto-WDs depends on whether or not the donor star experiences a temporary contraction when the H-burning shell crosses the hydrogen discontinuity left behind by the convective envelope. The hydrogen envelope at detachment, although small compared to the total mass of the WD, contains enough angular momentum such that the spin frequency of the resulting WD on the cooling track is well above the orbital frequency.
Key words: white dwarfs / binaries: general / stars: low-mass / pulsars: general / binaries: close
Evolutionary model sequences are only available at the CDS via anonymous ftp to cdsarc.u-strasbg.fr (130.79.128.5) or via http://cdsarc.u-strasbg.fr/viz-bin/qcat?J/A+A/595/A35
© ESO, 2016
1. Introduction
Extremely low-mass white dwarfs (ELM WDs) are low-mass helium-core WDs with masses below 0.2−0.3 M⊙ and with surface gravities of 5 < log g < 7 (Brown et al. 2013). A large number of such objects have been discovered in recent years through dedicated or general surveys such as ELM, SPY, WASP, SDSS and the Kepler mission (e.g. Brown et al. 2010, 2012, 2013, 2016; Kilic et al. 2011, 2012; Koester et al. 2009; Maxted et al. 2011; Kepler et al. 2016). Soon after the discovery of the first ELM WDs, it was recognised that they have to be a product of binary evolution (Marsh et al. 1995). From an evolutionary point of view, these ELM WDs cannot be formed from single-star progenitors as the nuclear evolution timescale of such low-mass objects would exceed the Hubble time – unless they have an extremely high metallicity (Kilic et al. 2007) or the star lost its envelope from an inspiralling giant planet (Nelemans & Tauris 1998). Indeed, the vast majority of ELM WDs are found in binary systems with a companion star such as a neutron star in millisecond pulsar (MSP) systems (van Kerkwijk et al. 2005), an A-type star in EL CVn-type systems (Maxted et al. 2014a) or another (typically a carbon-oxygen) WD. ELM WDs have been discovered in various environments, from the Galactic disk to open and globular clusters (Rivera-Sandoval et al. 2015; Cadelano et al. 2015), and thus they can be formed from progenitors with different metallicities.
The revived interest in ELM WDs was fostered by the discovery of pulsations in several of these objects (Hermes et al. 2012b, 2013a,b; Kilic et al. 2015) as well as ELM proto-WDs (Maxted et al. 2013, 2014b; Corti et al. 2016; Gianninas et al. 2016). The ELM WD pulsators extend the ZZ Ceti instability strip to lower effective temperatures and higher luminosities. This instability strip contains stars with a convective driving mechanism for pulsations acting at the base of the convective zone associated with hydrogen recombination (e.g. Van Grootel et al. 2013). In the newly discovered ELM proto-WD pulsators, the excitation mechanism is instead the usual κ-mechanism for which the presence of He in the envelope is thought to play a key role (Jeffery & Saio 2013; Córsico et al. 2016). The pulsational behaviour of ELM WDs and ELM proto-WDs provide an unique insight into their interior properties, such as the hydrogen envelope mass and their total mass and rotation rate, which will place stronger constraints on the theoretical models (e.g. Córsico & Althaus 2014a,b; Córsico et al. 2016).
Another interesting and not completely understood feature of ELM WDs is the observed presence of metals in their atmospheres. Gianninas et al. (2014a) provided for the first time systematic measurements of the atmospheric abundances of He, Ca and Mg for this type of stars and examined their distribution as a function of effective temperature and mass. In the observed sample, all the WDs with log g < 5.9 show Ca II K lines, suggesting that the presence of metals in these objects is a ubiquitous phenomenon, possibly linked to their evolution. Detailed abundance analyses exist for only a handful of objects (Kaplan et al. 2013; Gianninas et al. 2014b; Hermes et al. 2014b; Latour et al. 2016) but already suggest a diversity of metallicities, as in the case of sdB stars. Gravitational settling depletes the metals in the atmospheres of WDs on a very short timescale compared to their evolutionary timescale (Vauclair et al. 1979; Paquette et al. 1986; Koester et al. 2009), indicating that a process should be at work that counteracts it or replenishes the depleted metals.
In addition to the formation and evolutionary history of these objects, their future outcome is also of theoretical interest. Short-period double WD binaries are candidate progenitors for transient explosive phenomena such as Type Ia, underluminous .Ia and Ca-rich supernovae (Bildsten et al. 2007; Iben & Tutukov 1984; Perets et al. 2010; Foley 2015), as well as exotic systems such as AM CVn stars, R Coronae Borealis (R CrB), and single subdwarf B/O stars (Kilic et al. 2014; Solheim 2010; Clayton 2013; Heber 2016). Moreover, they are expected to be excellent sources of gravitational waves (Hermes et al. 2012a; Kilic et al. 2013) and verification sources for gravitational detectors such as eLISA (Amaro-Seoane et al. 2012).
2. Formation and evolution of ELM WDs
From a theoretical point of view, an ELM WD can be formed either through common-envelope evolution or stable Roche-lobe overflow (RLO) mass transfer in a low-mass X-ray binary (LMXB) or a cataclysmic variable (CV) system. The formation and evolution of low-mass WDs through a stable mass-transfer phase (or by artificially removing envelope mass from its progenitor star) has been studied intensively over the years (e.g. Driebe et al. 1998; Sarna et al. 2000; Nelson et al. 2004; Althaus et al. 2001a, 2013; Panei et al. 2007; Istrate et al. 2014a,b). In comparison, the common-envelope channel is less studied and far more uncertain (e.g. Nandez et al. 2015).
Although the majority of ELM WDs are found in double WD systems (Andrews et al. 2014), almost all evolutionary calculations that involve stable mass transfer producing an ELM WD consider a neutron star companion (i.e. an LMXB progenitor system). For the structure of the final ELM WDs, the results of these LMXB calculations can also be applied to CV systems producing ELM WDs in double WD binaries, as the stellar properties of the produced ELM WDs do not depend on the mass of their accreting companion, but instead on the initial orbital period and mass of the donor (progenitor) star (Nelson et al. 2004; De Vito & Benvenuto 2010; Istrate et al. 2014a). Only the orbital periods of the produced ELM WDs will be different.
2.1. Hydrogen shell flashes and proto-WDs
After the RLO mass-transfer phase ends, the remaining donor star goes through a so-called (bloated) proto-WD phase in which a significant part of the hydrogen left in the envelope is burned through stable hydrogen shell burning. In addition to this, depending on the mass of the proto-WD, its metallicity and the physics included in the modelling, hydrogen may be burned through short-lived phases of unstable burning through CNO hydrogen shell flashes (e.g. Driebe et al. 1998; Althaus et al. 2001c; Nelson et al. 2004).
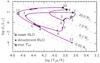 |
Fig. 1 Hertzsprung-Russel (HR) diagram showing the formation and cooling of a 0.28 M⊙ helium WD (produced in an LMXB) that undergoes a hydrogen shell flash. The initial progenitor mass is 1.4 M⊙ (Z = 0.02), the neutron star mass is 1.2 M⊙, and the initial orbital period is 5.0 days. See Table 1 for ages at each stage. |
Figure 1 shows an example of the formation of an ELM WD through the LMXB channel, including the evolution as a proto-WD as well as its further cooling. The stellar track is computed from the zero-age main sequence (ZAMS) until the donor star reaches an age of 14 Gyr, points 0 and 12, respectively, in Fig. 1. In this case, the star experiences one hydrogen shell flash. After the Roche-lobe detachment (point 2), the proto-WD goes through a phase of contraction at almost constant luminosity and increasing effective temperature (between points 2 and 3). The total luminosity is dominated by CNO burning while the contribution due to release of gravitational binding energy from contraction is negligible. When the proto-WD reaches point 3, which is at the beginning of the cooling branch, the temperature in the burning shell is too low to sustain CNO burning, therefore the main contribution to the total luminosity is for a while given by contraction, until the star switches to pp-burning. The unstable burning starts around point 4 and CNO burning becomes dominant again. The increasing energy release during the flash development creates a steep temperature gradient close to the location of maximum energy production. This will give rise to a pulse-driven convection zone within the hydrogen burning shell. After the convection zone is fully developed, the evolution becomes faster (between points 5 and 6). Around point 7, the convection zone reaches the stellar surface, and consequently, its surface chemical composition is altered. The maximum hydrogen luminosity reached during the flash is supplied by the pp-burning, although the onset of the instability is triggered by the CNO cycling. Between points 7 and 8, the lower boundary of the pulse-driven convection zone moves upwards, and at point 8 it completely vanishes. Beyond point 8, the contraction of the inner shells resumes, while the surface layers react by expansion, resulting in a redward motion in the Hertzsprung-Russel (HR)-diagram that almost brings the proto-WD back to the red-giant branch. At point 9, the star fills its Roche lobe again and a short episode of mass transfer is initiated (between points 9 and 10) with a high mass-transfer rate that approaches ~ 10-7 M⊙ yr-1. After point 10, the star again evolves towards a high surface temperature at almost constant luminosity, and before reaching the final cooling track, it develops a so-called subflash (near log Teff = 4.4). The time intervals for each of the above described phases are shown in Table 1.
The proto-WD phase has an associated timescale, Δtproto, which is the time it takes the star to evolve (and contract) from the Roche-lobe detachment until it reaches its maximum effective temperature on the (final) cooling track. In Fig. 1 this corresponds to the time interval during the evolution from point 2 to point 11. The duration of this contraction phase is mainly given by the burning rate of the residual hydrogen in the envelope. For evolved low-mass stars there is a well-known correlation between the degenerate core mass and its luminosity (Refsdal & Weigert 1971). Therefore, after Roche-lobe detachment, the rate at which the residual hydrogen in the envelope is consumed is directly proportional to the luminosity and thus increases strongly with MWD. A detailed analysis of the dependence of Δtproto on the mass of the WD is given in Istrate et al. (2014b). This timescale is especially important in MSP systems and should be added to the optically determined cooling age of the WD to yield the true age of the recycled radio pulsar. Unfortunately, the true age of a recycled pulsar cannot be determined from its characteristic spin-down age as this method has proved unreliable by a factor of 10 or more (Camilo et al. 1994; Lorimer et al. 1995; Tauris 2012; Tauris et al. 2012).
Hydrogen shell flashes occur in a range of proto-WD masses that is dependent on the metallicity and whether or not element diffusion is included in the modelling. The lower mass limit for flashes, Mflash,min, is determined by the size of the burning shell, such that if Mproto−WD < Mflash,min, then the shell is too thick to trigger unstable hydrogen burning. The upper mass limit, Mflash,max, is determined by the cooling time of the burning shell, which needs to be long enough to avoid an extinction of the shell before the instability is fully established (if Mproto−WD > Mflash,max, this condition is not fulfilled, cf. Driebe et al. 1998). These conditions are altered when element diffusion is included (Althaus et al. 2001c), and this issue is investigated more carefully in Sect. 4.
2.2. Age dichotomy in helium WD cooling?
The occurrence of hydrogen shell flashes, when element diffusion is taken into account, has been found to be responsible for a dichotomy in the cooling ages of helium WDs (Althaus et al. 2001a, 2013; van Kerkwijk et al. 2005; Bassa et al. 2016). The occurrence of flashes in relatively massive helium WDs (> 0.2 M⊙), with initially thin hydrogen envelopes, leaves behind an even thinner envelope, giving rise to relatively fast cooling. On the other hand, less massive (proto) helium WDs (< 0.2 M⊙) have thicker hydrogen envelopes after RLO, resulting in stable shell hydrogen burning, and will therefore continue residual hydrogen burning on the cooling track on a long timescale.
Recently, Istrate et al. (2014b) found no evidence for such a dichotomy in the case of thermal evolution of proto-WDs but rather a smooth transition with the mass of the WD. The authors showed that the thermal evolution timescale mainly depends on the proto-helium WD luminosity, which in turn depends on the mass of the proto-WD and not on the occurrence of hydrogen shell flashes. These new findings questioned whether a dichotomy exists in the cooling ages of ELM WDs and if the responsible process might be the occurrence of hydrogen shell flashes.
2.3. Aims of this investigation of ELM WDs
The focus of this paper is on the proto-WD phase of ELM WDs, which are investigated through a series of binary stellar evolution calculations of LMXBs. The following aspects are addressed: (i) the hydrogen envelope mass as a result of binary evolution; (ii) the role played by rotational mixing in the evolution of ELM proto-WDs; (iii) the influence of element diffusion and rotation on Δtproto as well as on the cooling timescale; (iv) the existence of a dichotomy in the cooling ages of ELM WDs as a result of the occurrence of hydrogen shell flashes; (v) the presence of metals in the atmospheres of proto-WDs; and (vi) the relation between the mass of a proto-WD and its orbital period at the end of the mass-transfer phase. All these aspects are addressed not only as a function of the proto-WD mass, but also as a function of metallicity. Answering these open questions is essential for understanding the formation of ELM WDs and their age determination, for providing accurate models for astroseismology calculations, and for determining the correct age of MSP binaries. This work extends the previous work by Istrate et al. (2014b) by including element diffusion and rotational mixing in the evolution of the donor star and during the proto-WD and the WD cooling phase. Moreover, the study is extended to include the effect of metallicity as well, for which we investigate four metallicities: Z = 0.02, 0.01, 0.001, and 0.0002.
3. Numerical methods
The evolutionary tracks presented in this paper are calculated using the publicly available binary stellar evolution code MESA, version 7624 (Paxton et al. 2011, 2013, 2015). The nuclear network used is cno_extras.net and accounts for the CNO burning with the following isotopes: 1H, 3He, 4He, 12C, 13C, 13N, 14N, 15N, 14O, 15O, 16O, 17O, 18O, 17F, 18F, 19F,18Ne, 19Ne, 20Ne, 22Mg and 24Mg. Radiative opacities are taken from Ferguson et al. (2005) for 2.7 ≤ log T ≤ 4.5 and OPAL (Iglesias & Rogers 1993, 1996) for 3.75 ≤ log T ≤ 8.7 and conductive opacities are adopted from Cassisi et al. (2007). Convective regions are treated using the mixing-length theory (MLT) in the Henyey et al. (1965) formulation with αMLT = 2.0. Transport of angular momentum is treated as a diffusive process which results in rigid rotation in convective zones. The boundaries of convective regions are determined using the Schwarzschild criterion. A step function overshooting extends the mixing region for 0.2 pressure scale heights beyond the convective boundary during core H-burning.
We here refer to element diffusion as the physical mechanism for mixing of chemical elements that is due to pressure gradients (or gravity, i.e. gravitational settling), temperature (thermal diffusion) and composition gradients (chemical diffusion). Gravitational settling tends to concentrate heavier elements towards the centre of the star. Thermal diffusion generally acts in the same direction, although to a lesser degree, by bringing highly charged and more massive species towards the hottest region of the star (its centre). Chemical diffusion, on the other hand, has the opposite effect (e.g. Iben & MacDonald 1985; Thoul et al. 1994). MESA includes the treatment of element diffusion through gravitational settling, chemical and thermal diffusion (Thoul et al. 1994), and radiative accelerations (Hu et al. 2011). Radiative forces are proportional to the reciprocal of the temperature and are thus negligible in hot regions where nuclear burning is of importance. In addition, calculating these forces is computationally demanding. We therefore here neglected the effects of radiative levitation (which is important for determining photospheric composition of hot WDs (Fontaine & Michaud 1979). The detailed description of how element diffusion is implemented in MESA can be found in Paxton et al. (2015). We take into account the effects of element diffusion due to gravitational settling and chemical and thermal diffusion for the following elements 1H, 3He, 4He, 12C, 13C, 14N, 16O, 20N, 24Mg, and 40Ca.
MESA includes the effects of the centrifugal force on stellar structure, chemical mixing, and transport of angular momentum that is due to rotationally induced hydrodynamic and secular instabilities as described in Heger et al. (2000). Here, we take into account the mixing due to dynamical shear instability, secular shear instability, Eddington-sweet circulation, and Goldreich-Schubert-Fricke instability with a mixing efficiency factor of fc = 1/30 (Heger et al. 2000). The mixing of angular momentum that is due to dynamo-generated magnetic fields in radiative zones is also included (Spruit 2002; Heger et al. 2005) as is the angular momentum transport due to electron viscosity (Itoh et al. 1987). A decrease of the mean molecular weight with radius has a damping effect on mixing processes driven by rotation or even prevents these from occurring. The strength of this effect is regulated by the parameter fμ, for which we follow Heger et al. (2000) and set fμ = 0.05.
The initial metallicity was set to Z = 0.02 (Y = 0.28), with initial abundances from Grevesse & Sauval (1998). The lower metallicities were obtained by scaling both X and Y by the same factor such that X + Y + Z = 1. For the WD evolution and for Teff< 10 000 K, the outer boundary conditions were derived using non-grey model atmospheres (Rohrmann et al. 2012).
To calculate the rate of change of orbital angular momentum, we took into account contributions from gravitational wave radiation, mass loss, magnetic braking, and spin orbit couplings: 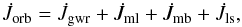 (1)as described in Paxton et al. (2015). The contribution of spin-orbit couplings to
  was computed by demanding conservation of total angular momentum (except for losses due to gravitational wave radiation, magnetic braking, and mass loss), that is, changes in spin angular momentum were compensated for by changing the orbital angular momentum. The initial rotation velocity of the donor star was set by requiring that its spin period be synchronized with the initial orbital period. The time evolution of the angular velocity of the donor star is given by
 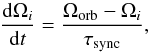 (2)where Ωi is the angular velocity of cell i (Detmers et al. 2008). The synchronization time, τsync was calculated using the formalism of tidal effects from Hurley et al. (2002) and depends on whether the envelope is convective or radiative.
3.1. Grid of models
To produce our grid of models, we followed the detailed binary evolution of the donor star from the ZAMS until it reached an age of 14 Gyr. The neutron star was treated as a point mass. The final outcome of these LMXB systems is very sensitive to the initial orbital period and to the treatment of orbital angular momentum loss (e.g. Istrate et al. 2014a, and references therein).
We calculated binary tracks for four metallicities: Z = 0.02, 0.01, 0.001, and 0.0002. For each metallicity, the models were divided into three categories: (i) basic models (with no diffusion nor rotation); (ii) diffusion models (with element diffusion) and; (iii) diffusion+rotation models (with element diffusion plus rotation). In both the diffusion and diffusion+rotation models, we included the effects of centrifugal forces and angular momentum transport, which means that these two models only differ by the presence of rotational mixing in the rotation models.
For Z = 0.02, the initial binary configuration has a 1.4 M⊙ donor star and a 1.2 M⊙ neutron star accretor. For all the other metallicities, our models were calculated with a 1.0 M⊙ donor star and a 1.4 M⊙ neutron star (to facilitate direct comparison with previous work in the literature, see Sect. 5.2). All the models were computed using a magnetic braking index of γ = 4, and we assumed that 30 per cent of the transferred mass is ejected from the neutron star as a fast wind carrying its specific orbital angular momentum. We note that the structure of the ELM WDs is not sensitive to the above choices of mass-transfer parameters which only affect their final orbital periods. A comprehensive study of the influence of the magnetic braking index and the accretion efficiency on LMXB evolution can be found in Istrate et al. (2014a). We point out again that we here refer to the mass of the proto-WD as being the (bloated) donor star mass at the end of the RLO mass-transfer phase (before the occurrence of flashes, which can lead to additional mass-transfer episodes), and the mass of the WD as being the mass at the beginning of the cooling track. We calculated models just above the bifurcation period, which is defined as the shortest initial orbital period that produces a WD (e.g. Istrate et al. 2014a, and references therein).
4. Results
4.1. General effects of element diffusion and rotational mixing
In the context of low-mass helium WDs, element diffusion was investigated in detail over the past few years by the La Plata group (e.g. Althaus & Benvenuto 2000; Serenelli et al. 2001; Althaus et al. 2001a,c,b, 2009, 2013; Panei et al. 2007) using the stellar evolution code LPCODE for various ranges of helium WD masses and metallicity. To the best of our knowledge, there is only one other study that used MESA for low-mass helium WDs (Gautschy 2013). Our models include element diffusion from the ZAMS and not only from the proto-WD phase, as in the previous works. Moreover, for the first time, we investigate in detail the role played by rotational mixing in addition to element diffusion in the evolution of ELM WDs.
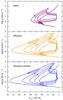 |
Fig. 2 Post-RLO evolution of surface gravity versus effective temperature for a ~ 0.23 M⊙ proto-WD produced from an LMXB donor star with Z = 0.01. Three different models are shown: basic configuration (top panel), diffusion configuration (middle panel) and diffusion+rotation configuration (bottom panel). Note that the computations are stopped when the age of the model star reaches 14 Gyr (since ZAMS). |
Element diffusion has a strong effect on the surface composition of a proto-WD and on the chemical profile deep inside the star close to the helium core. At the surface, gravitational settling increases the hydrogen abundance given that hydrogen is the lightest element. Close to the helium core boundary, chemical diffusion tends to smooth it out by mixing the hydrogen downwards into hotter layers because a large hydrogen abundance gradient exists. It has been shown that this hydrogen tail promotes the occurrence of hydrogen shell flashes (e.g. Althaus et al. 2001a). Moreover, when element diffusion is included, a proto-WD experiences more flashes than when diffusion is neglected (e.g. Althaus et al. 2001a). The WD mass interval in which they occur is also changed compared to the case when element diffusion is ignored. The number of flashes and other information for all the models studied in this work are given in Appendix A.
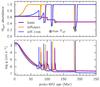 |
Fig. 3 Evolution of hydrogen surface abundance (top panel) and logg (bottom panel) for the three proto-WDs shown in Fig. 2 illustrating the effect of gravitational settling, rotational mixing and the mixing due to convection zones developed during the hydrogen shell flashes on the surface composition of these objects. |
Figure 2 shows the evolution of surface gravity versus effective temperature for a proto-WD of ~ 0.23 M⊙ obtained from the following three model configurations: basic, diffusion, and diffusion+rotation. The basic model experiences three hydrogen shell flashes, while the diffusion and the diffusion+rotation models experience one additional flash. The radial expansion following the CNO burning is more pronounced when element diffusion is included, in some cases leading to additional episodes of RLO. In general, the models with diffusion and diffusion+rotation behave in a very similar way.
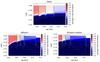 |
Fig. 4 Kippenhahn diagrams showing the proto-WD phase for the same systems as in Fig. 2. The plots show cross sections of the outer ~ 0.01 M⊙ envelope of the proto-WD in mass coordinates, along the y-axis, as a function of stellar age on the x-axis (relative to the ZAMS age). The green areas denote zones with convection; the dotted white lines define lines of constant hydrogen abundance, 10-2 to 10-5 (from top to bottom). The intensity of the blue and red colour indicates the hydrogen abundance by mass fraction, as shown on the colour scale to the right. As a result of different input physics, the proto-WDs have slightly different masses and ages. See text for details. |
Figure 3 shows the evolution of hydrogen surface abundance (top panel) and log g (bottom panel) for the same (proto)WDs as in Fig. 2. As already mentioned, gravitational settling changes the surface abundances. All the elements heavier than hydrogen sink below the surface, leaving a pure hydrogen envelope behind. When rotational mixing is included, gravitational settling and rotational mixing compete with each other to determine the chemical composition of the surface. At the beginning of the proto-WD phase, rotational mixing dominates. However, the surface gravity of the proto-WD increases with time, while the efficiency of rotational mixing decreases, as described in Sect. 4.1.1. Thus, in later phases of the evolution, the gravitational settling overcomes the mixing induced by rotation. By the beginning of the last flash, the surface structure of the model that only includes element diffusion is nearly identical to the structure of the model that includes both element diffusion and rotational mixing. Helium in the envelopes of ELM proto-WDs is a crucial ingredient for exciting pulsation modes through the κ-mechanism, as shown by Jeffery & Saio (2013) and Córsico et al. (2016) for radial and nonradial modes. Gianninas et al. (2016) recently provided the first empirical evidence that pulsations in ELM proto-WDs can only occur when a significant amount of helium is present in their atmospheres. In contrast with evolutionary models that only include element diffusion, our new evolutionary models including rotational mixing produce proto-WDs that have mixed He/H envelopes during most of their evolution before settling on the cooling track.
Another effect of element diffusion, resulting mainly from the competition between chemical and thermal diffusion, is the development of a hydrogen tail that reaches down into the hot helium-rich layers, as shown in Fig. 4. This effect is responsible for the larger number of flashes compared to the case where element diffusion is ignored (basic model). Rotational mixing is seen not to change the chemical structure of the deep layers. This can also be concluded from the very similar behaviour in terms of the number of flashes and the structure of the flashes in the case that includes both diffusion and rotation compared to the case that only includes element diffusion, cf. Figs. 2 and 5.
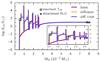 |
Fig. 5 Hydrogen burning luminosity versus hydrogen envelope mass, for the same systems as in Fig. 2. The grey stars represent the moment of Roche-lobe detachment while the grey squares denote the point of maximum effective surface temperature. The evolution is from the right to the left. |
In Fig. 5 we plot the luminosity produced by hydrogen burning versus the hydrogen envelope mass. For all three models, around 70 per cent of the hydrogen remaining from the end of the LMXB phase (Roche-lobe detachment) is processed before the occurrence of flashes while the bloated proto-WD crosses the HR-diagram. The occurrence of additional flashes, which applies to the cases where element diffusion is included, reduces the hydrogen envelope mass available on the cooling track (i.e. after reaching maximum Teff, marked by squares in Fig. 5) by a factor of ~ 3 compared with the basic model. The basic model still experiences significant residual hydrogen burning on the cooling track. As a result, the basic model only cools down to a temperature of Teff ≈ 8400 K within 14 Gyr (since the ZAMS), while the two models that include diffusion will cool down to roughly Teff ≈ 4000 K (cf. Fig. 2). The cooling properties of the ELM WDs are discussed in more detail in Sect. 4.5.
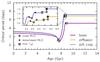 |
Fig. 6 Orbital period evolution for the same models as in Fig. 2. The grey circles represent the onset of the mass transfer, the grey stars represent Roche-lobe detachment and the grey squares mark the maximum Teff. |
The orbital evolution of the models described above is shown in Fig. 6. One difference between the three models is that those with element diffusion (and rotation) require a longer initial orbital period to form approximately the same proto-WD. The orbital period at the Roche-lobe detachment is ~ 7.05 days for the model that includes diffusion and rotation, ~ 6.73 days for the model with diffusion only, and ~ 5.19 days for the basic model. As the diffusion-induced flashes are stronger and because almost every flash causes the star to expand and fill its Roche lobe again, the mass-transfer episodes widen the orbit during each flash. In the end, this effect accounts for an increase of a few per cent in the orbital period.
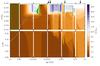 |
Fig. 7 Kippenhahn diagram for the same proto-WD as in Fig. 4, including both element diffusion and rotational mixing. The intensity of the orange and indigo colour indicates the ratio of the spin angular velocity to the orbital angular velocity, Ω/Ωorb, as shown on the colour scale to the right. The green areas and the dotted white lines have the same meaning as in Fig. 4. The black arrows point to the position of the profiles in Fig. 8. |
4.1.1. Rotational mixing
As shown in Fig. 7, the tidal coupling is strong enough to completely synchronize the donor with the orbit up until the end of the LMXB phase. This changes dramatically after detachment from the Roche lobe; while the helium core barely contracts and spins up only slightly above the orbital frequency, the extended hydrogen envelope spins up significantly during contraction, resulting in strong shear at the core-envelope boundary. As hydrogen flashes develop and the star expands and then contracts, the envelope successively spins down and up, with the rotational period at the surface of the proto-WD at its maximum being up to 20 times shorter than the orbital period. Even though the proto-WD expands back and fills its Roche lobe during flashes, these phases are very short. The convective layers developed during the flashes disappear well before the next phase of Roche–lobe overflow such that tidal synchronization past the LMXB phase is negligible.
Although a strong shear is developed, the composition gradients that help stabilize the instabilities driven by rotation prevent the mixing of elements and angular momentum from the envelope to the core. This is shown in Fig. 8, where the different processes contributing to the angular momentum diffusion coefficient, ν are shown at four different times. As depicted in the first panel, there is a very steep H-gradient immediately after a flash (and also after detachment from the LMXB phase) that completely prevents mixing to the core. As burning proceeds between flashes (second and third panels in Fig. 8), the H-gradient is softened and starts to move outwards in mass, which allows some angular momentum to be transported to the core mainly through magnetic torques from the Spruit-Tayler dynamo. Finally, after settling on the cooling track (final panels panel in Figs. 7 and 8), most of the remaining hydrogen has been burnt, and angular momentum has mixed efficiently between the envelope and the core. Despite the small mass of the envelope relative to the total WD mass, this results in the WD having a spin period more than four times shorter (i.e. faster) than its orbital period.
Because we have assumed that magnetic torques do not contribute to the mixing of elements, rotational mixing in our models barely affects the formation of the hydrogen tail due to element diffusion, and thus has a weak effect on the strength and the occurrence of flashes. At the surface, however, the fast rotation induces element mixing through Eddington-Sweet circulation (see Fig. 8), which counteracts the rapid settling of elements heavier than hydrogen.
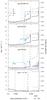 |
Fig. 8 Angular momentum diffusion coefficient, ν as function of mass coordinate from the centre (left) to the surface of the star (right) for the same proto-WD as in Fig. 7. Processes included are Spruit-Tayler dynamo (st), Eddington-Sweet circulation (es), and electron viscosity (visc). Each panel (from top to bottom) corresponds to a profile as marked by the black arrows in Fig. 7 (from left to right). The grey dotted lines define lines of constant hydrogen abundance, from 10-5 to 10-2, while the black dashed line represents the hydrogen mass abundance. |
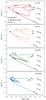 |
Fig. 9 HR-diagram showing the formation and evolution of a ~ 0.28 M⊙ WD from progenitors with different metallicities. The grey symbols represent the beginning of RLO (circles), the end of RLO (stars) and the maximum Teff (squares). The grey dashed lines represent lines of constant radius. |
4.2. Effect of metallicity
For a given stellar mass, decreasing the metallicity produces a decrease in the radiative opacity which has an impact on the stellar evolution. The ZAMS and the RGB-phase are shifted towards the blue region of the HR-diagram, with the luminosity and effective temperature being higher during these phases than for models at solar metallicity. In other words, at low metallicity stars tend to be hotter, have smaller radii, and evolve more quickly than their high-metallicity counterparts. An immediate consequence of lower metallicities is therefore a higher mass of the helium WD formed through the LMXB phase at a given initial orbital period because the Roche lobe is filled at a more advanced stage in the evolution as a result of the smaller radius.
As previously demonstrated by Serenelli et al. (2002) and Nelson et al. (2004), the threshold mass for the occurrence of hydrogen shell flashes increases with lower metallicity. This is confirmed by our calculations, as shown in Table 2. For example, for the basic models (without diffusion and rotation), the minimum mass above which the flashes occur is ~ 0.21 M⊙ for Z = 0.02, ~ 0.22 M⊙ for Z = 0.01, ~ 0.25 M⊙ for Z = 0.001, and ~ 0.28 M⊙ for Z = 0.0002.
Models with element diffusion have lower threshold values for flashes to occur, with the following dependence on metallicity: all the models studied for Z = 0.02 experience flashes, the lowest mass proto-WD produced being 0.167 M⊙. For Z = 0.01 flashes occur above 0.169 M⊙, for Z = 0.001 the limit is ~ 0.22 M⊙, while for Z = 0.0002 the lower threshold value is ~ 0.26 M⊙. When rotational mixing is included, all the threshold values are slightly higher than only diffusion is included, cf. Table 2. The upper limit for the occurrence of flashes is not as well constrained because fewer models are calculated models in this mass range, given that the focus of this work is towards the lowest masses of helium WDs, which are the ELM WDs. The obtained limits for hydrogen shell flashes agree well with those found in the literature for low metallicity (Serenelli et al. 2001), but at solar metallicity we obtain somewhat lower values than Althaus et al. (2013).
Proto-WD mass ranges for hydrogen shell flashes.
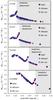 |
Fig. 10 Hydrogen envelope mass at the end of the mass-transfer phase (Roche-lobe detachment) for the basic stars (purple circles), for the stars with diffusion only (orange stars) and for the stars with diffusion+rotation (blue squares) for Z = 0.02 (top panel), Z = 0.01 (second panel), Z = 0.001 (third panel) and Z = 0.0002 (bottom panel) as a function of proto-WD mass. The grey shaded area denotes the stars that undergo a temporary Roche-lobe detachment (see text for details). |
The change in metallicity not only affects the threshold for flashes, but also the extent of the loops in the HR diagram. In Fig. 9 the formation and evolution of a proto-WD with a mass of ~ 0.28 M⊙ is shown in the HR-diagram for all the investigated metallicities. The lower the metal content, the weaker the CNO burning, and thus the loops during the CNO flashes are markedly less extended than in models with higher metallicity. Moreover, the number of flashes increases with decreasing metallicity: while the models for Z = 0.02 and Z = 0.01 experience just one hydrogen shell flash, the model at Z = 0.001 goes through two flashes, and at Z = 0.0002 the star experiences three hydrogen shell flashes. The interval of masses for which flashes occur is also affected by metallicity. For Z = 0.02 and Z = 0.01, a 0.28 M⊙ helium WD is close to the upper mass limit where hydrogen shell flashes occur, while for Z = 0.001 and Z = 0.0002, a 0.28 M⊙ helium WD is located close to the lower mass limit of the hydrogen shell flash interval. We stress that the number of flashes decreases with increasing mass of the WD and varies between 0 and 7 flashes for our computed models (see Appendix A).
4.3. Inheritance of proto-WDs: the hydrogen envelope mass
Figure 10 shows the hydrogen envelope mass at the end of the mass-transfer phase (Roche-lobe detachment), MH,det, as a function of the proto-WD mass for all the computed models. For a given metallicity, the models with diffusion and with diffusion+rotation have very similar values of MH,det as the basic models. The general trend is that the lower the mass of the proto-WD, the higher MH,det. The features in MH,det are given by the evolutionary history of the progenitor (donor) star and depend on the point in its evolution at which mass transfer is initiated. We note a jump in the hydrogen envelope mass at ~ 0.21 M⊙, ~ 0.23 M⊙, ~ 0.29 M⊙, and ~ 0.34 M⊙ for Z = 0.02, Z = 0.01, Z = 0.001, and Z = 0.0002, respectively. This can be understood as discussed below. The shell hydrogen burning produces a convective envelope. When the convective envelope reaches its deepest extent, a hydrogen abundance gradient is produced between the region of the star mixed by the convective envelope and the layers below (which are rich in helium). When the hydrogen burning shell passes through this chemical discontinuity, the hydrogen burning rate drops, the radius contracts on a Kelvin-Helmholtz timescale and, as a result, the mass transfer will cease. The same phenomenon is responsible for the occurrence of the luminosity bump in red-giant stars (e.g. Thomas 1967; Christensen-Dalsgaard 2015), first discussed in the context of temporary Roche-lobe detachment in LMXBs in Tauris & Savonije (1999).
The interruption of the mass transfer can be a temporary effect if the envelope is massive enough, such that when the burning shell has passed through the discontinuity, the star still has enough material to burn and can therefore resume its mass transfer. If its envelope has been stripped to a greater extent, then the donor star is unable to resume mass transfer and a proto-WD is formed. This discontinuity in MH,det, observed at all the metallicities studied, distinguishes the systems that undergo this type of temporary detachment (the systems on the right-hand or upper side of the discontinuity) from the systems in which the hydrogen shell burning passes through the hydrogen abundance discontinuity without being able to resume mass transfer afterwards (the systems on the left-hand or lower side of the discontinuity). This explains the increasing values of MH,det with Mproto−WD just below the discontinuity.
4.4. Δtproto: the contraction timescale for proto-WDs
As has been discussed earlier in this work, after the end of the LMXB mass-transfer phase, a certain amount of time, Δtproto, is required by the newly formed object, the proto-WD, to contract and reach its cooling track. This timescale, from Roche-lobe detachment to the beginning of the cooling track (defined as when Teff reaches its maximum value), depends on the mass of the proto-WD and can reach up to 2 Gyr for the lowest mass proto-WDs (Istrate et al. 2014b) down to 10−100 Myr for the highest mass helium WDs. More importantly, Istrate et al. (2014b) have shown that Δtproto is not influenced by the occurrence of hydrogen shell flashes, and consequently, the suggested dichotomy in WD cooling times produced by hydrogen flashes was called into question.
The determination of Δtproto is important, especially for determining the age of MSPs with helium WD companions independently of the spin-down of the MSP (e.g. van Kerkwijk et al. 2005; Antoniadis et al. 2012; Bassa et al. 2016). During this phase, the proto-WD appears to be bloated, meaning that its radius is significantly larger than the radius of a cold WD of similar mass. As the timescale for this contraction phase (Δtproto) is predicted to be relatively long, a number of ELM WDs should be observed in this bloated stage. One example suggested by Istrate et al. (2014b) is PSR J1816+4510, based on observations by Kaplan et al. (2012, 2013).
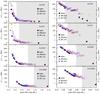 |
Fig. 11 Δtproto for the basic models (purple circles), for the models with diffusion only (orange stars), and for the models with diffusion+rotation (blue squares) as a function of proto-WD mass for Z = 0.02 (top panels), Z = 0.01 (second panels), Z = 0.001 (third panels) and Z = 0.0002 (bottom panels). The left-hand panels show a linear scale in Δtproto while the right-hand panels show a log scale. Open symbols denote models that experience hydrogen shell flashes, whereas filled symbols denote models that avoid flashes. The grey shaded regions indicate temporary Roche-lobe detachment. |
Figure 11 shows Δtproto for all our computed models. One feature is the occurrence of clustering in the data that groups the proto-WDs that undergo the same number of flashes (see Appendix A). As discussed before, the models with diffusion only and diffusion+rotation behave in a very similar way. In general, Δtproto is larger than in the basic models when diffusion is included because of the additional flashes. For Z = 0.02 and Z = 0.01 there is a smooth transition of Δtproto around the limit of the occurrence of flashes (models that experienced hydrogen shell flashes are plotted with open symbols). We recall that for these high metallicities all the models with diffusion only and diffusion+rotation (except for the model with the lowest mass at Z = 0.01) undergo unstable burning through CNO hydrogen shell flashes. However, for Z = 0.001 and Z = 0.0002 we note a slight increase in Δtproto around the lowest threshold for flashes for all models where diffusion is included.
The maximum value of Teff reached during the proto-WD phase, however, is very sensitive to both the time and the spatial resolution with which the stellar structure is computed. With this in mind, and taking into account that Δtproto is relatively small around the lowest threshold for flashes at these low metallicities the results shown in Fig. 11 do not present evidence for a dichotomy in Δtproto that is due to hydrogen flashes. However, for the long-term evolution on the WD cooling track the situation is different, as we discuss below.
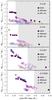 |
Fig. 12 Hydrogen envelope mass at the beginning of the cooling track (maximum Teff) for the basic models (purple circles), for the models with diffusion only (orange stars) and for the models with diffusion+rotation (blue squares) as a function of proto-WD mass. See Fig. 11 for further explanations. |
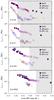 |
Fig. 13 Timescale tcool,L-2 (see text) for the basic models (purple circles), for the models with diffusion only (orange stars), and for the models with diffusion+rotation (blue squares) as a function of proto-WD mass. See Fig. 11 for further explanations. |
4.5. Dichotomy on ELM WD cooling tracks
The hydrogen envelope mass is an important parameter that determines the long-term cooling timescale for WDs. Following the work of Istrate et al. (2014b), we consider the beginning of the cooling track as the moment at which the proto-WD reaches its maximum value of Teff. Figure 12 shows the remaining hydrogen envelope mass when the proto-WD reaches the maximum Teff (MH,Teff,max) and finally settles on the cooling track, as a function of the mass of the proto-WD. Again, the large scatter is related to the number of flashes (between 0−7) that the proto-WD experiences. At all metallicities we note a jump in MH,Teff,max that occurs at the lowest threshold for flashes. At low metallicities, the effect is more pronounced in models with diffusion and diffusion+rotation, whereas at Z = 0.02 the discontinuity is only seen in the basic models (all the systems for which element diffusion is considered experience hydrogen flashes). When element diffusion is included, the hydrogen envelope mass at the beginning of the cooling track is typically twice as small as when element diffusion is neglected (basic models), except for models at low metallicities and masses below the flash threshold. This significantly affects the cooling times of these objects.
For example, consider an ELM WD with a mass of ~ 0.20 M⊙. Figure 12 shows that flashes at high metallicities (Z = 0.02 and Z = 0.01) cause the amount of remaining hydrogen envelope mass at  (MH,Teff,max~1.0×10⁻³ M⊙) to be up to five times smaller than for the cases with lower metallicities (Z = 0.001 and Z = 0.0002) where flashes do not develop and a thick ~ 5.0 × 10⁻³ M⊙ residual hydrogen envelope remains at the onset of the cooling track. Hence, it is clear that we do see a dichotomy in the long-term cooling ages of ELM WDs, such that those proto-WDs that experience flashes will have thin hydrogen envelopes and therefore shorter cooling timescales, whereas proto-WDs that avoid flashes will have relatively thick hydrogen envelopes and cool on a much longer timescale. It is important to stress that the threshold mass at which this transition occurs is dependent on metallicity.
We now analyse the dichotomy in long-term cooling in more detail. Figure 13 shows the time from the end of the LMXB mass transfer until the WD luminosity reaches log (L/L⊙) = −2.0, tcool,L-2 (including Δtproto). Some of our computed models are not plotted because they reached an age of 14 Gyr before log (L/L⊙) = −2.0. For the basic models, independent of metallicity, there is a small difference in cooling times between the WDs that experience flashes and those for which the hydrogen burning in the shell is stable. However, for the WDs computed with diffusion and diffusion+rotation, the difference in cooling times between systems with and without flashes can be as large as 3 Gyr, see Fig. 14. We conclude that when element diffusion is included, the occurrence of hydrogen shell flashes does indeed produce a (metallicity-dependent) dichotomy in the cooling times of helium WDs.
Only when element diffusion is neglected in the modelling there is no or only a very small difference between the WDs that experience unstable hydrogen burning compared to those for which the residual hydrogen burning is stable, independent of metallicity. This can explain the findings of Istrate et al. (2014b), who evolved their stellar models without element diffusion and thus questioned the dichotomy idea.
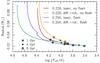 |
Fig. 14 Different cooling curves illustrating the differences between basic models (without diffusion and rotation) and models that include element diffusion and rotation. All models have a metallicity of Z = 0.001. The value of MWD/M⊙ is shown for each track, and the difference in masses can partly explain the different cooling rates. However, more important in this respect is the occurrence of hydrogen shell flashes (blue and green curves), which accelerates the cooling and creates a dichotomy in WD cooling ages (see text). |
5. Discussion
5.1. Rotational mixing: source of surface metals?
In the past few years, metals, especially calcium, were detected in the spectra of ELM WDs with a surface gravity lower than ~5.9. Metals sink below the atmosphere on a timescale much shorter than the evolutionary timescale of the proto-WD, which means that another process is required to either counteract the gravitational settling or replenish the depleted metals. There are several possible processes that can be responsible for the observed surface composition of ELM WDs. For a detailed discussion, we refer to Gianninas et al. (2014a) and Hermes et al. (2014b). For higher mass (carbon-oxygen) WDs, the presence of metals in their atmosphere is explained by accretion from circumstellar debris discs formed by tidal disruption of planetary bodies (e.g. Debes & Sigurdsson 2002; Jura et al. 2007), which are detectable through excess flux in the IR (e.g. Farihi et al. 2009; Kilic et al. 2006). This scenario seems unlikely for ELM WDs given that their compact orbits make the existence of a debris disk dynamically difficult to explain.
Kaplan et al. (2013) suggested that the observed metals are brought to the surface by the pulse-driven convection developed during a hydrogen shell flash. However, shortly after the convection zone vanishes, the metals will sink below the stellar surface as a result of gravitational settling.
A mechanism that can counteract diffusion would be radiative levitation. However, as Hermes et al. (2014a) showed, radiative levitation alone cannot explain the observed abundances, especially in the case of calcium. They suggested that in addition to radiative levitation, another support mechanism such as rotational mixing is likely required to explain the observed pattern in the metal abundances of ELM WDs. Here, we discuss the effect of rotational mixing in determining the surface composition of ELM WDs.
Figure 15 shows the evolution of log (Ca/H) at the stellar surface from the beginning of the proto-WD phase (Roche-lobe detachment) to several hundred Myr onto the cooling track. In the model that only includes diffusion calcium sinks much faster beneath the surface than the proto-WD evolutionary timescale after the mass transfer ends. It is brought back to the surface through to the pulse-driven convection zone that is developed by the occurrence of a hydrogen shell flash, only to quickly sink again as a result of the gravitational settling. In the diffusion+rotation model, rotational mixing at the surface acts against the gravitational settling (see Sect. 4.1.1). As the proto-WD advances towards higher surface gravity, rotational mixing becomes less efficient than gravitational settling. During the proto-WD phase, the star may experience several episodes of radial expansion followed by contraction and may also develop zones of convection through the hydrogen flashes. This interplay between convection, expansion (low surface gravity), contraction (high surface gravity), and rotational mixing explains the pattern shown in Fig. 15. When the proto-WD enters the cooling track, the surface gravity steadily increases and gravitational settling finally overcomes the mixing that is due to rotation. As a long-term result, the metals will sink below the surface, leaving behind a pure hydrogen envelope.
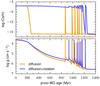 |
Fig. 15 Evolution of log (Ca/H) at the stellar surface (top panel) and log g (bottom panel) for a 0.185 M⊙ proto-WD computed with diffusion only (orange) and diffusion+rotation (blue) for Z = 0.02. The starting point (t = 0) is defined at the moment of Roche-lobe detachment. |
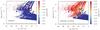 |
Fig. 16 Surface gravity versus effective temperature for the models with diffusion only (left panel), and diffusion+rotation (right panel), both calculated for a metallicity of Z = 0.02. Each evolutionary track is plotted as a dot at 0.5 Myr intervals and colour-coded according to the value of log (Ca/H) at the stellar surface. The over-plotted squares are the observed (proto)WDs with measured Ca abundances taken from Gianninas et al. (2014a). |
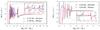 |
Fig. 17 Comparison of evolutionary tracks of Althaus et al. (2013) and this work (including diffusion only) for a ~ 0.18 M⊙ WD (left panel) and ~ 0.27 M⊙ WD (right panel). The post-RLO evolution of luminosity, given by CNO burning, is plotted as a function of the hydrogen envelope mass. Time goes from right to left. The inset shows an artefact of hydrogen production during the shell flashes in the Althaus et al. (2013) models, see text. |
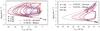 |
Fig. 18 Evolutionary tracks in the (Teff,log g)-diagram for the same models as in Fig. 17. The circles, stars, and squares indicate cooling ages of 1, 4, and 8 Gyr, respectively. For the 0.18 M⊙ WD, the 1 Gyr symbols for the two models almost coincide. Moreover, we note that the models from this work are only calculated to an age of 14 Gyr, which prevents cooling ages exceeding 3 Gyr for the 0.18 M⊙ model and 6 Gyr for the 0.27 M⊙ model. |
We plott in Fig. 16 all the models with Z = 0.02 computed with diffusion only (left panel) and diffusion+rotation (right panel). The points are spaced at intervals of 0.5 Myr and colour-coded according to the value of log (Ca/H). Over-plotted are the data points from Gianninas et al. (2014a). The left panel clearly shows that the flash scenario discussed above cannot explain the observations. On the other hand, when rotational mixing is included, we can qualitatively explain the presence of calcium in the spectra of proto-WDs as a natural result of their evolution. We recall that the observational data most likely belong to populations with different metallicities, while in Fig. 16 we only plot our models with Z = 0.02. The lack of observations of proto-WDs at high Teff arises because the detection limit of Ca lines depends on the effective temperature (see Fig. 9 in Gianninas et al. 2014a).
5.2. Comparison with previous work
As discussed in Gianninas et al. (2015) and Bours et al. (2015), the models of Istrate et al. (2014b; from here on I14) and Althaus et al. (2013; A13) show a relatively large discrepancy in their cooling ages. Although the initial binary parameters, and to some extent the metallicities, are different in the two sets of models, the main difference is that the models of A13 include element diffusion, which has an important role in reducing the hydrogen envelope mass through flashes (cf. Sect. 4.5), and thus consequently leads to accelerated cooling and therefore younger cooling ages than in I14 models.
Here, we compare our new models including element diffusion (but without rotational mixing to enable comparison) (I16) with the A13 models. We also adopted the same initial binary parameters, namely a 1.0 M⊙ donor star and a 1.4 M⊙ neutron star accretor, and also applied the same metallicity of Z = 0.01. A13 found that the lower mass limit for which hydrogen shell flashes occur is somewhere in the interval 0.176−0.182 M⊙ (i.e. between the last model with stable shell burning and the first model that experiences flashes), while we find a lower mass limit of 0.165−0.169 M⊙.
Figure 17 compares the I16 models with those of A13 by showing the evolution of luminosity produced by CNO burning as a function of hydrogen envelope mass for a ~ 0.18 M⊙ and a ~ 0.27 M⊙ (proto) helium WD. One important difference is the hydrogen envelope mass left at Roche-lobe detachment. For the 0.18 M⊙ WD, the model of I16 initially has a more massive hydrogen envelope, while for the 0.27 M⊙ WD it is the opposite. We mention again that in our models diffusion acts from the ZAMS, in contrast with the A13 models, where diffusion is turned on during the proto-WD evolution. Figure 17 also shows that the A13 models contain a numerical artefact by which hydrogen is created during CNO burning (see inset).
In Fig. 18 we present a (Teff,log g)-diagram and compare the evolutionary tracks from Fig. 17. The main difference are additional mass-transfer episodes in the I16 models as a result of a few vigorous flashes. This effect will in the end leave a slightly lower WD mass at the beginning of the cooling track. These differences in proto-WD evolution, combined with the artificial creation of hydrogen in the A13 models, result in slight differences on the cooling track. However, the difference between the A13 models and the I16 models are significantly smaller than when comparing the A13 models with the I14 models (Gianninas et al. 2015; Bours et al. 2015).
5.3. Relation of mass to orbital period in WDs
When low-mass stars (< 2.3 M⊙) reach the red-giant branch, the radius of the star mainly depends on the mass of the degenerate helium core and is almost entirely independent of the mass of the envelope (Refsdal & Weigert 1971; Webbink et al. 1983). For the formation of binary MSPs, this relation proves to be very important because it provides a correlation between the mass of the newly formed WD and Porb following the mass transfer episode (Savonije 1987; Joss et al. 1987; Rappaport et al. 1995; Tauris & Savonije 1999; Nelson et al. 2004; De Vito & Benvenuto 2010; Lin et al. 2011; Shao & Li 2012; Jia & Li 2014; Istrate et al. 2014a).
Figure 19 shows the (MWD,Porb)-relation for all the models computed in this work. Our results are in fine agreement with Tauris & Savonije (1999) for systems with Porb > 1−2 days. For close-orbit systems with Porb < 1 day our results agree well with Lin et al. (2011) and Istrate et al. (2014a). We note a slight discontinuity in the relation, which is dependent on metallicity as discussed in Sect. 4.3. This weak break in the (MWD,Porb)-relation was previously reported by other authors (e.g. Nelson et al. 2004; Jia & Li 2014).
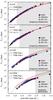 |
Fig. 19 (MWD,Porb)-relation for Z = 0.02 (top panel), Z = 0.01 (second panel), Z = 0.001 (third panel), and Z = 0.0002 (bottom panel). The grey shaded area denotes the LMXB systems that undergo a temporary detachment (see text). The purple circles represent the basic models, the orange stars the models with diffusion only and the blue squares the models with diffusion+rotation. Over-plotted are the theoretical relations by Tauris & Savonije (1999) and Lin et al. (2011) for the respective metallicity. |
6. Conclusions
We computed a grid of models for ELM WDs with different metallicities. For each metallicity, we computed three types of models with different physics included: i) basic models (with no element diffusion nor rotation); ii) diffusion (including element diffusion); and iii) diffusion+rotation. For the first time, we took into account the combined effects of rotational mixing and element diffusion in the evolution of WD progenitors and during the proto-WD phase and WD cooling. The main results obtained are summarized as follows:
-
1.
We confirm that element diffusion plays a significant role in the evolution of proto-WDs that experience hydrogen shell flashes. We also confirm that the unstable burning is triggered by the diffusive hydrogen tail reaching the hot deep layers inside the star (Althaus et al. 2001a). The formation of the hydrogen tail is a cyclic process and depends on the available hydrogen in the envelope. Consequently, the number of flashes experienced by a proto-WD of a given mass is increased, leading to reduced hydrogen envelope mass and subsequent accelerated cooling, compared with the models without element diffusion.
-
2.
Rotational mixing counteracts the effect of gravitational settling in the surface layers of young bloated ELM proto-WDs, but its efficiency is reduced towards the end of the proto-WD phase, when the star contracts and its surface gravity increases. As a consequence, our new evolutionary models including rotational mixing predict that ELM proto-WDs have mixed H/He envelopes during a significant part of their evolution before settling on the cooling track, in accordance with recent observational evidence from pulsations in ELM proto-WDs (Gianninas et al. 2016). Except for this, the general properties, such as the number of flashes, are not strongly influenced by the presence of rotational mixing.
-
3.
Although the hydrogen envelope left after detachment from the LMXB phase is a small fraction of the total WD mass, it has a very high angular momentum content compared to the core. Because the proto-WD contracts while this hydrogen is burnt and angular momentum mixes inwards following each flash, the resulting WD on the cooling track is spun up significantly to a rotation period well below the orbital period.
-
4.
The hydrogen envelope mass in newborn proto-WDs is influenced by the evolutionary stage of the donor star at the moment when LMXB mass transfer is initiated. In particular, we found that LMXB donor stars that experience a temporary contraction will produce proto-WDs with a significantly reduced hydrogen envelope mass at the moment of the final Roche-lobe detachment. In general, the shorter the orbital period at the onset of the LMXB phase, the lower the mass of the proto-WD and the higher the final envelope mass. The hydrogen envelope mass is also metallicity dependent, such that (for the same proto-WD mass) the lower the metallicity, the higher the envelope mass.
-
5.
In general, our resulting mass range for the occurrence of flashes is similar to those found in the literature. For Z = 0.02, all our models with diffusion experience flashes, and for Z = 0.01 we obtain a lower limit of ~ 0.16 M⊙, compared to ~ 0.18 M⊙ found by Althaus et al. (2013).
-
6.
We identified two timescales relevant for understanding the evolution of (proto) WDs. The evolutionary timescale of the contraction of proto-WDs, Δtproto, can reach up to 2.5 Gyr for the lowest proto-WD masses, while for the higher WD masses it is < 100 Myr. When element diffusion is included, this timescale is slightly increased by more numerous flashes than for the case when element diffusion is neglected. As concluded in Istrate et al. (2014b), we did not find a dichotomy in the Δtproto distribution with respect to the occurrence of flashes, but rather a smooth transition. However, we note a small increase in Δtproto close to the flash limit for Z = 0.001 and Z = 0.002. The cooling timescale tcool,L-2 describes the evolution of the WD from LMXB detachment until the WD has evolved well down the cooling track and reaches log (L/L⊙) = −2. This timescale is mostly determined by the hydrogen envelope mass that remains after the proto-WD phase. In the basic models (without element diffusion or rotation), independent of metallicity, there is a very small difference between the models that experience flashes and those that do not. However, we confirm, as first stated by Althaus et al. (2001a), that the situation is different when element diffusion is included, which leads to a dichotomy in the cooling timescale of ELM WDs.
-
7.
We investigated whether the observed metal features in ELM proto-WDs might be linked to the internal evolution of these objects. In particular, we analysed the evolution of the surface abundance of calcium and concluded that rotational mixing is a key component for producing the observed pattern in the (log g,Teff)-diagram.
The systematic investigation presented here for the effects of thermal and chemical diffusion, gravitational settling, and rotational mixing on a wide range of LMXBs with different initial masses, orbital periods, and metallicity, leads us to conclude that theoretical models must include these aspects when they are compared to observational data of ELM WDs. Hence, with these improved models at hand, the implications are better constraints on the true ages and masses of these WDs and therefore also on the ages and masses of their companion stars, such as millisecond radio pulsars. Moreover, the grid of models we presented might be further used for astroseismology calculations to determine the pulsational behaviour of ELM proto-WDs and ELM WDs.
Acknowledgments
We thank the anonymous referee for helpful advice. A.G.I. thanks Alejandra Romero and Elvijs Matrozis for very useful discussions and BWin Technologies Ltd. for the computing cores on which the simulations in this work were performed.
References
- Althaus, L. G., & Benvenuto, O. G. 2000, MNRAS, 317, 952 [NASA ADS] [CrossRef] [Google Scholar]
- Althaus, L. G., Serenelli, A. M., & Benvenuto, O. G. 2001a, MNRAS, 323, 471 [NASA ADS] [CrossRef] [Google Scholar]
- Althaus, L. G., Serenelli, A. M., & Benvenuto, O. G. 2001b, ApJ, 554, 1110 [NASA ADS] [CrossRef] [Google Scholar]
- Althaus, L. G., Serenelli, A. M., & Benvenuto, O. G. 2001c, MNRAS, 324, 617 [NASA ADS] [CrossRef] [Google Scholar]
- Althaus, L. G., Panei, J. A., Romero, A. D., et al. 2009, A&A, 502, 207 [NASA ADS] [CrossRef] [EDP Sciences] [Google Scholar]
- Althaus, L. G., Miller Bertolami, M. M., & Córsico, A. H. 2013, A&A, 557, A19 [NASA ADS] [CrossRef] [EDP Sciences] [Google Scholar]
- Amaro-Seoane, P., Aoudia, S., Babak, S., et al. 2012, Class. Quant. Grav., 29, 124016 [NASA ADS] [CrossRef] [Google Scholar]
- Andrews, J. J., Price-Whelan, A. M., & Agüeros, M. A. 2014, ApJ, 797, L32 [NASA ADS] [CrossRef] [Google Scholar]
- Antoniadis, J., van Kerkwijk, M. H., Koester, D., et al. 2012, MNRAS, 423, 3316 [Google Scholar]
- Bassa, C. G., Antoniadis, J., Camilo, F., et al. 2016, MNRAS, 455, 3806 [NASA ADS] [CrossRef] [Google Scholar]
- Bildsten, L., Shen, K. J., Weinberg, N. N., & Nelemans, G. 2007, ApJ, 662, L95 [NASA ADS] [CrossRef] [Google Scholar]
- Bours, M. C. P., Marsh, T. R., Gänsicke, B. T., et al. 2015, MNRAS, 450, 3966 [NASA ADS] [CrossRef] [Google Scholar]
- Brown, W. R., Kilic, M., Allen de Prieto, C., & Kenyon, S. J. 2010, ApJ, 723, 1072 [NASA ADS] [CrossRef] [Google Scholar]
- Brown, W. R., Kilic, M., Allen de Prieto, C., & Kenyon, S. J. 2012, ApJ, 744, 142 [NASA ADS] [CrossRef] [Google Scholar]
- Brown, W. R., Kilic, M., Allen de Prieto, C., Gianninas, A., & Kenyon, S. J. 2013, ApJ, 769, 66 [NASA ADS] [CrossRef] [Google Scholar]
- Brown, W. R., Gianninas, A., Kilic, M., Kenyon, S. J., & Allen de Prieto, C. 2016, ApJ, 818, 155 [NASA ADS] [CrossRef] [Google Scholar]
- Cadelano, M., Pallanca, C., Ferraro, F. R., et al. 2015, ApJ, 812, 63 [NASA ADS] [CrossRef] [Google Scholar]
- Camilo, F., Thorsett, S. E., & Kulkarni, S. R. 1994, ApJ, 421, L15 [NASA ADS] [CrossRef] [Google Scholar]
- Cassisi, S., Potekhin, A. Y., Pietrinferni, A., Catelan, M., & Salaris, M. 2007, ApJ, 661, 1094 [NASA ADS] [CrossRef] [Google Scholar]
- Christensen-Dalsgaard, J. 2015, MNRAS, 453, 666 [NASA ADS] [CrossRef] [Google Scholar]
- Clayton, G. C. 2013, in 18th European White Dwarf Workshop, ASP Conf. Ser., 469, 133 [NASA ADS] [Google Scholar]
- Córsico, A. H., & Althaus, L. G. 2014a, A&A, 569, A106 [NASA ADS] [CrossRef] [EDP Sciences] [Google Scholar]
- Córsico, A. H., & Althaus, L. G. 2014b, ApJ, 793, L17 [NASA ADS] [CrossRef] [Google Scholar]
- Córsico, A. H., Althaus, L. G., Serenelli, A. M., et al. 2016, A&A, 588, A74 [NASA ADS] [CrossRef] [EDP Sciences] [Google Scholar]
- Corti, M. A., Kanaan, A., Córsico, A. H., et al. 2016, A&A, 587, L5 [NASA ADS] [CrossRef] [EDP Sciences] [Google Scholar]
- De Vito, M. A., & Benvenuto, O. G. 2010, MNRAS, 401, 2552 [NASA ADS] [CrossRef] [Google Scholar]
- Debes, J. H., & Sigurdsson, S. 2002, ApJ, 572, 556 [NASA ADS] [CrossRef] [Google Scholar]
- Detmers, R. G., Langer, N., Podsiadlowski, P., & Izzard, R. G. 2008, A&A, 484, 831 [NASA ADS] [CrossRef] [EDP Sciences] [Google Scholar]
- Driebe, T., Schoenberner, D., Bloecker, T., & Herwig, F. 1998, A&A, 339, 123 [Google Scholar]
- Farihi, J., Jura, M., & Zuckerman, B. 2009, ApJ, 694, 805 [NASA ADS] [CrossRef] [Google Scholar]
- Ferguson, J. W., Alexander, D. R., Allard, F., et al. 2005, ApJ, 623, 585 [NASA ADS] [CrossRef] [Google Scholar]
- Foley, R. J. 2015, MNRAS, 452, 2463 [NASA ADS] [CrossRef] [Google Scholar]
- Fontaine, G., & Michaud, G. 1979, ApJ, 231, 826 [NASA ADS] [CrossRef] [Google Scholar]
- Gautschy, A. 2013, ArXiv e-prints [arXiv:1303.6652] [Google Scholar]
- Gianninas, A., Dufour, P., Kilic, M., et al. 2014a, ApJ, 794, 35 [NASA ADS] [CrossRef] [Google Scholar]
- Gianninas, A., Hermes, J. J., Brown, W. R., et al. 2014b, ApJ, 781, 104 [NASA ADS] [CrossRef] [Google Scholar]
- Gianninas, A., Kilic, M., Brown, W. R., Canton, P., & Kenyon, S. J. 2015, ApJ, 812, 167 [NASA ADS] [CrossRef] [Google Scholar]
- Gianninas, A., Curd, B., Fontaine, G., Brown, W. R., & Kilic, M. 2016, ApJ, 822, L27 [NASA ADS] [CrossRef] [Google Scholar]
- Grevesse, N., & Sauval, A. J. 1998, Space Sci. Rev., 85, 161 [NASA ADS] [CrossRef] [Google Scholar]
- Heber, U. 2016, PASP, 128, 966 [Google Scholar]
- Heger, A., Langer, N., & Woosley, S. E. 2000, ApJ, 528, 368 [NASA ADS] [CrossRef] [Google Scholar]
- Heger, A., Woosley, S. E., & Spruit, H. C. 2005, ApJ, 626, 350 [NASA ADS] [CrossRef] [Google Scholar]
- Henyey, L., Vardya, M. S., & Bodenheimer, P. 1965, ApJ, 142, 841 [NASA ADS] [CrossRef] [Google Scholar]
- Hermes, J. J., Kilic, M., Brown, W. R., et al. 2012a, ApJ, 757, L21 [NASA ADS] [CrossRef] [Google Scholar]
- Hermes, J. J., Montgomery, M. H., Winget, D. E., et al. 2012b, ApJ, 750, L28 [Google Scholar]
- Hermes, J. J., Montgomery, M. H., Gianninas, A., et al. 2013a, MNRAS, 436, 3573 [NASA ADS] [CrossRef] [Google Scholar]
- Hermes, J. J., Montgomery, M. H., Winget, D. E., et al. 2013b, ApJ, 765, 102 [Google Scholar]
- Hermes, J. J., Brown, W. R., Kilic, M., et al. 2014a, ApJ, 792, 39 [NASA ADS] [CrossRef] [Google Scholar]
- Hermes, J. J., Gänsicke, B. T., Koester, D., et al. 2014b, MNRAS, 444, 1674 [NASA ADS] [CrossRef] [Google Scholar]
- Hu, H., Tout, C. A., Glebbeek, E., & Dupret, M.-A. 2011, MNRAS, 418, 195 [NASA ADS] [CrossRef] [Google Scholar]
- Hurley, J. R., Tout, C. A., & Pols, O. R. 2002, MNRAS, 329, 897 [NASA ADS] [CrossRef] [Google Scholar]
- Iben, Jr., I., & MacDonald, J. 1985, ApJ, 296, 540 [NASA ADS] [CrossRef] [Google Scholar]
- Iben, Jr., I., & Tutukov, A. V. 1984, ApJS, 54, 335 [NASA ADS] [CrossRef] [Google Scholar]
- Iglesias, C. A., & Rogers, F. J. 1993, ApJ, 412, 752 [NASA ADS] [CrossRef] [Google Scholar]
- Iglesias, C. A., & Rogers, F. J. 1996, ApJ, 464, 943 [NASA ADS] [CrossRef] [Google Scholar]
- Istrate, A. G., Tauris, T. M., & Langer, N. 2014a, A&A, 571, A45 [NASA ADS] [CrossRef] [EDP Sciences] [Google Scholar]
- Istrate, A. G., Tauris, T. M., Langer, N., & Antoniadis, J. 2014b, A&A, 571, L3 [NASA ADS] [CrossRef] [EDP Sciences] [Google Scholar]
- Itoh, N., Kohyama, Y., & Takeuchi, H. 1987, ApJ, 317, 733 [NASA ADS] [CrossRef] [Google Scholar]
- Jeffery, C. S., & Saio, H. 2013, MNRAS, 435, 885 [NASA ADS] [CrossRef] [Google Scholar]
- Jia, K., & Li, X.-D. 2014, ApJ, 791, 127 [NASA ADS] [CrossRef] [Google Scholar]
- Joss, P. C., Rappaport, S., & Lewis, W. 1987, ApJ, 319, 180 [NASA ADS] [CrossRef] [Google Scholar]
- Jura, M., Farihi, J., & Zuckerman, B. 2007, ApJ, 663, 1285 [NASA ADS] [CrossRef] [Google Scholar]
- Kaplan, D. L., Stovall, K., Ransom, S. M., et al. 2012, ApJ, 753, 174 [NASA ADS] [CrossRef] [Google Scholar]
- Kaplan, D. L., Bhalerao, V. B., van Kerkwijk, M. H., et al. 2013, ApJ, 765, 158 [NASA ADS] [CrossRef] [Google Scholar]
- Kepler, S. O., Pelisoli, I., Koester, D., et al. 2016, MNRAS, 455, 3413 [NASA ADS] [CrossRef] [Google Scholar]
- Kilic, M., von Hippel, T., Leggett, S. K., & Winget, D. E. 2006, ApJ, 646, 474 [NASA ADS] [CrossRef] [Google Scholar]
- Kilic, M., Stanek, K. Z., & Pinsonneault, M. H. 2007, ApJ, 671, 761 [NASA ADS] [CrossRef] [Google Scholar]
- Kilic, M., Brown, W. R., Allen de Prieto, C., et al. 2011, ApJ, 727, 3 [NASA ADS] [CrossRef] [Google Scholar]
- Kilic, M., Brown, W. R., Allen de Prieto, C., et al. 2012, ApJ, 751, 141 [NASA ADS] [CrossRef] [Google Scholar]
- Kilic, M., Brown, W. R., & Hermes, J. J. 2013, in 9th LISA Symp., eds. G. Auger, P. Binétruy, & E. Plagnol, ASP Conf. Ser., 467, 47 [Google Scholar]
- Kilic, M., Hermes, J. J., Gianninas, A., et al. 2014, MNRAS, 438, L26 [NASA ADS] [CrossRef] [Google Scholar]
- Kilic, M., Hermes, J. J., Gianninas, A., & Brown, W. R. 2015, MNRAS, 446, L26 [NASA ADS] [CrossRef] [Google Scholar]
- Koester, D., Voss, B., Napiwotzki, R., et al. 2009, A&A, 505, 441 [NASA ADS] [CrossRef] [EDP Sciences] [Google Scholar]
- Latour, M., Heber, U., Irrgang, A., et al. 2016, A&A, 585, A115 [NASA ADS] [CrossRef] [EDP Sciences] [Google Scholar]
- Lin, J., Rappaport, S., Podsiadlowski, P., et al. 2011, ApJ, 732, 70 [NASA ADS] [CrossRef] [Google Scholar]
- Lorimer, D. R., Lyne, A. G., Festin, L., & Nicastro, L. 1995, Nature, 376, 393 [NASA ADS] [CrossRef] [PubMed] [Google Scholar]
- Marsh, T. R., Dhillon, V. S., & Duck, S. R. 1995, MNRAS, 275, 828 [NASA ADS] [CrossRef] [Google Scholar]
- Maxted, P. F. L., Anderson, D. R., Burleigh, M. R., et al. 2011, MNRAS, 418, 1156 [NASA ADS] [CrossRef] [Google Scholar]
- Maxted, P. F. L., Serenelli, A. M., Miglio, A., et al. 2013, Nature, 498, 463 [NASA ADS] [CrossRef] [PubMed] [Google Scholar]
- Maxted, P. F. L., Bloemen, S., Heber, U., et al. 2014a, MNRAS, 437, 1681 [NASA ADS] [CrossRef] [Google Scholar]
- Maxted, P. F. L., Serenelli, A. M., Marsh, T. R., et al. 2014b, MNRAS, 444, 208 [NASA ADS] [CrossRef] [Google Scholar]
- Nandez, J. L. A., Ivanova, N., & Lombardi, J. C. 2015, MNRAS, 450, L39 [NASA ADS] [CrossRef] [Google Scholar]
- Nelemans, G., & Tauris, T. M. 1998, A&A, 335, L85 [NASA ADS] [Google Scholar]
- Nelson, L. A., Dubeau, E., & MacCannell, K. A. 2004, ApJ, 616, 1124 [NASA ADS] [CrossRef] [Google Scholar]
- Panei, J. A., Althaus, L. G., Chen, X., & Han, Z. 2007, MNRAS, 382, 779 [NASA ADS] [CrossRef] [Google Scholar]
- Paquette, C., Pelletier, C., Fontaine, G., & Michaud, G. 1986, ApJS, 61, 197 [NASA ADS] [CrossRef] [Google Scholar]
- Paxton, B., Bildsten, L., Dotter, A., et al. 2011, ApJS, 192, 3 [Google Scholar]
- Paxton, B., Cantiello, M., Arras, P., et al. 2013, ApJS, 208, 4 [NASA ADS] [CrossRef] [Google Scholar]
- Paxton, B., Marchant, P., Schwab, J., et al. 2015, ApJS, 220, 15 [Google Scholar]
- Perets, H. B., Gal-Yam, A., Mazzali, P. A., et al. 2010, Nature, 465, 322 [NASA ADS] [CrossRef] [PubMed] [Google Scholar]
- Rappaport, S., Podsiadlowski, P., Joss, P. C., Di Stefano, R., & Han, Z. 1995, MNRAS, 273, 731 [NASA ADS] [CrossRef] [Google Scholar]
- Refsdal, S., & Weigert, A. 1971, A&A, 13, 367 [NASA ADS] [Google Scholar]
- Rivera-Sandoval, L. E., van den Berg, M., Heinke, C. O., et al. 2015, MNRAS, 453, 2707 [NASA ADS] [CrossRef] [Google Scholar]
- Rohrmann, R. D., Althaus, L. G., García-Berro, E., Córsico, A. H., & Miller Bertolami, M. M. 2012, A&A, 546, A119 [NASA ADS] [CrossRef] [EDP Sciences] [Google Scholar]
- Sarna, M. J., Ergma, E., & Gerškevitš-Antipova, J. 2000, MNRAS, 316, 84 [NASA ADS] [CrossRef] [Google Scholar]
- Savonije, G. J. 1987, Nature, 325, 416 [NASA ADS] [CrossRef] [Google Scholar]
- Serenelli, A. M., Althaus, L. G., Rohrmann, R. D., & Benvenuto, O. G. 2001, MNRAS, 325, 607 [NASA ADS] [CrossRef] [Google Scholar]
- Serenelli, A. M., Althaus, L. G., Rohrmann, R. D., & Benvenuto, O. G. 2002, MNRAS, 337, 1091 [NASA ADS] [CrossRef] [Google Scholar]
- Shao, Y., & Li, X.-D. 2012, ApJ, 756, 85 [NASA ADS] [CrossRef] [Google Scholar]
- Solheim, J.-E. 2010, PASP, 122, 1133 [NASA ADS] [CrossRef] [Google Scholar]
- Spruit, H. C. 2002, A&A, 381, 923 [NASA ADS] [CrossRef] [EDP Sciences] [Google Scholar]
- Tauris, T. M. 2012, Science, 335, 561 [NASA ADS] [CrossRef] [Google Scholar]
- Tauris, T. M., & Savonije, G. J. 1999, A&A, 350, 928 [NASA ADS] [Google Scholar]
- Tauris, T. M., Langer, N., & Kramer, M. 2012, MNRAS, 425, 1601 [NASA ADS] [CrossRef] [Google Scholar]
- Thomas, H.-C. 1967, Z. Astrophys., 67, 420 [NASA ADS] [Google Scholar]
- Thoul, A. A., Bahcall, J. N., & Loeb, A. 1994, ApJ, 421, 828 [NASA ADS] [CrossRef] [Google Scholar]
- Van Grootel, V., Fontaine, G., Brassard, P., & Dupret, M.-A. 2013, ApJ, 762, 57 [NASA ADS] [CrossRef] [Google Scholar]
- van Kerkwijk, M. H., Bassa, C. G., Jacoby, B. A., & Jonker, P. G. 2005, in Binary Radio Pulsars, eds. F. A. Rasio, & I. H. Stairs, ASP Conf. Ser., 328, 357 [Google Scholar]
- Vauclair, G., Vauclair, S., & Greenstein, J. L. 1979, A&A, 80, 79 [NASA ADS] [Google Scholar]
- Webbink, R. F., Rappaport, S., & Savonije, G. J. 1983, ApJ, 270, 678 [NASA ADS] [CrossRef] [Google Scholar]
Appendix A: Properties of the computed models
Properties of selected models.
All Tables
All Figures
|
Fig. 1 Hertzsprung-Russel (HR) diagram showing the formation and cooling of a 0.28 M⊙ helium WD (produced in an LMXB) that undergoes a hydrogen shell flash. The initial progenitor mass is 1.4 M⊙ (Z = 0.02), the neutron star mass is 1.2 M⊙, and the initial orbital period is 5.0 days. See Table 1 for ages at each stage. |
| In the text | |
|
Fig. 2 Post-RLO evolution of surface gravity versus effective temperature for a ~ 0.23 M⊙ proto-WD produced from an LMXB donor star with Z = 0.01. Three different models are shown: basic configuration (top panel), diffusion configuration (middle panel) and diffusion+rotation configuration (bottom panel). Note that the computations are stopped when the age of the model star reaches 14 Gyr (since ZAMS). |
| In the text | |
|
Fig. 3 Evolution of hydrogen surface abundance (top panel) and logg (bottom panel) for the three proto-WDs shown in Fig. 2 illustrating the effect of gravitational settling, rotational mixing and the mixing due to convection zones developed during the hydrogen shell flashes on the surface composition of these objects. |
| In the text | |
|
Fig. 4 Kippenhahn diagrams showing the proto-WD phase for the same systems as in Fig. 2. The plots show cross sections of the outer ~ 0.01 M⊙ envelope of the proto-WD in mass coordinates, along the y-axis, as a function of stellar age on the x-axis (relative to the ZAMS age). The green areas denote zones with convection; the dotted white lines define lines of constant hydrogen abundance, 10-2 to 10-5 (from top to bottom). The intensity of the blue and red colour indicates the hydrogen abundance by mass fraction, as shown on the colour scale to the right. As a result of different input physics, the proto-WDs have slightly different masses and ages. See text for details. |
| In the text | |
|
Fig. 5 Hydrogen burning luminosity versus hydrogen envelope mass, for the same systems as in Fig. 2. The grey stars represent the moment of Roche-lobe detachment while the grey squares denote the point of maximum effective surface temperature. The evolution is from the right to the left. |
| In the text | |
|
Fig. 6 Orbital period evolution for the same models as in Fig. 2. The grey circles represent the onset of the mass transfer, the grey stars represent Roche-lobe detachment and the grey squares mark the maximum Teff. |
| In the text | |
|
Fig. 7 Kippenhahn diagram for the same proto-WD as in Fig. 4, including both element diffusion and rotational mixing. The intensity of the orange and indigo colour indicates the ratio of the spin angular velocity to the orbital angular velocity, Ω/Ωorb, as shown on the colour scale to the right. The green areas and the dotted white lines have the same meaning as in Fig. 4. The black arrows point to the position of the profiles in Fig. 8. |
| In the text | |
|
Fig. 8 Angular momentum diffusion coefficient, ν as function of mass coordinate from the centre (left) to the surface of the star (right) for the same proto-WD as in Fig. 7. Processes included are Spruit-Tayler dynamo (st), Eddington-Sweet circulation (es), and electron viscosity (visc). Each panel (from top to bottom) corresponds to a profile as marked by the black arrows in Fig. 7 (from left to right). The grey dotted lines define lines of constant hydrogen abundance, from 10-5 to 10-2, while the black dashed line represents the hydrogen mass abundance. |
| In the text | |
|
Fig. 9 HR-diagram showing the formation and evolution of a ~ 0.28 M⊙ WD from progenitors with different metallicities. The grey symbols represent the beginning of RLO (circles), the end of RLO (stars) and the maximum Teff (squares). The grey dashed lines represent lines of constant radius. |
| In the text | |
|
Fig. 10 Hydrogen envelope mass at the end of the mass-transfer phase (Roche-lobe detachment) for the basic stars (purple circles), for the stars with diffusion only (orange stars) and for the stars with diffusion+rotation (blue squares) for Z = 0.02 (top panel), Z = 0.01 (second panel), Z = 0.001 (third panel) and Z = 0.0002 (bottom panel) as a function of proto-WD mass. The grey shaded area denotes the stars that undergo a temporary Roche-lobe detachment (see text for details). |
| In the text | |
|
Fig. 11 Δtproto for the basic models (purple circles), for the models with diffusion only (orange stars), and for the models with diffusion+rotation (blue squares) as a function of proto-WD mass for Z = 0.02 (top panels), Z = 0.01 (second panels), Z = 0.001 (third panels) and Z = 0.0002 (bottom panels). The left-hand panels show a linear scale in Δtproto while the right-hand panels show a log scale. Open symbols denote models that experience hydrogen shell flashes, whereas filled symbols denote models that avoid flashes. The grey shaded regions indicate temporary Roche-lobe detachment. |
| In the text | |
|
Fig. 12 Hydrogen envelope mass at the beginning of the cooling track (maximum Teff) for the basic models (purple circles), for the models with diffusion only (orange stars) and for the models with diffusion+rotation (blue squares) as a function of proto-WD mass. See Fig. 11 for further explanations. |
| In the text | |
|
Fig. 13 Timescale tcool,L-2 (see text) for the basic models (purple circles), for the models with diffusion only (orange stars), and for the models with diffusion+rotation (blue squares) as a function of proto-WD mass. See Fig. 11 for further explanations. |
| In the text | |
|
Fig. 14 Different cooling curves illustrating the differences between basic models (without diffusion and rotation) and models that include element diffusion and rotation. All models have a metallicity of Z = 0.001. The value of MWD/M⊙ is shown for each track, and the difference in masses can partly explain the different cooling rates. However, more important in this respect is the occurrence of hydrogen shell flashes (blue and green curves), which accelerates the cooling and creates a dichotomy in WD cooling ages (see text). |
| In the text | |
|
Fig. 15 Evolution of log (Ca/H) at the stellar surface (top panel) and log g (bottom panel) for a 0.185 M⊙ proto-WD computed with diffusion only (orange) and diffusion+rotation (blue) for Z = 0.02. The starting point (t = 0) is defined at the moment of Roche-lobe detachment. |
| In the text | |
|
Fig. 16 Surface gravity versus effective temperature for the models with diffusion only (left panel), and diffusion+rotation (right panel), both calculated for a metallicity of Z = 0.02. Each evolutionary track is plotted as a dot at 0.5 Myr intervals and colour-coded according to the value of log (Ca/H) at the stellar surface. The over-plotted squares are the observed (proto)WDs with measured Ca abundances taken from Gianninas et al. (2014a). |
| In the text | |
|
Fig. 17 Comparison of evolutionary tracks of Althaus et al. (2013) and this work (including diffusion only) for a ~ 0.18 M⊙ WD (left panel) and ~ 0.27 M⊙ WD (right panel). The post-RLO evolution of luminosity, given by CNO burning, is plotted as a function of the hydrogen envelope mass. Time goes from right to left. The inset shows an artefact of hydrogen production during the shell flashes in the Althaus et al. (2013) models, see text. |
| In the text | |
|
Fig. 18 Evolutionary tracks in the (Teff,log g)-diagram for the same models as in Fig. 17. The circles, stars, and squares indicate cooling ages of 1, 4, and 8 Gyr, respectively. For the 0.18 M⊙ WD, the 1 Gyr symbols for the two models almost coincide. Moreover, we note that the models from this work are only calculated to an age of 14 Gyr, which prevents cooling ages exceeding 3 Gyr for the 0.18 M⊙ model and 6 Gyr for the 0.27 M⊙ model. |
| In the text | |
|
Fig. 19 (MWD,Porb)-relation for Z = 0.02 (top panel), Z = 0.01 (second panel), Z = 0.001 (third panel), and Z = 0.0002 (bottom panel). The grey shaded area denotes the LMXB systems that undergo a temporary detachment (see text). The purple circles represent the basic models, the orange stars the models with diffusion only and the blue squares the models with diffusion+rotation. Over-plotted are the theoretical relations by Tauris & Savonije (1999) and Lin et al. (2011) for the respective metallicity. |
| In the text | |
Current usage metrics show cumulative count of Article Views (full-text article views including HTML views, PDF and ePub downloads, according to the available data) and Abstracts Views on Vision4Press platform.
Data correspond to usage on the plateform after 2015. The current usage metrics is available 48-96 hours after online publication and is updated daily on week days.
Initial download of the metrics may take a while.