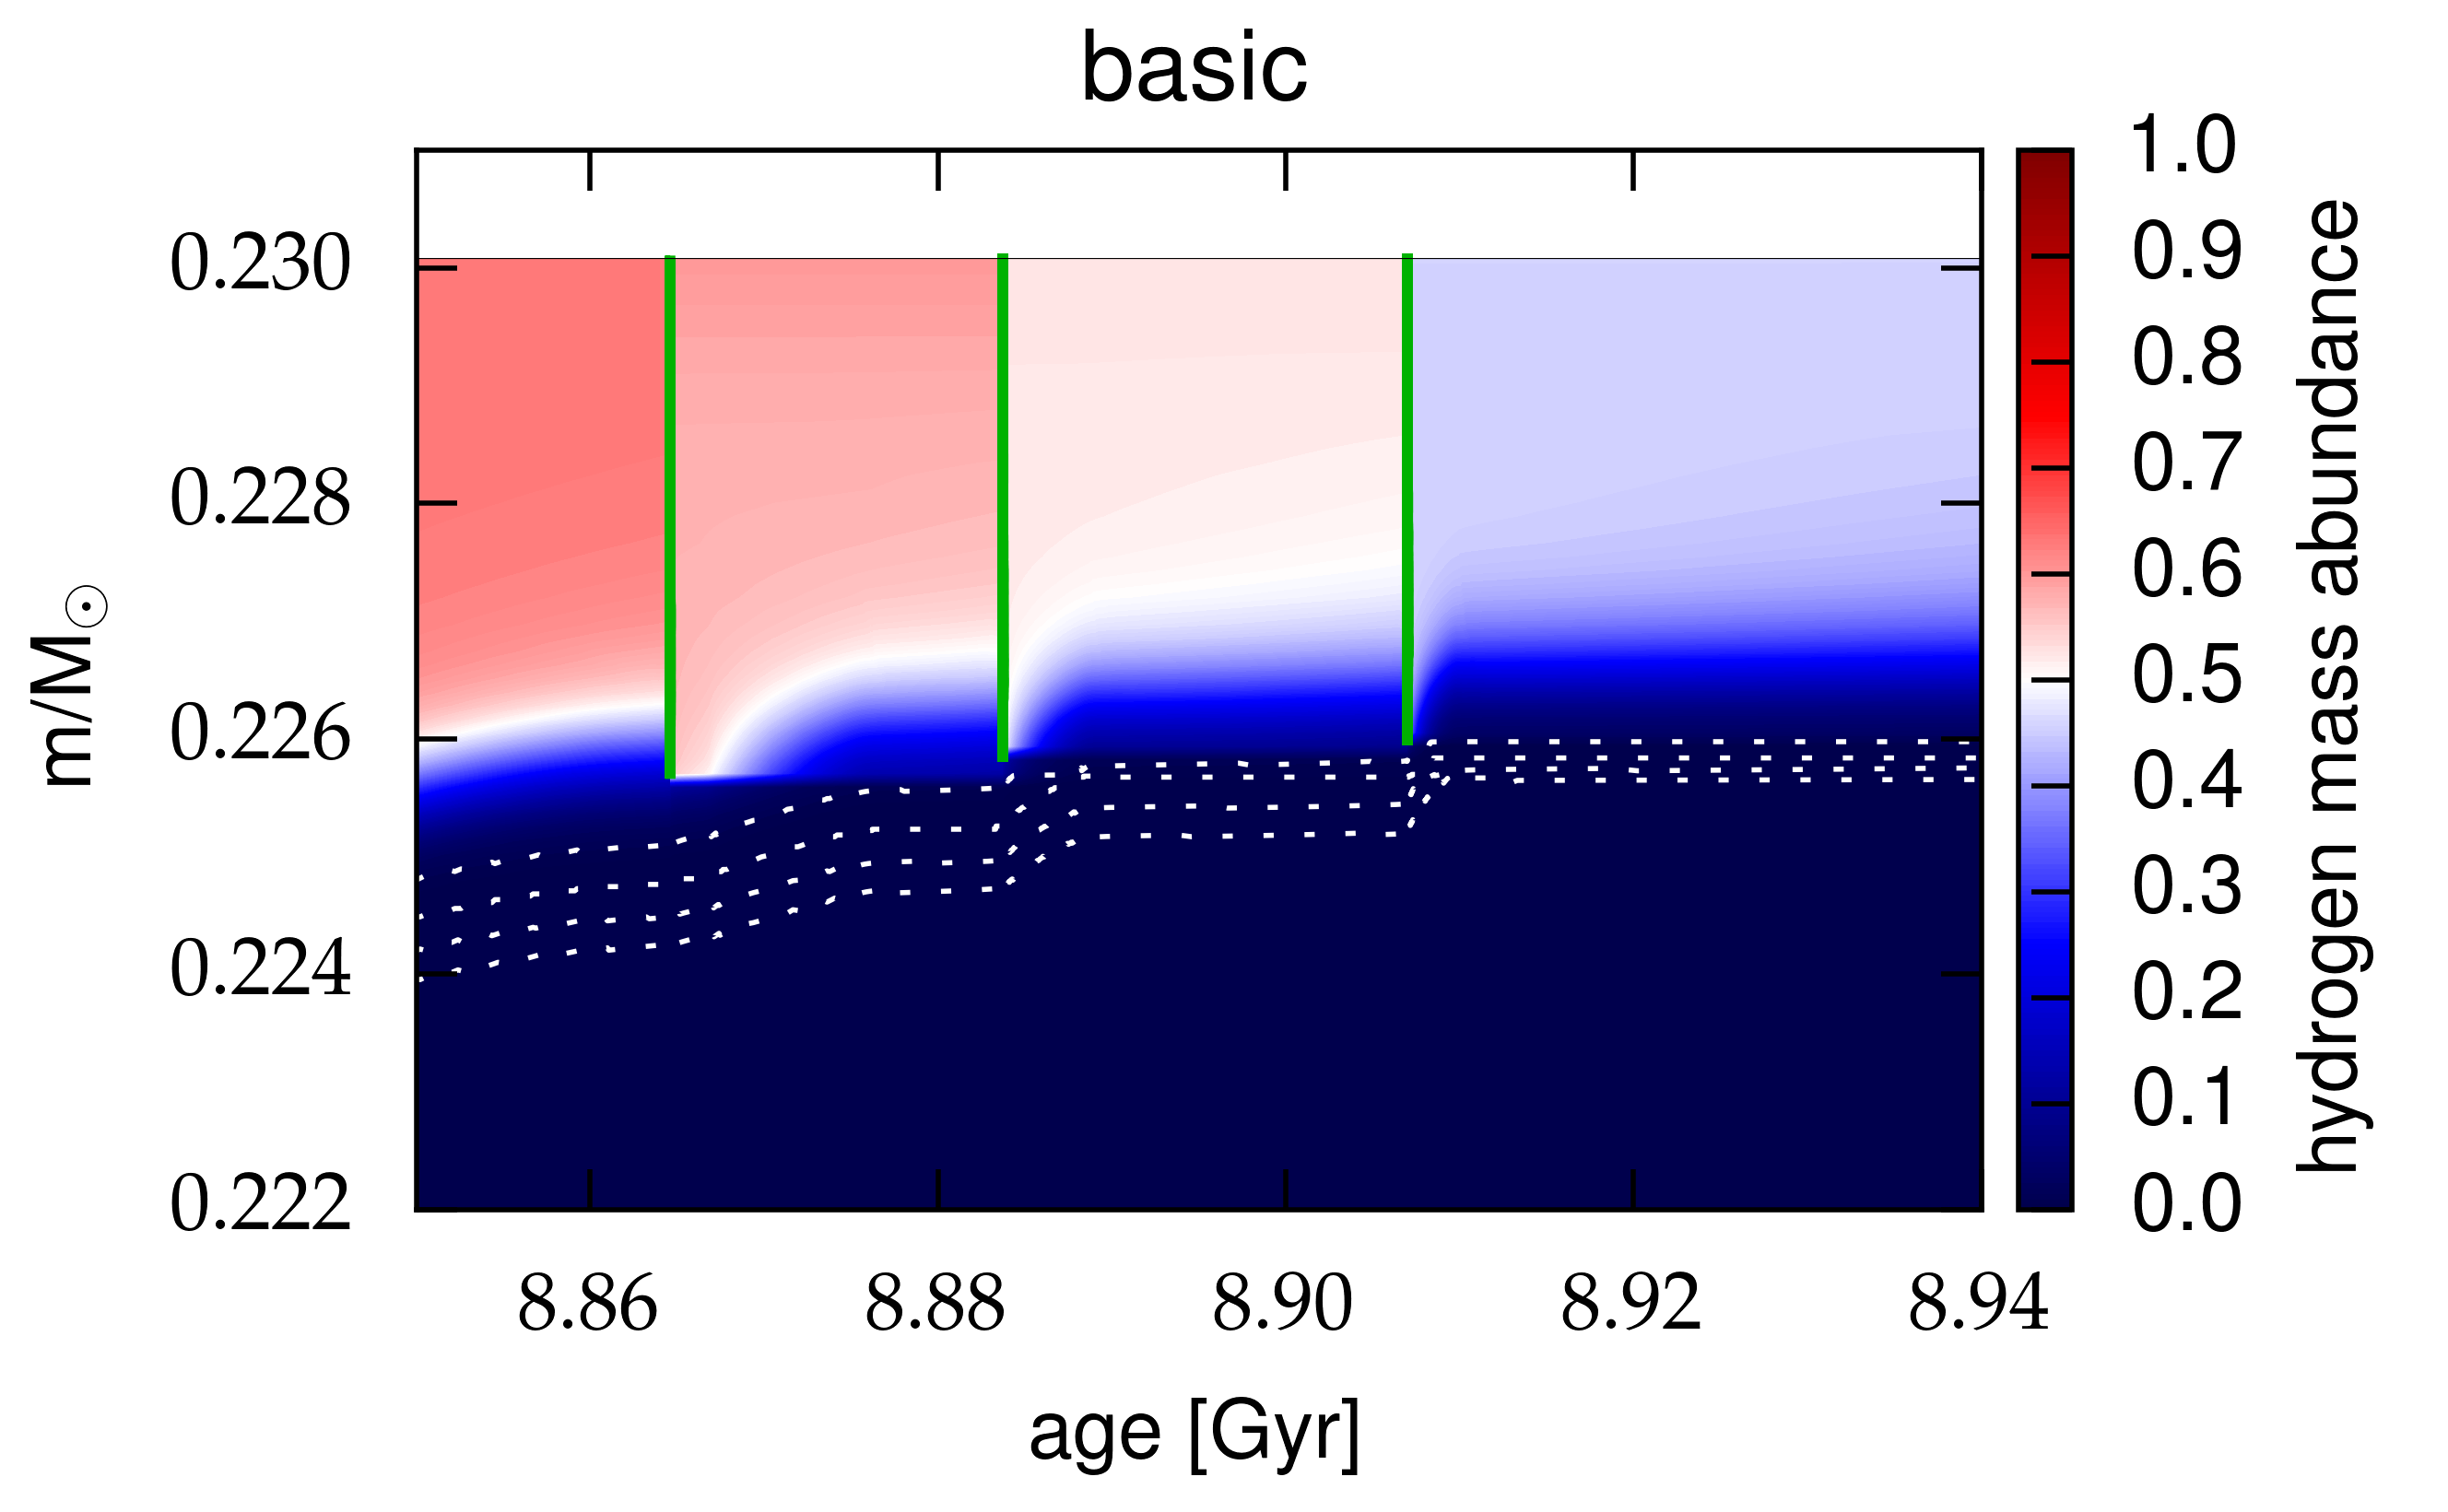
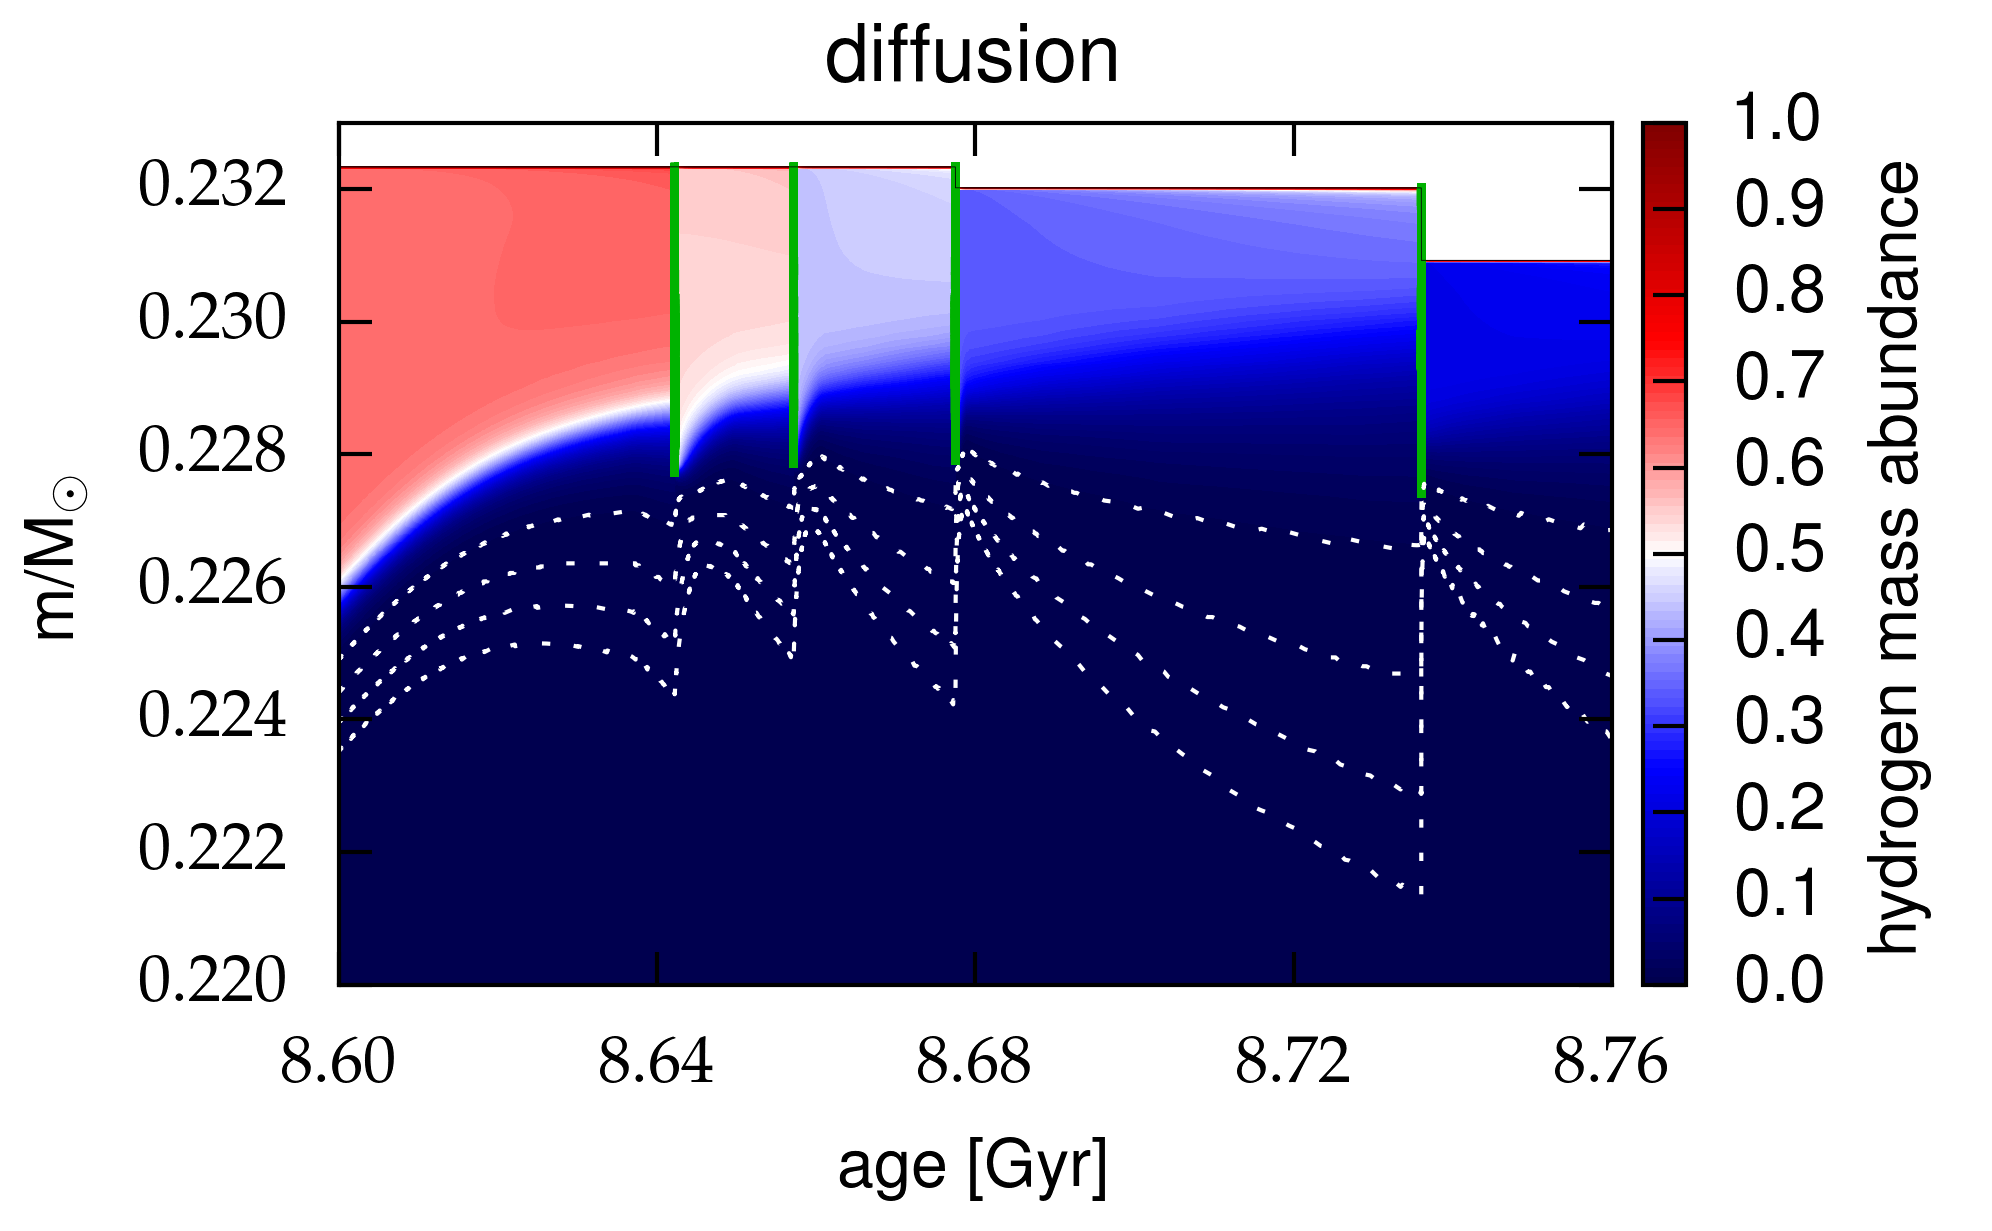
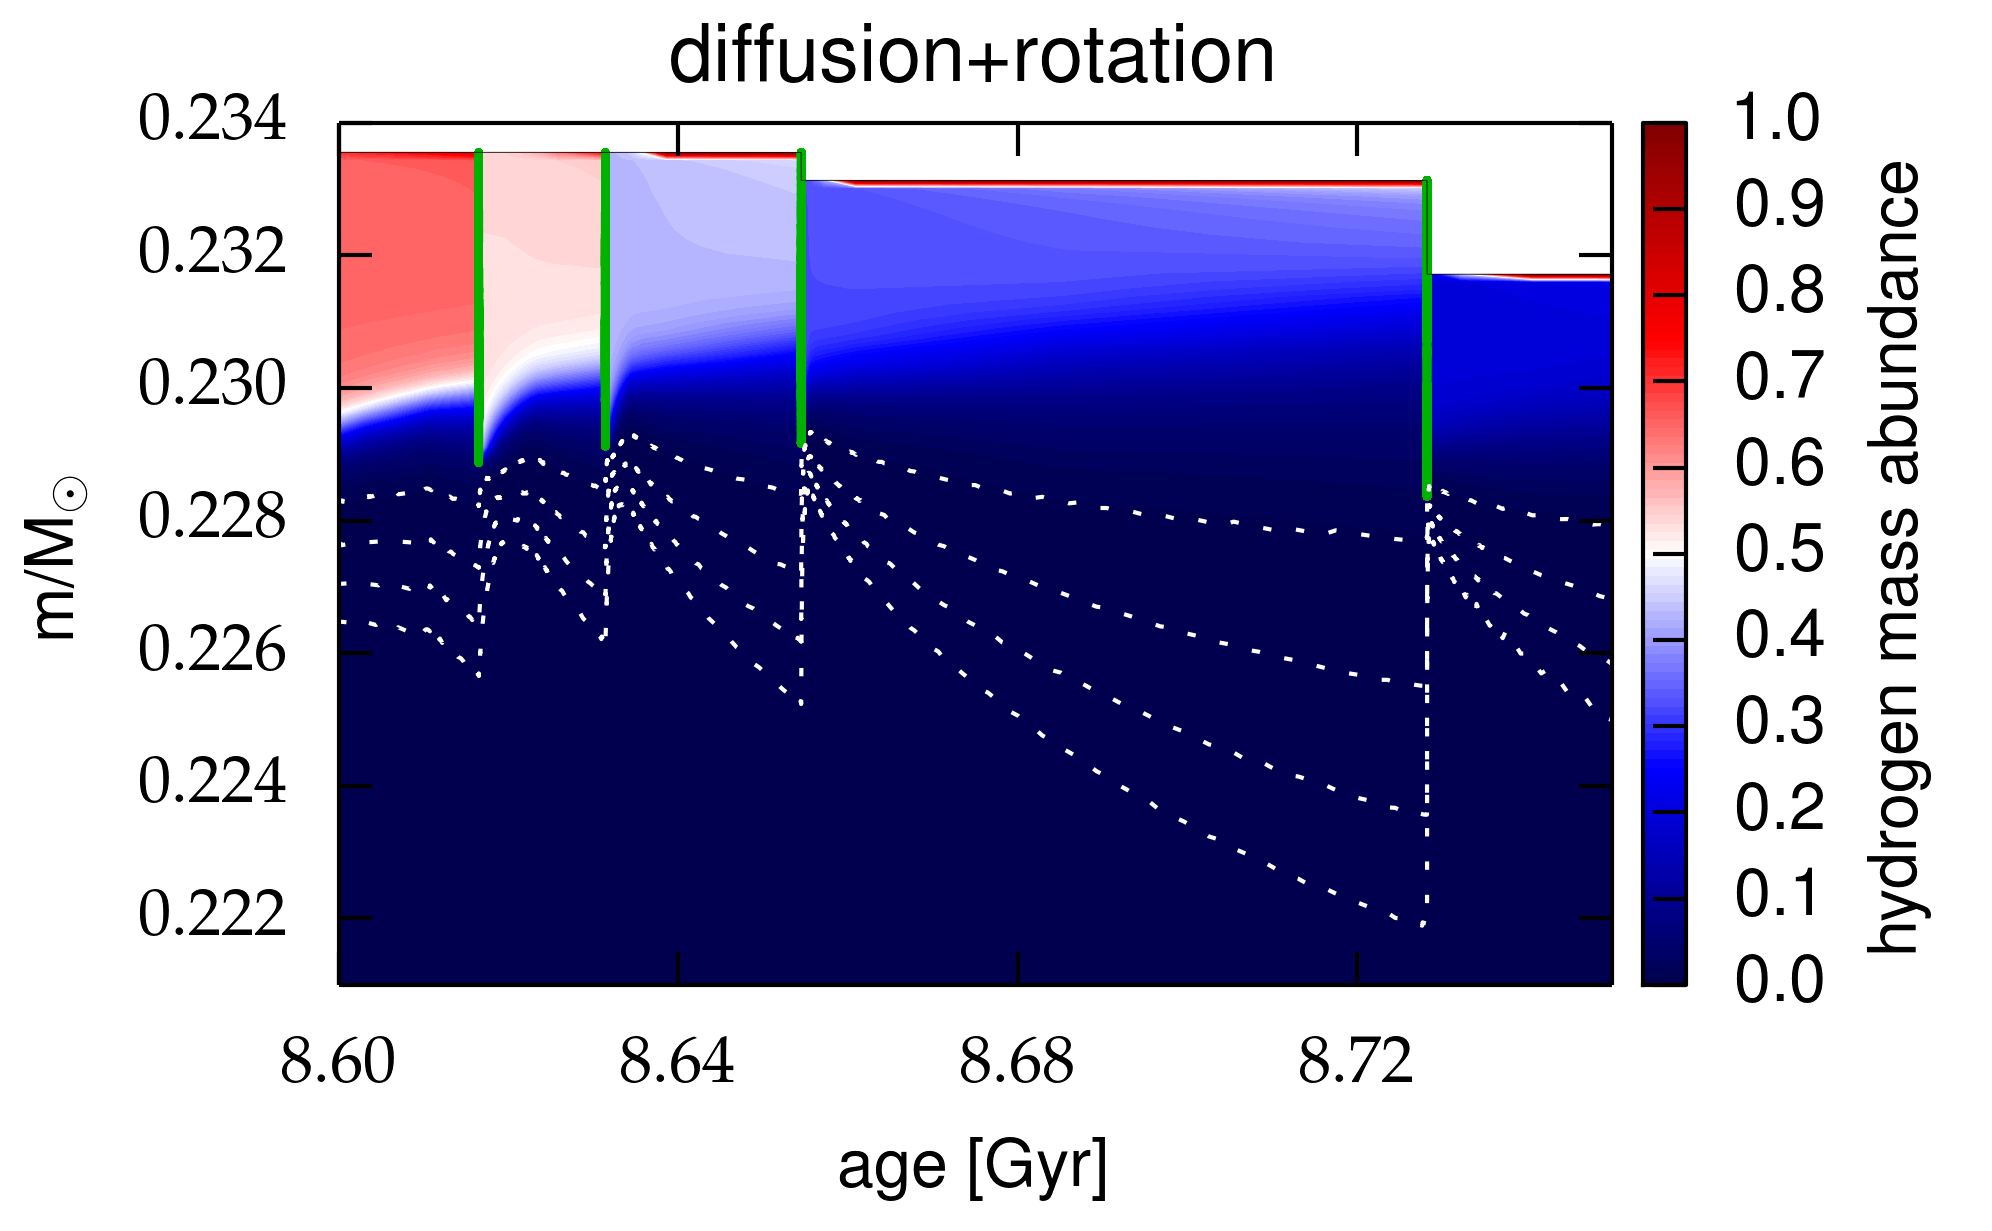
Fig. 4
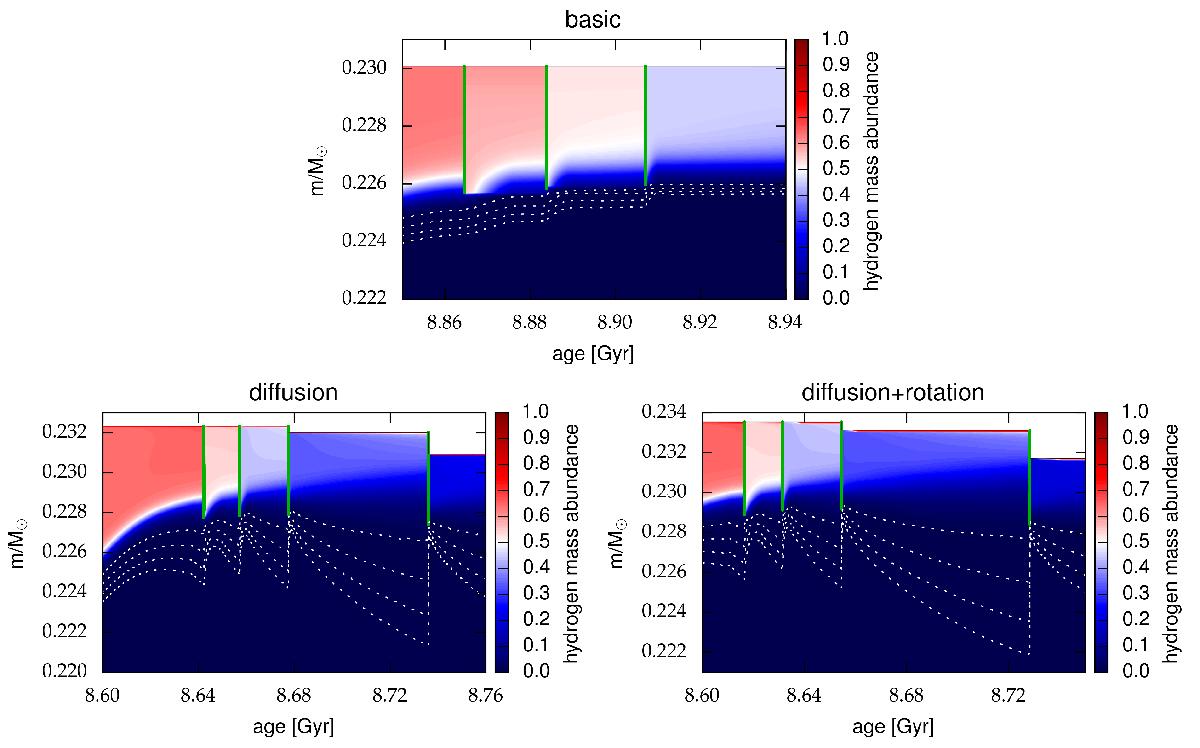
Kippenhahn diagrams showing the proto-WD phase for the same systems as in Fig. 2. The plots show cross sections of the outer ~ 0.01 M⊙ envelope of the proto-WD in mass coordinates, along the y-axis, as a function of stellar age on the x-axis (relative to the ZAMS age). The green areas denote zones with convection; the dotted white lines define lines of constant hydrogen abundance, 10-2 to 10-5 (from top to bottom). The intensity of the blue and red colour indicates the hydrogen abundance by mass fraction, as shown on the colour scale to the right. As a result of different input physics, the proto-WDs have slightly different masses and ages. See text for details.
Current usage metrics show cumulative count of Article Views (full-text article views including HTML views, PDF and ePub downloads, according to the available data) and Abstracts Views on Vision4Press platform.
Data correspond to usage on the plateform after 2015. The current usage metrics is available 48-96 hours after online publication and is updated daily on week days.
Initial download of the metrics may take a while.