Fig. 16
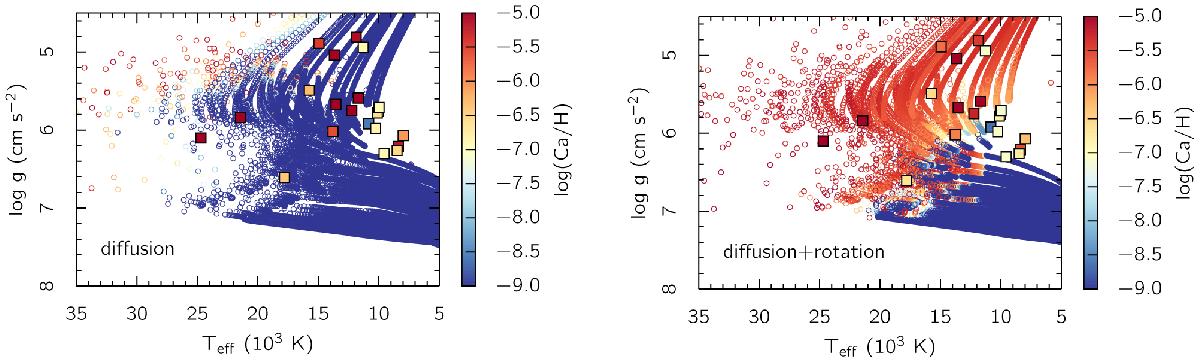
Surface gravity versus effective temperature for the models with diffusion only (left panel), and diffusion+rotation (right panel), both calculated for a metallicity of Z = 0.02. Each evolutionary track is plotted as a dot at 0.5 Myr intervals and colour-coded according to the value of log (Ca/H) at the stellar surface. The over-plotted squares are the observed (proto)WDs with measured Ca abundances taken from Gianninas et al. (2014a).
Current usage metrics show cumulative count of Article Views (full-text article views including HTML views, PDF and ePub downloads, according to the available data) and Abstracts Views on Vision4Press platform.
Data correspond to usage on the plateform after 2015. The current usage metrics is available 48-96 hours after online publication and is updated daily on week days.
Initial download of the metrics may take a while.