Free Access
Fig. 5
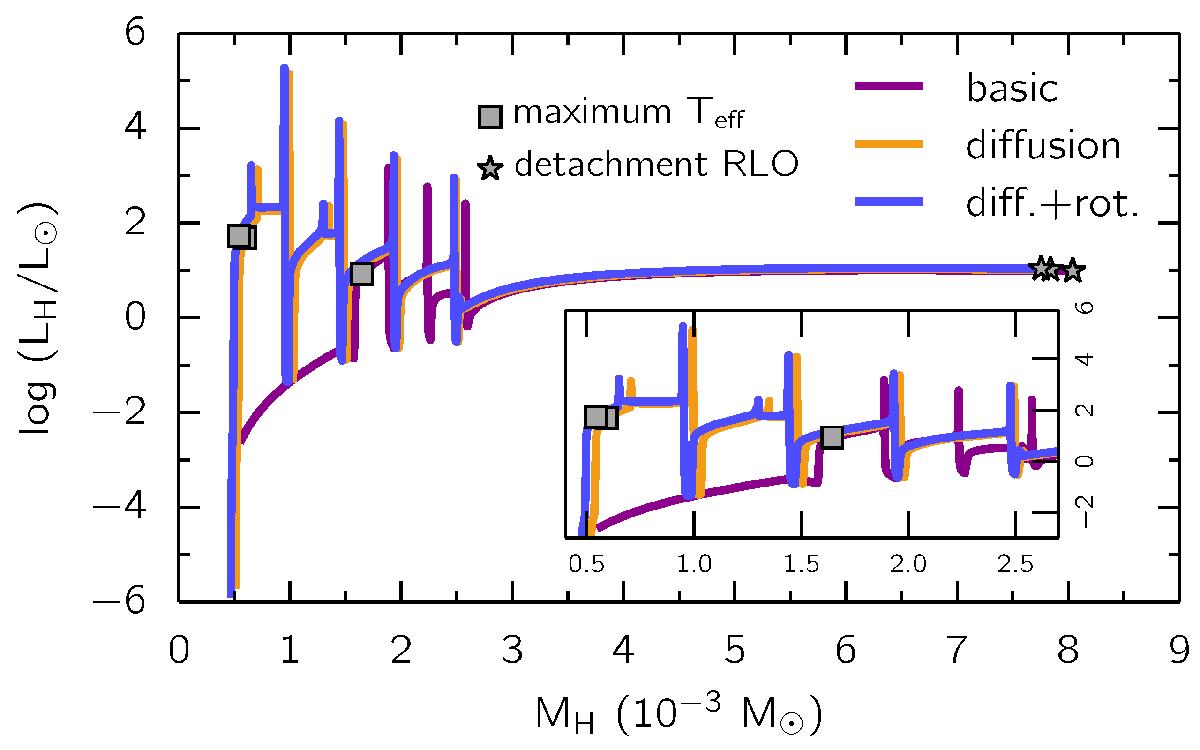
Hydrogen burning luminosity versus hydrogen envelope mass, for the same systems as in Fig. 2. The grey stars represent the moment of Roche-lobe detachment while the grey squares denote the point of maximum effective surface temperature. The evolution is from the right to the left.
Current usage metrics show cumulative count of Article Views (full-text article views including HTML views, PDF and ePub downloads, according to the available data) and Abstracts Views on Vision4Press platform.
Data correspond to usage on the plateform after 2015. The current usage metrics is available 48-96 hours after online publication and is updated daily on week days.
Initial download of the metrics may take a while.