Fig. 7
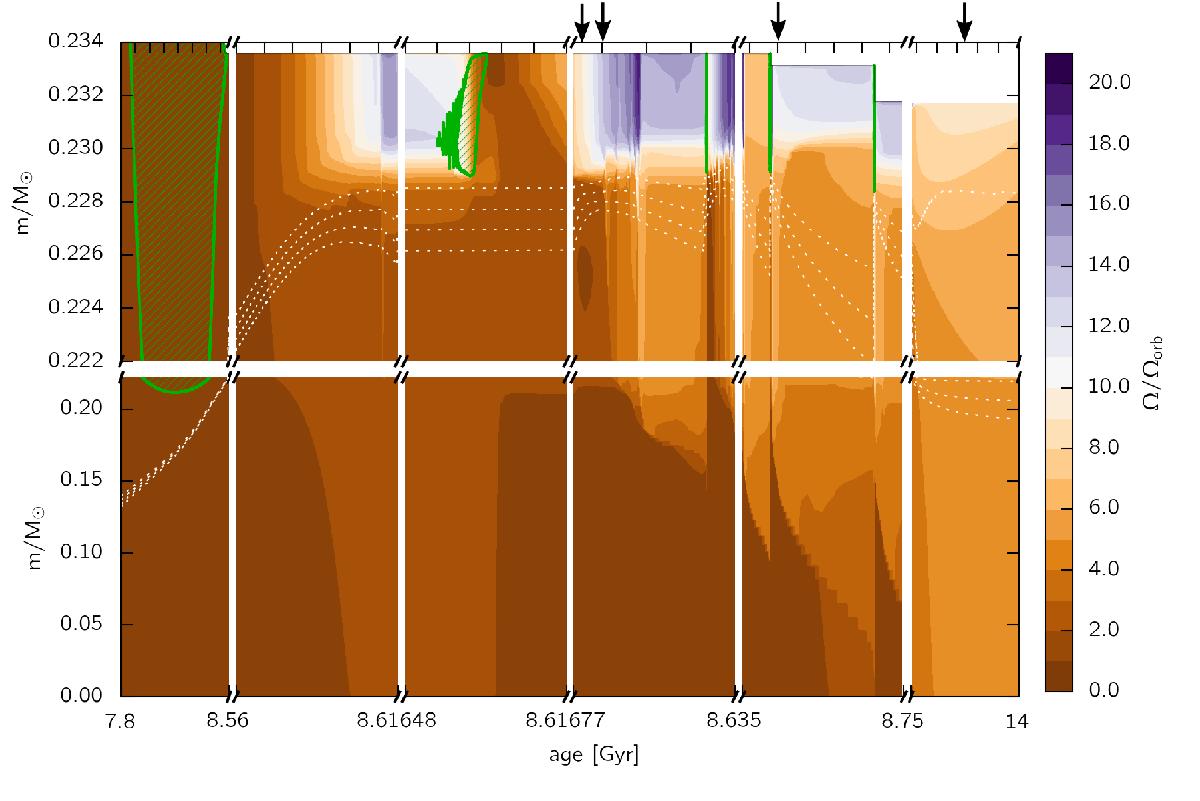
Kippenhahn diagram for the same proto-WD as in Fig. 4, including both element diffusion and rotational mixing. The intensity of the orange and indigo colour indicates the ratio of the spin angular velocity to the orbital angular velocity, Ω/Ωorb, as shown on the colour scale to the right. The green areas and the dotted white lines have the same meaning as in Fig. 4. The black arrows point to the position of the profiles in Fig. 8.
Current usage metrics show cumulative count of Article Views (full-text article views including HTML views, PDF and ePub downloads, according to the available data) and Abstracts Views on Vision4Press platform.
Data correspond to usage on the plateform after 2015. The current usage metrics is available 48-96 hours after online publication and is updated daily on week days.
Initial download of the metrics may take a while.