Free Access
Fig. 9
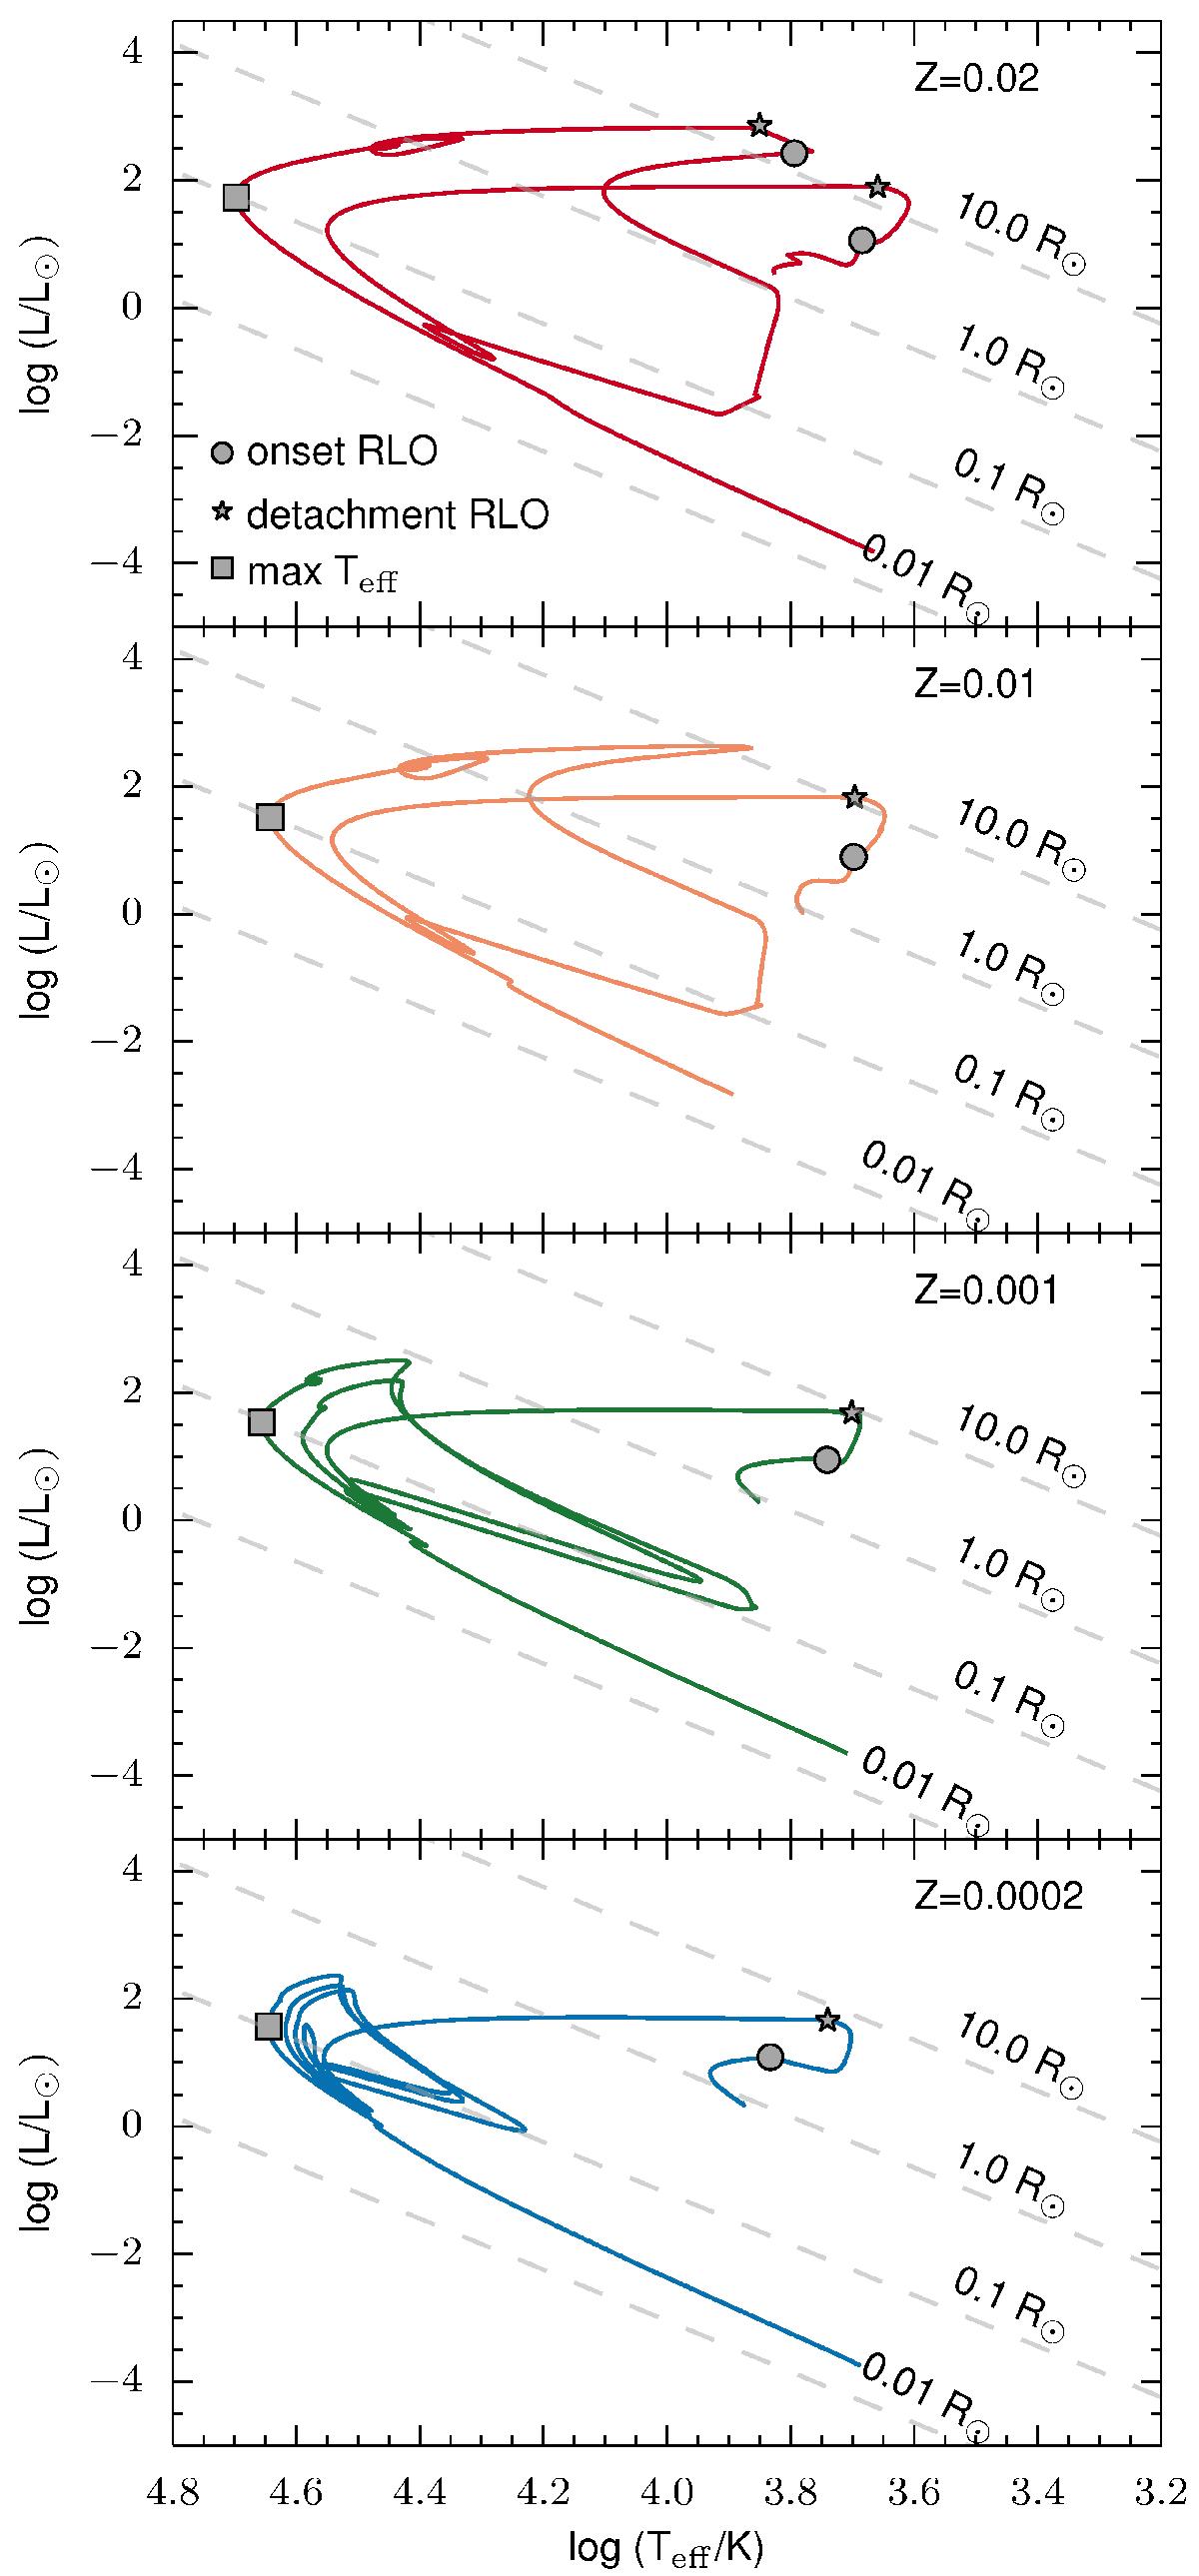
HR-diagram showing the formation and evolution of a ~ 0.28 M⊙ WD from progenitors with different metallicities. The grey symbols represent the beginning of RLO (circles), the end of RLO (stars) and the maximum Teff (squares). The grey dashed lines represent lines of constant radius.
Current usage metrics show cumulative count of Article Views (full-text article views including HTML views, PDF and ePub downloads, according to the available data) and Abstracts Views on Vision4Press platform.
Data correspond to usage on the plateform after 2015. The current usage metrics is available 48-96 hours after online publication and is updated daily on week days.
Initial download of the metrics may take a while.