Fig. 18
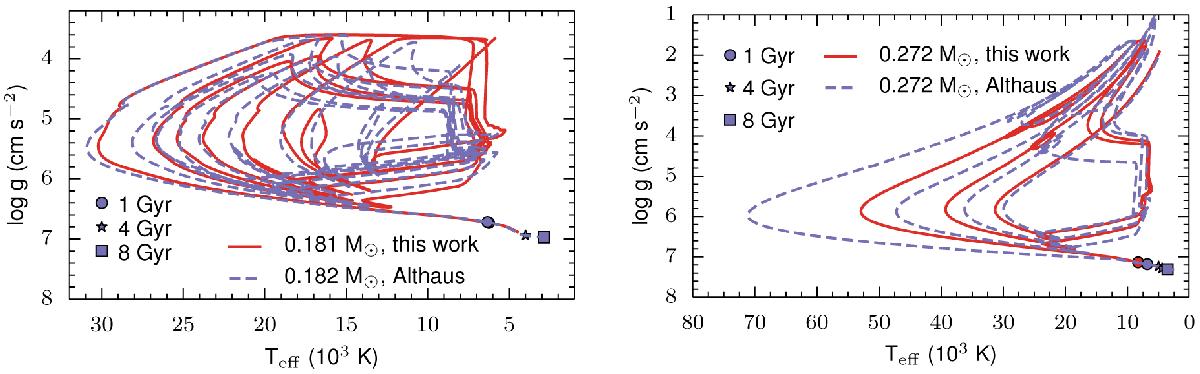
Evolutionary tracks in the (Teff,log g)-diagram for the same models as in Fig. 17. The circles, stars, and squares indicate cooling ages of 1, 4, and 8 Gyr, respectively. For the 0.18 M⊙ WD, the 1 Gyr symbols for the two models almost coincide. Moreover, we note that the models from this work are only calculated to an age of 14 Gyr, which prevents cooling ages exceeding 3 Gyr for the 0.18 M⊙ model and 6 Gyr for the 0.27 M⊙ model.
Current usage metrics show cumulative count of Article Views (full-text article views including HTML views, PDF and ePub downloads, according to the available data) and Abstracts Views on Vision4Press platform.
Data correspond to usage on the plateform after 2015. The current usage metrics is available 48-96 hours after online publication and is updated daily on week days.
Initial download of the metrics may take a while.