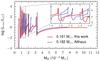
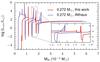
Fig. 17

Comparison of evolutionary tracks of Althaus et al. (2013) and this work (including diffusion only) for a ~ 0.18 M⊙ WD (left panel) and ~ 0.27 M⊙ WD (right panel). The post-RLO evolution of luminosity, given by CNO burning, is plotted as a function of the hydrogen envelope mass. Time goes from right to left. The inset shows an artefact of hydrogen production during the shell flashes in the Althaus et al. (2013) models, see text.
Current usage metrics show cumulative count of Article Views (full-text article views including HTML views, PDF and ePub downloads, according to the available data) and Abstracts Views on Vision4Press platform.
Data correspond to usage on the plateform after 2015. The current usage metrics is available 48-96 hours after online publication and is updated daily on week days.
Initial download of the metrics may take a while.