| Issue |
A&A
Volume 549, January 2013
|
|
|---|---|---|
| Article Number | A15 | |
| Number of page(s) | 17 | |
| Section | Interstellar and circumstellar matter | |
| DOI | https://doi.org/10.1051/0004-6361/201118528 | |
| Published online | 07 December 2012 | |
Young stars in ϵ Chamaleontis and their disks: disk evolution in sparse associations⋆
1
Max-Planck Institute for Astronomy, Königstuhl 17, 69117
Heidelberg,
Germany
e-mail: This email address is being protected from spambots. You need JavaScript enabled to view it.
2
Purple Mountain Observatory and Key Laboratory for Radio
Astronomy, 2 West Beijing Road,
210008
Nanjing, PR
China
3
School of Physical, Environmental & Mathematical Sciences,
University of New South Wales, Canberra
ACT
2600,
Australia
4
Departamento de Física Teórica, Universidad Autónoma de
Madrid, Cantoblanco
28049, Madrid,
Spain
Received:
27
November
2011
Accepted:
25
September
2012
Abstract
Context. The nearby young stellar association ϵ Cha has an estimated age of 3–5 Myr, making it an ideal laboratory to study the disk dissipation process and provide empirical constraints on the timescale of planet formation.
Aims. We wish to complement existing optical and near-infrared data of the ϵ Cha association, which provide the stellar properties of its members, with mid-infrared data that probe the presence, geometry, and mineralogical composition of protoplanetary disks around individual stars.
Methods. We combine the available literature data with our Spitzer/IRS spectroscopy and VLT/VISIR imaging data. We use proper motions to refine the membership of ϵ Cha. Masses and ages of individual stars are estimated by fitting model atmospheres to the optical and near-infrared photometry, followed by placement in the Hertzsprung-Russell diagram. The Spitzer/IRS spectra are analyzed using the two-layer temperature distribution spectral decomposition method.
Results. Two stars previously identified as members, CXOU J120152.8 and 2MASS J12074597, have proper motions that are very different from those of the other stars. But other observations suggest that the two stars are still young and thus might still be related to ϵ Cha. HD 104237C is the lowest mass member of ϵ Cha with an estimated mass of ~13–15 Jupiter masses. The very low mass stars USNO-B120144.7 and 2MASS J12005517 show globally depleted spectral energy distributions, pointing at strong dust settling. 2MASS J12014343 may have a disk with a very specific inclination, where the central star is effectively screened by the cold outer parts of a flared disk, but the 10 μm radiation of the warm inner disk can still reach us. We find that the disks in sparse stellar associations are dissipated more slowly than those in denser (cluster) environments. We detect C2H2 rovibrational band around 13.7 μm on the IRS spectrum of USNO-B120144.7. We find strong signatures of grain growth and crystallization in all ϵ Cha members with 10 μm features detected in their IRS spectra. We combine the dust properties derived in the ϵ Cha sample with those found using identical or similar methods in the MBM 12, Coronet, η Cha associations, and in the cores-to-disks legacy program. We find that disks around low-mass young stars show a negative radial gradient in the mass-averaged grain size and mass fraction of crystalline silicates. A positive correlation exists between the mass-averaged grain sizes of amorphous silicates and the accretion rates if the latter is above ~10-9 M⊙ yr-1, possibly indicating that those disks are sufficiently turbulent to prevent grains of several microns in size to sink into the disk interior.
Key words: open clusters and associations: individual:ϵChamaleontis / stars: pre-main sequence / protoplanetary disks
Based on observations performed at ESO’s La Silla-Paranal observatory under programme 076.C-0470.
© ESO, 2012
Optical and near-infrared photometry for members in the ϵ Cha association.
1. Introduction
The observational characterization of the structure and evolution of circumstellar disks is key to our understanding of the disk dissipation and planet formation processes. Nearby pre-main sequence (PMS) associations at ~50–300 pc are well suited for detailed investigations of young stars and their disks, since their members can be observed with high signal-to-noise ratio (S/N) throughout the electromagnetic spectrum. Several PMS associations have been studied with the Spitzer Space Telescope, e.g., MBM 12, ϵ Cha, and η Cha (Meeus et al. 2009; Megeath et al. 2005; Bouwman et al. 2006; Sicilia-Aguilar et al. 2009) using the infrared array camera (IRAC, Fazio et al. 2004), the multiband imaging photometer for Spitzer (MIPS, Rieke et al. 2004), and the infrared spectrograph (IRS, Houck et al. 2004). The Spitzer data allow characterization of the disks around low-mass stars up to radii of ~10 AU. The observed disk frequencies in the MBM 12 and η Cha associations suggest that disk dissipation proceeds more slowly in these sparse PMS associations compared to denser environments (see, e.g., Fang et al. 2012a). MBM 12 has a disk frequency of ≈ 67% at an age of 2 Myr (Meeus et al. 2009), while in the 5–10 Myr old η Cha association, 40–50% of the stars still retain a disk (Mamajek et al. 1999; Megeath et al. 2005; Sicilia-Aguilar et al. 2009). In the latter cluster, binarity was shown to play an important role in protoplanetary disk evolution (Bouwman et al. 2006).
Silicates are an important dust component in protoplanetary disks. The most convincing evidence that silicates are present in the protoplanetary disks is the strong “10 μm feature” in mid-infrared spectra of Herbig Ae/Be and T Tauri stars (Cohen & Witteborn 1985; Natta et al. 2000; Bouwman et al. 2001, 2003; van Boekel et al. 2004; van Boekel et al. 2005). This feature is emitted by silicate grains with sizes of up to several microns that reside in the optically thin surface layers of the disk (Men’shchikov & Henning 1997; Chiang & Goldreich 1997). The shape and the strength of the 10 μm silicate feature were found to be correlated and this was interpreted as evidence for grain growth in disks (van Boekel et al. 2005; Kessler-Silacci et al. 2006; Bouwman et al. 2008). The Spitzer/IRS has provided spectra of many young objects, covering the wavelength range from 5.3 to 38 μm. Analysis of the spectral features in the Spitzer/IRS spectra provides constraints on the chemical composition and grain sizes (see, e.g., Henning 2010, for a recent review). The dust properties derived from Spitzer/IRS spectra of the members of the MBM 12 and η Cha associations suggest that dust processing in the disks occurs very early and that radial mixing is not efficient (Meeus et al. 2009; Sicilia-Aguilar et al. 2009).
Because the η Cha association is much older than MBM 12, it is highly
desirable to study an association at an intermediate age in order to draw a more complete
picture of disk evolution in sparse stellar associations. With an estimated age of 3–5 Myr
(Feigelson et al. 2003), the ϵ Cha
association is well suited for this purpose. Located at a distance of ~114 pc, the
ϵ Cha association was discovered by Feigelson et al. (2003), who identified nine members. The most massive member,
ϵ Cha AB, has a spectral type of B9. Luhman (2004) found three new members of ϵ Cha from a survey
covering a region with a radius of 0 5 around ϵ Cha AB. At
3–5 Myr, the ϵ Cha association is younger than the η Cha
group (5–10 Myr, Mamajek et al. 1999; Luhman & Steeghs 2004). Lawson et al. (2009) provide a model-independent way to rank the ages of
the nearest PMS associations by employing gravity-sensitive spectral features in optical
spectra. They confirmed that the ϵ Cha association is younger than the
η Cha and TW Hya associations.
5 around ϵ Cha AB. At
3–5 Myr, the ϵ Cha association is younger than the η Cha
group (5–10 Myr, Mamajek et al. 1999; Luhman & Steeghs 2004). Lawson et al. (2009) provide a model-independent way to rank the ages of
the nearest PMS associations by employing gravity-sensitive spectral features in optical
spectra. They confirmed that the ϵ Cha association is younger than the
η Cha and TW Hya associations.
In this paper, we will investigate the disks surrounding the ϵ Cha members in terms of overall (geometry) evolution and dust mineralogy. We arrange this paper as follows. In Sect. 2, we describe the observations and data reduction. In Sect. 3 we present our results, which are then discussed. We summarize our efforts in Sect. 4.
2. Observations, data reduction, and analysis
2.1. Targets
There are 12 stars reported as the members of ϵ Cha in the literature (Feigelson et al. 2003; Luhman 2004). We collected the photometric and spectroscopic data of these stars that are available in the literature and list these in Tables 1–3. For the ten stars whose spectral types have been estimated, we performed spectral energy distribution (SED) fits in the optical and near-infrared spectral range to derive the luminosity of each star and its line-of-sight extinction, using the method described in Fang et al. (2009). We take a model atmosphere spectrum with a fixed effective temperature corresponding to the observed spectral type and generate synthetic photometry with two free parameters: the visual extinction AV and the stellar angular diameter θ. Both fit parameters are fine tuned to minimize the residuals between synthetic and observed optical and near-infrared photometry. We adopt a standard extinction law (Cardelli et al. 1989) with a total-to-selective extinction ratio of RV = 3.1. We used all the available optical photometry and the near-infrared J- and H-band photometry. The bolometric luminosity of each star is then obtained by integrating the de-reddened model spectrum and adopting a distance of 114 pc. For the ϵ Cha AB, which is a double system, we estimate the luminosity of the A component from its V-band magnitude (5.34 mag, Torres et al. 2008), which was corrected for binarity. The resulting extinctions and luminosities are listed in Table 3.
Infrared photometry for members in the ϵ Cha association.
Stellar parameters for members in the ϵ Cha association.
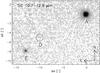 |
Fig. 1 VLT/VISIR image of the HD 104237 region taken through the SIC filter, on a square root scaling from –0.1% to +6.5% of the peak flux of the HD 104237A component. The position of the HD 104237D component is indicated with a circle, but there is no significant detection of this source. Coordinates are offsets in arcseconds with respect to HD 104237A. |
2.2. VISIR imaging
In the ϵ Cha association, four sources (HD 104237B-E) are located too
close to the bright star HD 104237A to be properly resolved with the Spitzer
telescope. To characterize the disk properties of these sources, we observed them
with the VLT imager and spectrometer for mid-infrared (VISIR) on the night of
2006 March 17 through the SiC filter, which transmits radiation between ~10.7 and
~12.9 μm. We employed standard chopping and nodding techniques to
eliminate high instrumental and atmospheric background emission, with a chop throw of 8′′
in the north-south direction and a nod throw of 8′′ in the east-west direction. We
assessed the quality of the individual chop half-cycles (here referred to as “frames”) by
fitting a 2D Gaussian function to the A component, which is detected at high S/N in each
frame. We find that the quality of most frames is good, meaning the image of the A
component is sharp and round. The median full width at half maximum of the 75% best frames
is 0 33, and we shift-and-add these into our
final image with sub-pixel accuracy, using shifts determined by cross correlation.
33, and we shift-and-add these into our
final image with sub-pixel accuracy, using shifts determined by cross correlation.
In Fig. 1, we show our final VISIR image of the HD 104237 system. The A and E components, corresponding to sources 3 and 6 in Grady et al. (2004), respectively, are clearly detected. No sources are seen at the positions of the C and D components (source numbers 1 and 5 in Grady et al. 2004). We did not attempt an absolute flux calibration of our VISIR data, but instead performed point-spread function photometry on the E component, using the A component as the reference star. We find an A/E flux ratio of 23.4 ± 0.4. To set the absolute flux scale, we integrated the Spitzer spectrum of the A component over the transmission curve of the SIC filter. Assuming that the spectrum of the E component is iso-photonic, one obtains a flux of 551 ± 10 mJy at 12 μm for this source. At the position of the D component, we do not detect a source with confidence and derive a 3σ upper limit of 18 mJy at 12 μm, again assuming an iso-photonic spectrum.
2.3. Spitzer/IRS spectroscopy
The ϵ Cha members were observed with the Spitzer Space Telescope as part of a large program aimed at studying the evolution of circumstellar disks in nearby associations (GO proposal 20691, PI: Bouwman). We obtained 7–35 μm low-resolution (R = 60–120) spectra with the IRS. The extracted spectra are based on the droopres products processed through the S18.7.0 version of the Spitzer data pipeline. Partially based on the SMART software package (Higdon et al. 2004), our data were further processed using spectral extraction tools developed by the Formation and Evolution of Planetary Systems (FEPS) Spitzer science legacy team (see also Bouwman et al. 2008). The spectra were extracted using a 6.0 pixel and 5.0 pixel fixed-width aperture in the spatial dimension for observations with the first order of the short- (7.5−14 μm) and the long-wavelength (14−35 μm) modules, respectively. The background was subtracted using associated pairs of imaged spectra from the two nod positions along the slit, also eliminating stray light contamination and anomalous dark currents. Pixels tagged by the data pipeline as being “bad” were replaced with a value interpolated from an 8-pixel perimeter surrounding the errant pixel. Low-level fringing at wavelengths >20 μm was removed using the irsfinge package (Lahuis & Boogert 2003). To remove any effect of pointing offsets, we matched orders based on the point-spread function of the IRS instrument, thereby correcting for possible flux losses. The spectra are calibrated using a spectral response function derived from multiple IRS spectra of the calibration star η1 Doradus and a MARCS stellar model provided by the Spitzer Science Center. The spectra of the calibration target were extracted in the same way as our science targets. The relative errors between spectral channels within one order are dominated by the noise in each channel and not by the calibration. We estimate the relative flux calibration within a spectral order to be good to ≈ 1% and the absolute calibration between different orders to be accurate to ≈ 3%, the uncertainty being dominated by uncertainties in the scaling of the MARCS model.
We use the two-layer temperature distribution (TLTD) spectral decomposition routines
developed by Juhász et al. (2009, 2010) to derive the mineralogical composition of the
dust from the observed IRS spectra. The TLTD method is applicable to disks at most
inclinations but does not work well for objects with a near edge-on inclination (Juhász et al. 2009). Hence, we can apply it to all
sources in this survey, with the exception of 2MASS J12014343 (see Sect. 3.2.3). The spectrum emitted by the optically thin
surface layers of the disk is approximated by the expression
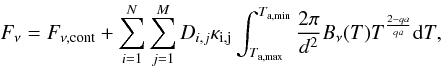 (1)where the different dust species in the model
are denoted with subscripts i; for each species, we include different
grain sizes, indicated with j subscripts.
κi,j denotes the mass absorption
coefficient of dust species i with grain size j. The
abundances of each dust component are indicated by
Di,j, while
Bν(T) denotes the Planck
function and qa represents the exponent of the adopted power-law
temperature distribution. The disk atmosphere has a range of temperatures between the
integration boundaries Ta, and d denotes the
distance between the star and Earth. Fν,cont
denotes the continuum flux from the optically thick disk interior and is approximated by
(1)where the different dust species in the model
are denoted with subscripts i; for each species, we include different
grain sizes, indicated with j subscripts.
κi,j denotes the mass absorption
coefficient of dust species i with grain size j. The
abundances of each dust component are indicated by
Di,j, while
Bν(T) denotes the Planck
function and qa represents the exponent of the adopted power-law
temperature distribution. The disk atmosphere has a range of temperatures between the
integration boundaries Ta, and d denotes the
distance between the star and Earth. Fν,cont
denotes the continuum flux from the optically thick disk interior and is approximated by
 (2)Here
R ⋆ and
T ⋆ are the radius and effective
temperature of the star. The optically thick inner rim and midplane of the disk are
assumed to have power-law temperature distributions between the
Tr and Tm boundaries, with
exponents denoted by qr and qm. The
D0, D1, and
D2 parameters denote scaling factors for the emission from
the stellar photosphere, the hot inner rim, and the disk midplane, respectively.
(2)Here
R ⋆ and
T ⋆ are the radius and effective
temperature of the star. The optically thick inner rim and midplane of the disk are
assumed to have power-law temperature distributions between the
Tr and Tm boundaries, with
exponents denoted by qr and qm. The
D0, D1, and
D2 parameters denote scaling factors for the emission from
the stellar photosphere, the hot inner rim, and the disk midplane, respectively.
Our dust model includes amorphous silicates with olivine and pyroxene stoichiometry, crystalline silicates forsterite, enstatite, and amorphous silica. For each amorphous species, we include three grain sizes with radii of 0.1, 1.5, and 6.0 μm, and for each crystalline species we include only two grain sizes with radii of 0.1 and 1.5 μm, since there was no evidence for large crystals (6.0 μm) in our data. The opacity curves for the amorphous species were calculated using MIE theory, and those for the crystalline species were derived using a distribution of hollow spheres (DHS) approximation (Juhász et al. 2009). The optical constants were taken from Servoin & Piriou (1973) for forsterite, Dorschner et al. (1995) for amorphous silicate with olivine and pyroxene stoichiometry, Henning & Mutschke (1997) for silica, and Jäger et al. (1998) for enstatite. To estimate the uncertainties in the derived abundances, the TLTD routines apply a simple and well-established Monte Carlo technique. The TLTD routines add normally distributed noise to the observed spectra with an amplitude given by the flux uncertainty in each spectral channel, thereby generating 100 versions of each spectrum that are all consistent with the data. For each of these spectra, the TLTD routines then perform the same compositional fit as described above, yielding 100 values for each fit parameter. The mean is then adopted as the best-fit value for each parameter, and the standard deviation in the positive and negative directions yields the 1 σ uncertainty on each parameter. The fit results will be presented and discussed in Sect. 3.2.5.
3. Results and discussion
3.1. Stellar properties
In this section, we will first confirm the memberships of the ϵ Cha stars using proper motion data and then estimate the masses and ages of the members.
3.1.1. Proper motions
 |
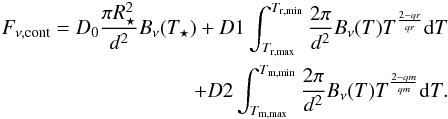
Fig. 2 Proper motions of known stars in the ϵ Cha association taken from the catalog by Röser et al. (2010). The mean proper motion of the members and the 1 and 2σ ellipses of the standard deviation of the distribution are shown with dashed-line and dotted-line curves, respectively. |
Proper motions provide kinematic information of stars, which is often a very useful discriminant to separate members of a cluster or stellar association from unrelated field objects (see, e.g., Rochau et al. 2010). Recently, Röser et al. (2010) presented a new catalog of proper motions based on the International Celestial Reference System (ICRS) using a combination of USNO-B1.0 and 2MASS astrometry. This catalog provides proper motions of eight ϵ Cha members, which are shown in Fig. 2 and listed in Table 3. It is clear that most stars have very similar proper motions, with the exception of the stars ID#9 and 12, which move in different directions. We calculate the weighted mean of the proper motions of the group members, excluding the latter two sources, and find an average proper motion of μα = −36.0 mas/yr and μδ = −1.2 mas/yr for the ϵ Cha association, corresponding to a projected linear velocity of ~19.5 km s-1. The 1 and 2σ error ellipses are also shown in Fig. 2. Since the stars with ID# 9 and 12 have proper motions that both differ by ≳3σ from the average group value, this casts doubt on their membership to the ϵ Cha association. No proper motion estimates are available for the sources with ID# 3, 4, 6, and 7. Since these sources show X-ray emission and are spatially associated with HD 104237A, it is highly likely that they are ϵ Cha members. In summary, we confirm ten of the previously identified members as members of ϵ Cha, and challenge the membership of two stars, ID#9 and 12. The refined memberships of ϵ Cha are also listed in Table 3. We must stress that we cannot exclude with certainty that sources ID#9 and 12 are members of the ϵ Cha association. Both sources may be in binary systems, where their orbital motions can alter their proper motions, or they may have been ejected from binary systems. Moreover, the strength of Li absorption lines in these two stars is comparable to other ϵ Cha stars, as are the Na I and K I strengths, indicating that the two stars have ages similar to those of the other ϵ Cha members (Luhman 2004; Lawson et al. 2009). Source ID#9 is also an X-ray emitter (Feigelson et al. 2003). Thus both sources are clearly young stars and may well have formed together with the other ϵ Cha members.
3.1.2. The masses and ages of the ϵ Cha members
Figure 3 shows the HR diagram of the sources in the ϵ Cha association, where the temperatures were adopted from the observed spectral types (Kenyon & Hartmann 1995; Luhman et al. 2003) and the luminosity was determined as described in Sect. 2.1. In the figure, the theoretical pre-main sequence (PMS) evolutionary tracks are obtained from Dotter et al. (2008). The masses and ages were then deduced by comparing the location of each object in the HR diagram with the PMS evolutionary tracks (Dotter et al. 2008). For the suspicious members ID#9 and 12, masses and ages were estimated, assuming that they are at the same distance as the ϵ Cha association. As a comparison, we also estimated the masses and ages using the PMS evolutionary tracks from Baraffe et al. (1998). In general, both PMS evolutionary tracks give similar masses and ages for most of sources in our sample.
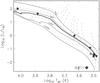 |
Fig. 3 HR diagram of members (filled circles) of ϵ Cha. The open diamond marks the underluminous object ID#11. The grey lines are PMS isochrones of 1, 3, 10, and 100 Myr, and the dark line is the PMS isochrone of 4 Myr (Dotter et al. 2008). The dashed lines are the PMS evolutionary tracks for individual masses. The open circles are for stars ID#9 and 12, which have proper motions that deviate from the other stars. |
The resulting ages and masses for all stars are listed in Table 3. The ages of all the confirmed members, with the exception of CXOU J115908.2, are around 3–5 Myr, which is consistent with the previous estimate (Feigelson et al. 2003). The source ID#11 appears sub-luminous by a factor ~30 with respect to objects of similar spectral type, placing it below the zero-age main sequence (ZAMS) and inhibiting a mass and age estimate through placement in the HR diagram. We estimated its mass from its spectral type (M2.25) by assuming an age of 4 Myr. There is no estimate of the spectral type of source HD 104237B (ID#4). We estimated its mass from its position in the J vs. J − H color–magnitude diagram, assuming an age of 4 Myr and using model J and H magnitudes from the PMS evolutionary tracks (Baraffe et al. 1998; Dotter et al. 2008). The results are listed in Table 3.
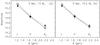 |
Fig. 4 Observed photometry (filled circles) and model photometry (open circles) for HD 104237C in the J, H, and Ks bands. Panel a) shows model photometry for a 13 MJup brown dwarf with an age of 3 Myr, panel b) shows a model of a 15.2 MJup object of 5 Myr. The model photometry was adopted from Chabrier et al. (2000). |
HD 104237C, located ~53 to the northwest of HD 104237A, is a
source of X-ray emission seen by Chandra (Feigelson
et al. 2003) with a near-infrared counterpart (Grady et al. 2004). At a distance of 114 pc, the projected distance between
HD 104237C and HD 104237A is ~604 AU. Figure 4 shows the observed photometry for HD 104237C in the J,
H, and Ks bands from Grady et al. (2004). Since no spectral-type estimate
is available for HD 104237C, we estimate its mass by comparing the observed
near-infrared photometry to model photometry for young brown dwarfs at ages of 3 and
5 Myr (Chabrier et al. 2000). The best-fit masses
for the assumed ages and the assumed distance of 114 pc are 13.0 and 15.2 Jupiter masses
(MJup), respectively. We will adopt these numbers as the
mass range for HD 104237C, putting this object at the boundary between a very low-mass
brown dwarf and a “free-floating planet”. Of the currently known members of the
ϵ Cha association, HD 104237C has by far the lowest mass.
3.2. Disk properties
In this section, we first estimate the rates at which material is accreted onto the central stars in the ϵ Cha member systems and then characterize their disks in terms of evolutionary state. Finally, we derive the dust properties of those protoplanetary disks that show emission from silicate dust in their IRS spectra and compare them with the dust properties found for protoplanetary disks in other sparse stellar associations or star-formation regions.
3.2.1. Accretion
We used the luminosity of the Hα emission line as a proxy for the
accretion rate. The line luminosity was obtained by integrating over the line profile,
adopting the best-fit model atmosphere spectrum (see Sect. 2.1) as the continuum level. We estimated the accretion rates from the
observed Hα emission-line luminosity using the empirical relation
between the latter quantity and the accretion luminosity derived in Fang et al. (2009):
 (3)The inferred accretion luminosities are
then converted into mass accretion rates using the following relation:
(3)The inferred accretion luminosities are
then converted into mass accretion rates using the following relation:
 (4)where Rin
denotes the truncation radius of the disk, which is taken to be
5 R ⋆ (Gullbring et al. 1998), G is the gravitational constant,
M ⋆ is the stellar mass as estimated
from the location of each star in the HR diagram, and
R ⋆ is the stellar radius derived
using the SED fitting procedure described in Sect. 2.1. There are four sources in ϵ Cha showing signs of active
accretion, and their accretion rates are listed in Table 3.
(4)where Rin
denotes the truncation radius of the disk, which is taken to be
5 R ⋆ (Gullbring et al. 1998), G is the gravitational constant,
M ⋆ is the stellar mass as estimated
from the location of each star in the HR diagram, and
R ⋆ is the stellar radius derived
using the SED fitting procedure described in Sect. 2.1. There are four sources in ϵ Cha showing signs of active
accretion, and their accretion rates are listed in Table 3.
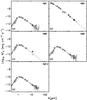 |
Fig. 5 SEDs of apparently diskless stars. The photospheric emission level is indicated with a dotted curve in each panel. The circles show the photometry in different bands. The filled circle show the upper limit derived from our VLT/VISIR imaging for ID#6. The thick grey solid lines in panels a, b, d and e show the Spitzer/IRS spectra. |
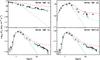 |
Fig. 6 SEDs of the disk population in ϵ Cha. The photospheric emission level is indicated with a grey dotted curve in each panel. The circles show the photometry in various bands. The filled circles show the photometry from our VLT/VISIR imaging. The solid line shows the IRS spectrum in each panel. The dashed line in each panel represents the calculated SED of a flaring disk model, and the dash-dotted line shows the calculated SED of a flattened disk model. |
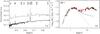 |
Fig. 7 Optical spectrum and SED of 2MASS J12014343 (ID#11). a) The optical spectrum of source ID#11 (black line) and of a similarly underluminous object in L1641 (L1641-ID#122, grey line, Fang et al. 2009). b) The SED of source ID#11. The photospheric emission level is indicated with a grey solid curve. The open circles show the broad-band photometry of ID#11, and the IRS spectrum of this source is shown in black. The photometry of underluminous source L1641-ID#122 is depicted with the open squares connected by dashed line for comparison and shows striking resemblance to that of ID#11 at mid-infrared wavelengths. The dash-dotted line presents the median SED of the distributed disk population in L1641 (Fang et al. 2009). |
3.2.2. Demographics of disk population in ϵ Cha
In Figs. 5, 6, and 7b, we show the SEDs of the ten sources for which spectral types are available, together with the best-fit stellar model atmospheres (see Sect. 2.1). In total, we detected nine sources with the Spitzer/IRS. Among these, seven were confirmed as members of the ϵ Cha association, based on common proper motion in Sect. 3.1.1. Two of the members, CXOU J115908.2 (ID#1) and ϵ Cha AB (ID#2), do not show significant excess emission over the stellar photosphere in the IRS spectral range. Also, ID#9 and 12, whose memberships were challenged based on their proper motions, do not show infrared excess emission in the IRS spectra, strongly suggesting that they do not (any longer) harbor circumstellar disks. For the sources that were not detected with the IRS, we characterized their disks based on infrared photometric data only. The source HD 104237D (ID#6) cannot be spatially separated from HD 104237A with the IRS and MIPS instruments due to the comparatively poor spatial resolution of the Spitzer Space Telescope at long wavelengths. HD 104237D is not detected in our VISIR imaging at 12 μm, and we derived a 3σ upper limit of ~18 mJy for its flux at this wavelength. This upper limit is just above the expected photospheric emission level, as extrapolated from shorter wavelengths and shown in Fig. 5, indicating that HD 104237D no longer has a disk. However, based on currently available data, the possibility of an evolved disk with a large inner hole that would be observable only at longer wavelengths cannot be excluded. The underluminous object 2MASS J12014343 (ID#11) shows a very flat SED, which is similar to the SEDs of similarly underluminous objects discovered in other star-forming regions (see Fang et al. 2009). For sources HD 104237B (ID#4) and HD 104237C (ID#3), we only have photometry in JHKs bands. The J − H vs. H − Ks color–color diagram shows only HD 104237B to still have near-infrared excess emission, indicative of a hot, optically thick inner disk (Grady et al. 2004).
In Fig. 6a, we show the SED of HD 104237A, which exhibits strong excess emission at wavelengths beyond ~2 μm. HD 104237A therefore shows clear evidence for a hot, optically thick inner disk. We use the 2D RADMC code from Dullemond & Dominik (2004) to calculate two SEDs, one for a flaring disk model and the other for a flattened disk model, given the effective temperature (Teff), stellar radius (R ⋆ ), and stellar mass (M ⋆ ) of HD 104237A. In both models, we assume a pressure scale height (HP) that varies as a power law with the radius (R), HP/R = R1/7. The inner disk radius (Rin) is set at the dust destruction radius of Tdust ~ 1500 K, and the outer disk radius (Rout) is 500 AU. The scale height at the outer disk radius is set as Hout/Rout = 0.2 for the flaring disk model and as Hout/Rout = 0.1 for the settled/flattened disk model. We use a power-law size distribution with an exponent −3.5 for dust grain with a minimum grain size of 0.1 μm and a maximum grain size of 1000 μm. Two populations of amorphous dust grains (25% carbon and 75% silicate) have been included in the models. In the flaring disk model, the disk mass is set to be 0.02 M ⋆ , and in the flattened disk model, the disk mass (Mdisk) is 0.001 M ⋆ . The gas-to-dust ratio is taken to be 100 in the models. The disk surface density (Σ) is estimated from the total disk mass, assuming Σ ∝ R-1. In Fig. 6a, we show the two model SEDs for the disk inclination angle ~55°. The SED of HD 104237A is more similar to the SED for the flattened disk model than to the SED for a flaring disk model.
In Figs. 6b, c, and d, we show the SEDs of group members HD 104237E (ID#7), USNO-B120144.7 (ID#8), and 2MASS J12005517 (ID#10), as well as two model SEDs: one for a flaring disk and one for a flattened disk model for each object. In the calculation, we use the same parameters in the disk models as those for HD 104237A, except that the outer disk radius is set to be 200 AU. The actual stellar parameters of each object are used in the calculation. Overall, the SEDs of the three objects HD 104237E (ID#7), USNO-B120144.7 (ID#8), and 2MASS J12005517 (ID#10) are between the two model SEDs. It can also be seen that the excess emission in the MIPS 24 μm band of source ID#7 is similar to the model SED of the flaring disk, whereas its infrared excess at shorter wavelengths is substantially lower and closer to the SED of a flattened disk. This may indicate that source ID#7 has started to dissipate its inner disk, while its outer disk remains relatively intact. In contrast to object ID#7, the very low-mass objects ID#8 and 10 show a fairly uniform depletion of the SED. Their SEDs are similar to the SEDs of the flattened disk models.
Spitzer observations of clusters with ages of several Myr, such as IC 348, NGC 2362, η Cha, and the Coronet cluster, suggest that, qualitatively, two evolutionary paths exist for going from a primordial to a debris disk configuration (Lada et al. 2006; Sicilia-Aguilar et al. 2008; Currie & Kenyon 2009; Currie et al. 2009; Sicilia-Aguilar et al. 2009; Currie & Sicilia-Aguilar 2011). Each path shows a characteristic behavior of the SED: (1) some objects show little or no excess emission in the shorter IRAC bands and strong excess emission at 24 μm, suggesting that disks are dissipated in an inside-out fashion; (2) some objects show infrared excess of an approximately uniformly reduced magnitude compared to primordial disks over all wavelengths out to 24 μm, suggesting a reduction of the effective disk height, i.e., the height above the disk midplane where the disk becomes optically thick to the stellar radiation. A reduced disk height causes a smaller fraction of the stellar energy to be absorbed and reprocessed by the disk and thereby yields an infrared excess of reduced magnitude. This may occur if dust coagulation takes place in the disk, causing the grains to couple somewhat less well to the gas and allowing them to settle towards the midplane. How effective this is also depends on the level of turbulence in the disk; grains settle more easily in a disk with low turbulence. In some cases, the disks could have lost a large number of small dust grains, and become optically thin. This type of disk can also show a significant depletion of infrared emission (Currie & Sicilia-Aguilar 2011). In ϵ Cha, source ID#7 shows an SED reminiscent of the first type of disk evolution (inside-out fashion), whereas sources ID#8 and 10 show an SED corresponding to the second scenario (globally depleted). Both latter sources show strong evidence of dust growth, which seems to have progressed particularly far in source ID#8 judging from the absence of silicate features at ~10 and 20 μm. The absence indicates that there is no substantial population of dust grains with sizes of ≲10 μm left in the atmosphere of this disk. It is interesting to note that source ID#7, which shows evidence of an inside-out disk clearing, has a silicate feature emitted by predominantly small, sub-micron sized grains.
3.2.3. 2MASS J12014343: a disk system with high inclination?
When the HR diagram of the ϵ Cha sample (Fig. 3) is inspected, one object stands out in the sense that it lies well below the ZAMS. Compared to ~4 Myr old stars with the same spectral type, 2MASS J12014343 (ID#11) appears underluminous by a factor of ~30. Since evidence of group membership is strong (optical emission lines, infrared excess, and in particular a proper motion in agreement with the ϵ Cha group, see Sect. 3.1.1) its underluminosity cannot be simply explained due to ID#11 being a field star. To understand its nature we should resort to other explanations. In Fig. 7a, we show the optical spectrum of ID#11, on which Balmer emission lines and forbidden oxygen emission lines with very high EWs are seen. Source ID#11 also shows a particularly strong infrared excess (Fig. 7b). Objects with these characteristics have been found in other star-forming regions, e.g., Lupus 3 dark cloud, Taurus, L1630, and L1641 (Comerón et al. 2003; White & Hillenbrand 2004; Fang et al. 2009; Merín et al. 2010). One possible explanation for this phenomenon is that these sources are systems harboring flared disks with moderately high inclinations where the stellar photospheric light is largely absorbed by the material in the cold, flared outer disk. We still receive photospheric light, but a large fraction of the light we see is scattered off the disk surface and has a much reduced total flux. The optical emission lines of large EWs may arise in an outflow or disk wind. They need not intrinsically be brighter than in similar objects with “normal” apparent luminosities; it is the reduced strength of the continuum flux, not the intrinsic line strength, that causes the EWs to be high. This scenario only works if the line-forming region is much larger than the central star, so that at least part of the line flux reaches us relatively unhindered, while the photospheric continuum is strongly absorbed. In particular, this scenario also explains why some of these apparently underluminous objects show some emission lines like He I 5876 Å and the Ca II near-infrared triplet (8498, 8542, and 8662 Å) with EWs that appear not enhanced (see Comerón et al. 2003; Fang et al. 2009): these lines are mainly formed in the magnetospheric infall flows (Muzerolle et al. 1998), which are close to the stellar surface and should be as much occulted as the photospheric continuum. Luhman (2004) suggested that 2MASS J12014343 harbors an edge-on disk and seen in scattered light. The 10 μm silicate feature of 2MASS J12014343 is seen in emission, suggesting that its inclination is substantially different from 90 degrees (edge on).
In Fig. 7, we also compare the optical spectrum and SED of source ID#11 with an object that shows very similar characteristics and was recently found in the Lynds 1641 cloud in Orion (ID#122, named L1641#122 hereafter, see Fang et al. 2009). L1641#122 is also apparently underluminous compared to stars of similar spectral type in the same cloud by a factor of ~30, similar to ID#11. But contrary to ID#11, it shows the He I 5876 Å, [S II], and Ca II near-infrared triplet (8498, 8542, and 8662 Å) in emission, indicating active accretion. The optical spectrum of ID#11 did not show signs of active accretion at the time of observation. In Fig. 7b, we compare the median SED of the distributed disk population in L1641 (L1641D) and that of L1641#122 (Fang et al. 2009) with the SED of ID#11. From this comparison we can see that the infrared SEDs of ID#11 and L1641#122 are remarkably similar and that both underluminous objects show much stronger mid-infrared excesses than the average source in L1641, even though the L1641D population is much younger (~1 Myr) than ϵ Cha. At wavelengths shorter than ~8 μm, the SED of ID#11 shows a rapidly decreasing trend. This is different from the SED of L1641#122, which shows relatively flat SED till near-infrared wavelengths. It suggests that the inner disk around ID#11 may have been dissipated, consistent with its very low or no accretion activities.
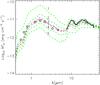 |
Fig. 8 SED of the source ID#11. The open circles show the broad-band photometry of ID#11, and the IRS spectrum of this source is shown in black. The dashed lines marked by numbers 1–5 show model SEDs for a same model disk with different inclination angles. From model 1 to model 5, the inclination angles are 83°, 84°, 84.5°, 85°, and 86°, respectively. In the model, we added a few small dust grains to the hole of the disk. The model with disk inclination ~84.5° best fits the SED of ID#11. The dash-dotted line shows the model SED for a disk (inclination angle ~84°) without small dust grains in the disk hole. The model SED generally fits the shape of the observed SED of ID#11, but fails to reproduce the observed silicate features. |
As discussed above, based on the SED of ID#11, the circumstellar disk of ID#11 may have two properties: (1) the inclination angle of the disk should be high but less than edge on, (2) the inner region of the disk may be evolving. To explore the possibility that such types of disks can produce SEDs similar to the one of ID#11, we performed a detailed SED modeling using the 2D RADMC code (Dullemond & Dominik 2004). In the calculation, the stellar radius and mass for ID#11 is given as a 4 Myr PMS star with a spectral type of M2.25, which is ~1 R⊙ and ~0.3 M⊙ from Dotter et al. (2008). By varying Mdisk, Rout, Rin, and disk inclination angle, we found that the shape of the SED of ID#11 can be generally fitted by the SED of a disk with Rin ~ 0.5 AU, Mdisk ~ 0.0001 M ⋆ , the inclination angle ~84°, and Hout/Rout ~ 0.1 (see Fig. 8). The dust populations in the disk are same as those in the disk models described in Sect. 3.2.2. However, the SED of such a disk model fails to reproduce the observed 10 and 20 μm silicate features for ID#11. In order to produce these silicate features, we added a few small dust grains in the disk hole. The dust grains are located close to the inner rim of the disk. The grain size distribution is a power-law distribution with an exponent −3.5 for dust grain with a minimum grain size 0.005 μm and a maximum grain size 0.5 μm. We fixed the Mdisk ~ 0.0001 M ⋆ and Hout/Rout ~ 0.1. By varying the Rin, inclination angle, the mass of small dust grains, and the location of these small dust grains, we found that the SED of ID#11 can be fitted when Rin ~ 0.7 AU, the inclination angle ~84.5°, and the total mass of the small grains ~10-11 M⊙, which are located between 0.6 and 0.7 AU from the central star.
3.2.4. The disk and accretor frequencies in ϵ Cha
In order to estimate the disk frequency in ϵ Cha, i.e., the fraction
of sources that shows evidence of a circumstellar disk in the form of infrared excess
emission, one needs to identify all members of the ϵ Cha association
and characterize their infrared SEDs. This is a challenging task because the
ϵ Cha association is spread over a large area of the sky and a full
inventory is beyond the scope of the current work. Instead, we restrict ourselves to the
region within a radius of 05 of ϵ Cha AB. This part
of the sky has been surveyed by Luhman (2004),
and our knowledge of the association can be considered essentially complete. In
Figs. 5, 6,
and 7b, we show the SEDs of ten members with
published spectral types. Among these, five objects show excess emission at near- or
mid-infrared wavelengths and thus are harboring circumstellar disks. We also include
HD 104237B, which shows excess emission at KS bands
according to Grady et al. (2004), and obtain a
disk frequency among the 11 stellar members of ϵ Cha association of
55 (6/11)1. This is quite high for a 3–5 Myr old population, though this value is
clearly subject to low-number statistics and it is premature to conclude that the disk
frequency in ϵ Cha is high based on these data alone. However, as we
will see later in this section, the five other sparse associations of which we estimated
the disk frequencies, Taurus, the Coronet cluster (CrA), MBM 12, η Cha,
and TW Hya, show a similar trend. The ensemble of data provides strong evidence that
disk lifetimes in sparse associations are longer than those in more crowded
environments.
(6/11)1. This is quite high for a 3–5 Myr old population, though this value is
clearly subject to low-number statistics and it is premature to conclude that the disk
frequency in ϵ Cha is high based on these data alone. However, as we
will see later in this section, the five other sparse associations of which we estimated
the disk frequencies, Taurus, the Coronet cluster (CrA), MBM 12, η Cha,
and TW Hya, show a similar trend. The ensemble of data provides strong evidence that
disk lifetimes in sparse associations are longer than those in more crowded
environments.
In Fig. 9, we illustrate this by showing the estimated disk frequencies in the aforementioned sparse associations and a number of other star-formation regions as a function of their age (see Appendix A for a detailed description). The disk frequencies are estimated using only IRAC data or infrared data at wavelengths shorter than ~8 μm, and the ages are all estimated from Baraffe et al. (1998). Figure 9 also shows a fit to the observed disk frequencies of all regions, except the six sparse associations, of the form fdisk = exp(− t/τ0). We find a value of τ0 = 2.8 ± 0.1 Myr to yield a good fit (reduced χ2 = 1.8) to the overall distribution. This agrees with the value of ~3.0 Myr found by Fedele et al. (2010) in an earlier, similar study. Because the disk lifetime in any given environment may depend on the mass of the central star (e.g., Kennedy & Kenyon 2009) it is useful to investigate the low-mass population separately. In Fig. 9b, we show the disk frequency among stars with estimated masses in the 0.1−0.6 M⊙ range for the same star-forming regions as shown in Fig. 9, but including only those for which the low-mass population has been characterized. We find essentially the same typical disk dispersal time as for the whole mass range (τ0 = 2.5 ± 0.2 Myr) (reduced χ2 = 1.1). Again, the sparse associations are deviant in the sense that they show systematically higher disk frequencies. We fitted the disk frequencies in the sparse associations of the form fdisk = exp(− t/τ0), which gives τ0 = 4.3 ± 0.3 Myr (reduced χ2 = 1.6) among all sources and τ0 = 4.1 ± 0.5 Myr (reduced χ2 = 1.5) among sources with masses in the 0.1−0.6 M⊙ range. The estimated lifetimes of disks in the sparse associations are longer than those in the dense (cluster) environments with more than 2σ confidence. As noted in Fig. 9, disk frequencies for the sparse associations are nearly constant at 60–70% for ages below 4 Myr, and decrease slowly at higher ages. This is suggestive of a bimodal mechanism responsible for disk dissipation in these regions. Very early in the evolution of the associations, 30–40% of the disks may have been dissipated quickly by some efficient mechanism, for example, interaction with binary companions in close systems (Bouwman et al. 2006; Kraus et al. 2012). After the fast disk-dissipation phase, the remaining disks would evolve slowly via other mechanisms, e.g., viscous evolution, planet formation, or photoevaporation.
To estimate the accretor frequency, i.e., the fraction of members showing signs of
active accretion, we turn to the Hα line as a diagnostic. Estimates of
the Hα EWs are available for eight of the ϵ Cha
members, of which five are classified as accretors according to the criteria in Fang et al. (2009). This brings our estimate of the
accretor frequency in ϵ Cha to
63 , again obviously subject to low-number
statistics. Fedele et al. (2010) investigated the
age dependency of accretor frequency and derive an empirical relation
facc = e−t/2.3, where
t is in units of Myrs, by fitting an exponential profile to the
observed accretor frequencies of a number of star-formation regions. For
ϵ Cha, aged 3−5 Myr, the empirical relation predicts an accretor
frequency of ~10−30%, substantially below the observed value.
, again obviously subject to low-number
statistics. Fedele et al. (2010) investigated the
age dependency of accretor frequency and derive an empirical relation
facc = e−t/2.3, where
t is in units of Myrs, by fitting an exponential profile to the
observed accretor frequencies of a number of star-formation regions. For
ϵ Cha, aged 3−5 Myr, the empirical relation predicts an accretor
frequency of ~10−30%, substantially below the observed value.
In conclusion, we can state that the disks around stars in sparse associations evolve more slowly than those in denser environments.
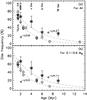 |
Fig. 9 Disk frequencies for different clusters/star-formation regions plotted as a function of their ages, which are all estimated from Baraffe et al. (1998) (see Table A.1). In panel a) we plot the disk frequency among all known members, in panel b) we show only the low-mass (0.1–0.6 M⊙) population. The filled pentagram represents the sparse stellar associations, Taurus, CrA, MBM 12, ϵ Cha, η Cha, and TW Hya in panel a), and the sparse stellar associations, Taurus, MBM 12, ϵ Cha, η Cha, and TW Hya in panel b). The open circles show the disk frequencies in the compact clusters or the OB associations (see Appendix A for a detailed description). In each panel, the dashed line represents the best-fit exponential decay for all regions, excluding the sparse associations and the dash-dotted line represents the best-fit exponential decay for the sparse associations. |
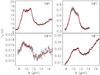 |
Fig. 10 The 10 μm silicate features fitted using the TLTD method (solid red lines). The observed spectra are represented as filled circles with the errors in grey. |
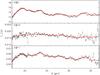 |
Fig. 11 IRS spectra in the 17–37 μm range and spectral fits using the TLTD method. The observed spectra are represented as filled circles with the errors in grey, whereas the fits are shown in red. |
3.2.5. The dust properties of disks
We have used the TLTD spectral decomposition method developed by Juhász et al. (2009) to analyze our IRS spectra of the ϵ Cha members. In this section, we will first present the derived dust properties of the protoplanetary disks in ϵ Cha. Then we will join the ϵ Cha sample with a collection of cool T Tauri stars in the MBM 12 and η Cha associations, as well as with the Coronet cluster and the sample in the cores-to-disks (c2d) legacy program, for which IRS spectra have been previously analyzed using identical or similar methods. The combined data set is then used to do a statistical study on the dust properties of protoplanetary disks around the cool stars.
Silicate compositions estimated from IRS spectra with TLTD.
Fitting results for IRS sepctra with TLTD.
(a) The IRS spectra of the ϵ Cha disks
There are five ϵ Cha members for which we have IRS spectra that show evidence for a protoplanetary disk. Four of these show the well-known silicate feature between 8 and 13 μm in emission (ID#5,7,10,11, see Fig. 10). Before using TLTD routines to derive the dust composition, we divided the IRS spectra into a “short” (7–17 μm) and a “long” (17–37 μm) wavelength regime, which are analyzed independently. Since the short wavelength part of the spectrum is dominated by warm disk regions closer to the central star than the cooler regions that dominate long wavelength data, we can search for radial gradients in the dust properties.
The derived dust properties are listed in Tables 4 and 5. In Table 4, we present the outcome of the fits in terms of mass abundances of the different species. In Table 5, we give the mass-averaged grain sizes of the amorphous and crystalline silicates, as well as the fractional contribution of the crystalline species to the total dust mass present in the optically thin disk atmosphere. As shown in Table 5, the crystalline fractions of the objects in ϵ Cha are comparable to those of young stars with similar spectral type in the literature (Sicilia-Aguilar et al. 2008, 2009; Meeus et al. 2009; Juhász et al. 2010). Also, in the warm disk regions, the dust grains of our objects show typical larger sizes than those in the interstellar medium, suggesting dust growth in these regions. Based on simulations in a 1D vertical column of a protoplanetary disk, Zsom et al. (2011) suggest that high values of turbulence (α ~ 0.01) are needed to explain the existence of grains with sizes of a few microns in disk atmospheres at ages of several Myr.
We now briefly describe the individual objects:
HD 104237A (ID#5) Juhász et al. (2010) fitted the IRS spectrum of this object using amorphous dust with olivine and pyroxene stoichiometries, as well as silica with grain sizes of 0.1, 2.0, and 5.0 μm, crystalline species forsterite and enstatite with grain sizes of 0.1 and 2.0 μm, and polycyclic aromatic hydrocarbons (PAHs). They divided the IRS spectrum into two sections: 5–17 μm and 17–35 μm, which are similar to those we use. From the short wavelength part, they derived mass-averaged grain sizes of the amorphous and crystalline silicates, which are 4.6 μm and 1.4 μm, respectively, and a mass fraction of 9.5% in crystalline silicates. In the long wavelength part of the spectrum, they find 0.1 μm and 0.4 μm for the mass-averaged grain sizes and 7.1% for the crystallinity. Even though we use a slightly different set of grain sizes in our fit, our results agree well with those derived by Juhász et al. (2010), with the exception of the mass-averaged grain size of the amorphous silicates derived from the long wavelength channel. Here we find a somewhat higher value. This may be due to the fact that the mass absorption coefficients of amorphous silicates with sizes of 0.1 and 1.5 μm are very similar in the 17–37 μm spectral range.
2MASS J12005517 (ID#10) We find that the spectrum of this object is best reproduced using an extraordinarily high mass fraction of crystalline silicates of ~49%. This may be a contrast effect: because of the very low luminosity of ID#10, its 10 μm silicate feature arises mainly in the inner ~0.5 AU of the disk. The central regions of disks can be highly crystalline (van Boekel et al. 2004), possibly leading to very high apparent crystallinities if only the very central disk regions contribute to the part of the spectrum used in the mineralogical analysis (see also Apai et al. 2005). In Fig. 12, we compare the IRS spectrum of ID#10 in the 7.8–14.3 μm spectral range with the mass absorption coefficients of enstatite and amorphous silicates with different grain sizes. The spectral signature of enstatite is clearly present in the spectrum of ID#10.
2MASS J12014343 (ID#11) As discussed in Sect. 3.2.3, source ID#11 may be harboring a disk with a high inclination. Therefore, the IRS spectrum of ID#11 can be moderately reddened by the cold outer disk. In order to deredden the spectrum, we would need to know the magnitude of the extinction and the proper extinction law at the mid-infrared wavelengths, both of which are not well known. We therefore applied no reddening correction, took the observed spectrum at face value, and fed it to the TLTD routines. Since the TLTD routines only work properly for low-extinction sources, our results for source ID#11 should be regarded as tentative.
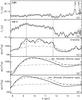 |
Fig. 12 a) IRS spectrum of source ID#8. The positions of the C2H2 and HCN rovibrational bands are marked. b) IRS spectrum of the source ID#10. The dotted vertical lines mark the features of enstatite. c)–e): The mass absorption coefficients of enstatite and amorphous silicates (with olivine and pyroxene stoichiometry) with grain sizes of 0.1 μm (solid lines), 1.5 μm (dashed lines), and 6.0 μm (dash-dotted lines). The dotted lines in panels b), c) are identical. |
USNO-B120144.7 (ID#8) The luminosity and spectral type of this source are similar to those of ID#10. Both sources also show similar accretion activity (see Table 3) and similar SEDs (see Fig. 6). However, in contrast to ID#10, the IRS spectrum of ID#8 does not show a silicate feature around 10 μm (see Fig. 12). This suggests that the silicates in the warm disk atmosphere of ID#8 have grown to sizes larger than those in the disk of ID#10. In the IRS spectrum of ID#8, we clearly detect the C2H2 rovibrational band at ~13.7 μm, but do not find the HCN rovibrational band at ~14.0 μm (see Fig. 12). This is consistent with what Pascucci et al. (2009) discovered in Spitzer spectra of other cool stars, namely, that the C2H2/HCN flux ratios from cool star disks are large with a median of ~3.8, which is an order of magnitude higher than the median C2H2/HCN flux ratio in spectra of disks surrounding sun-like stars (~0.34).
(b) Dust properties of disks around cool T Tauri stars
We now combine the dust properties derived for the ϵ Cha members with those derived for several other regions and do a statistical analysis of the combined data set. We collected the available literature data for protoplanetary disks surrounding young stars of spectral type M0 or later in the MBM 12 (Meeus et al. 2009), η Cha (Sicilia-Aguilar et al. 2009) associations, the Coronet cluster (Sicilia-Aguilar et al. 2008), and the sample in the c2d legacy program (Olofsson et al. 2009, 2010). The dust properties for the targets in MBM 12, η Cha, and the Coronet cluster are derived from Spitzer/IRS spectra using the same TLTD spectral decomposition routines that we used for the ϵ Cha data. As described in Sect. 3.2.5, the IRS spectra are divided into two regions, a short (7–17 μm) wavelength part tracing the warm inner disk regions and a long (17–37 μm) wavelength part that is more sensitive to cooler regions further from the central star. For targets in the c2d legacy program, Olofsson et al. (2010) performed the spectral decomposition using the B2C method, which includes continuum emission and two main components, i.e., a warm and a cold one responsible for the 10 μm and 20–30 μm emission features, respectively. This more or less corresponds to the short and long wavelength regime of the IRS spectra in the TLTD spectral decomposition approach.
In Fig. 13, we compare the dust properties in the warmer and cooler regions. We compare the average sizes of dust grains for both the amorphous and crystalline grain population, along with the mass fractions of crystalline silicates. As shown in Fig. 13a,b, the average sizes of the amorphous and crystalline silicates in the warmer regions of protoplanetary disks are substantially larger than those in the cooler disk. This may indicate that dust growth has been more efficient closer to the central star than in regions at larger distances. However it may also mean that the disks are more turbulent in the warm inner regions than further out, which allows larger grains to remain visible in the disk surface instead of settling to the midplane. A combination of both effects is also plausible. Figure 13c shows that the dust in the warm inner regions of protoplanetary disks generally contains a higher fraction of crystalline material than the dust in cooler regions. This is consistent with earlier findings (e.g., van Boekel et al. 2004; Meeus et al. 2009).
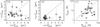 |
Fig. 13 a) Comparison of the mass-averaged sizes of amorphous dust grains as derived from the shorter and longer wavelength part of the IRS spectra (indicated with “W” and “C” superscripts for “warm” and “cold” disk regions) of sources in ϵ Cha, MBM 12, η Cha, and the Coronet cluster, and the targets from Olofsson et al. (2010). The circles are for the targets in MBM 12, η Cha, and the Coronet cluster. The diamonds show the targets from Olofsson et al. (2010). The pentagram marks object ID#10 and 11 in ϵ Cha. b) Similar to a), but for mass-averaged sizes of crystalline dust grains. c) Comparison of the mass fraction of crystalline dust grains as derived from the shorter and longer wavelength part of the IRS spectra. The symbols are similar to panel a). |
We estimated the accretion rates for all stars from their Hα line luminosity using the method described in Sect. 3.2.1 and list these in Table B.1. In Fig. 14, we plot the average grain sizes of amorphous silicates against accretion rates. The data suggest a positive correlation between the average grain sizes of the amorphous silicates and the accretion rates if the latter is above ~10-9 M⊙ yr-1 (see Fig. 14). Below this value, the grains in the majority of disks are small, independently of the accretion rate. In order to see whether there is any correlation between both observables, we apply a Kendall τ test. If two datasets are fully correlated, this test returns a value of τ = 1. If they are anti-correlated, we get τ = −1, and if they are independent, we obtain τ = 0. The Kendall τ test also returns a probability p, which is smaller when the correlation is more significant. We use the Kendall τ test to evaluate the possible correlation between the average grain sizes of amorphous silicates and the accretion rates, which yields τ = 0.79 and p = 0.006 for Ṁacc > 10-9 M⊙ yr-1, and τ = 0.16 and p = 0.58 for Ṁacc ≤ 10-9 M⊙ yr-1. Thus there is a significant correlation between the average grain sizes of amorphous silicates and the accretion rates when Ṁacc > 10-9 M⊙ yr-1. A possible explanation for this relation is that both accretion and the presence of large grains in the disk surface require some level of turbulence in the disk. Thus, both a large average grain size and a high accretion rate are tale tell signs of a turbulent disk, though there need not be a direct causal connection between both observables.
There are three outliers in Fig. 14, MBM 12-10, G-14, and Sz 76, which are all classified as WTTSs due to their small Hα EWs. Yet, all of them show large average grain sizes in their IRS spectra. G-14 shows a quite globally depleted SED, which can be due to strong overall dust settling and/or grain growth in the disk (Sicilia-Aguilar et al. 2008). MBM12-10 and Sz 76 can be classified as transition disks (Meeus et al. 2009; Wahhaj et al. 2010). It is still unknown which mechanisms are responsible for the evolution from normal disks to transition disks. One of the proposed mechanisms is dust growth and settling, which is believed to work in some of the transition disks in the Cep OB2 region (Sicilia-Aguilar et al. 2011a). However, in the Chamaeleon I star-forming region, Manoj et al. (2011) found that some of the transition disks show 10 μm features from relatively unprocessed grains compared with normal disks. This indicates that, at least in disk surfaces, the dust population has not undergone substantial grain growth in these objects. Thus that a transition disk geometry does not necessarily go hand in hand with large silicate grains dominating the mid-infrared spectra. Nevertheless, the deviant behavior of sources MBM12-10, G-14, and Sz 76 from the correlation between the average grain size of the amorphous grains and the accretion rate is plausibly due to their special disk structures (with inner holes) or extreme grain growth (see also Sicilia-Aguilar et al. 2011a).
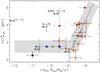 |
Fig. 14 The average sizes of amorphous grains plotted versus the accretion rate of the central stars. The grain sizes are derived in the warmer region of the IRS spectra. The filled symbols show the CTTSs, and the open symbols represent the WTTSs. The targets in MBM 12 are shown as circles, in η Cha as squares, and in the Coronet cluster as triangles. The diamonds show the targets from Olofsson et al. (2010). The pentagram marks object ID#10 in ϵ Cha. The thick dashed lines are the fit to the relation between the accretion rates and the grain sizes for Ṁacc > 10-9 M⊙ yr-1. |
 |
Fig. 15 The mass fractions of crystalline material compared to the effective temperature of the central stars (which correlates closely with the bolometric luminosity, see Fig. 3). The crystallinities are derived from the 7–17 μm part of the IRS spectra. b) similar to a), except that the crystallinities are derived from in 17–37 μm part of the IRS spectra. The symbols are identical to those in Fig. 14. |
Sicilia-Aguilar et al. (2007) have discovered a
correlation between the average grain sizes of silicates and accretion rates that is
similar to what we find for accretion rates above
10-9 M⊙ yr-1. In addition, they
argue that turbulence in disks prevents large grains from settling into the disk
interior, where they are invisible to Spitzer, and also promotes
accretion, thereby leading to a correlation between both observables. What is new in the
current study is that the correlation between the accretion rates and grain sizes breaks
down for
Ṁacc < 10-9 M⊙ yr-1,
suggesting that the turbulence required to sustain such accretion rates is insufficient
to support large grains against settling. We fit the relation between the average grain
size of the amorphous dust and the accretion rate with the following curve:
 Here,
Here,
 (in μm) is the average
size of amorphous silicates in the warmer disk regions, and
Ṁacc is the accretion rate
in M⊙ yr-1.
(in μm) is the average
size of amorphous silicates in the warmer disk regions, and
Ṁacc is the accretion rate
in M⊙ yr-1.
In Fig. 14, disks in younger MBM 12 show more
processed dust grains than those in relatively older η Cha. Since
younger disks tend to show more processed dust grains, we cannot explain the positive
correlation between as a global effect of disk evolution. We
would expect older disks to show bigger dust grains because dust grains are expected to
grow with disk evolution.
Figure 15 shows the mass fraction of crystalline material in the “warmer” and “colder” disk regions versus the effective temperatures of the central stars for our sample of cool T Tauri stars. We use the Kendall τ test to evaluate any possible correlation between both quantities, which yields τ = −0.25 and p = 0.07 for the warm disk part (panel a in Fig. 15), and τ = 0.19 and p = 0.19 for the cooler disk part (panel b in Fig. 15). Thus there is no significant correlation between the mass fraction of crystalline silicates in the disk and the stellar effective temperature for cool T Tauri stars.
In Fig. 16, we plot the crystallinity of the disk material against the mass accretion rates. Once again, we run the Kendall τ test, and find essentially no significant correlation in the warm disk regions (τ = −0.27, p = 0.10) and the colder parts of the disks (τ = −0.02, p = 0.88). Glauser et al. (2009) suggested that irradiation of dust grains by energetic ions from the stellar winds of young stars can amorphize the surface layer of the protoplanetary dust very efficiently, thus erasing any correlation between crystalline mass fraction and stellar parameters, such as bolometric luminosity, effective temperature, accretion rate, or disk geometry. Ábrahám et al. (2009) discovered that episodes of increased accretion may create new crystals. If strongly variable accretion is characteristic of T Tauri stars, as suggested by, e.g. Murphy et al. (2011) and Fang et al. (2012b), this may also account for the lack of obvious correlations between any disk or stellar properties and crystallinity of the dust in the disk surface.
 |
Fig. 16 The mass fractions of crystalline silicates plotted versus the accretion rates of the central objects. Panel a) shows the crystallinities as derived from the 7–17 μm part of the IRS spectra, panel b) shows the same quantity derived in the 17–37 μm spectral region. The symbols are identical to those in Fig. 14. |
4. Summary
We have studied the members of the ϵ Cha association, focusing on the properties of the central stars and their circumstellar disks. We used a combination of available archive data, our own Spitzer spectroscopy, and VLT/VISIR imaging data.
Using proper motions, we confirm the membership of most studied stars but question the membership of stars CXOU J120152.8 (ID#9) and 2MASS J12074597(ID#12). We estimated the masses and ages of the ϵ Cha members and find HD 104237C to be a sub-stellar object with a very low mass of 13–15 MJup, putting it at the boundary between brown dwarfs and “free-floating planets”.
The object 2MASS J12014343 (ID#11) is unusually faint at optical wavelengths and also shows exceptionally large EWs of some optical emission lines and an exceptionally strong infrared excess. Similar objects have been discovered in other star-forming regions. We tentatively explain this behavior with a flared disk seen at moderately high inclination in which the cold outer disk regions cause sufficient extinction to effectively screen the central star, which is then seen mostly in scattered light, but allow most of the infrared light from the warm disk regions to pass. The protoplanetary disks surrounding the cool stars USNO-B120144.7 and 2MASS J12005517 show evidence of a reduced height of the optically thick disk due to dust settling. The disk around HD 104237E shows evidence of partial dissipation in its inner part, while its outer disk remains essentially intact.
We found that both disk frequency and accretor frequency in the ϵ Cha association are higher than those in relatively dense clusters of similar age. Five other sparse stellar associations for which data are available in the literature also show comparatively high disk frequencies. Disk evolutions appears to proceed substantially more slowly in sparse associations compared to denser environments. In addition, the disk frequencies in sparse associations are almost constant at ages less than ~4 Myr.
The 13.7 μm rovibrational band of C2H2 is detected in the IRS spectrum of USNO-B120144.7.
We derive the mineralogical composition and grain size distribution of the (sub-) micron-sized dust in the disk atmosphere using the TLTD method. We find that the average grain sizes and fractions of crystalline material are higher in the warm inner disk regions that dominate the short wavelength part of the IRS spectra compared to cooler regions at a longer distance from the central star that contribute mostly to the longer wavelength range covered by the IRS. We also find that the average sizes of amorphous grains in the warm inner disk regions show a positive correlation with the accretion rates if the latter is higher than ~10-9 M⊙ yr-1.
The uncertainties in disk frequencies for small samples are all estimated in the manner described by Burgasser et al. (2003).
Acknowledgments
Many thanks to V. Roccatagliata for the useful discussions on this paper and to the anonymous referee for comments that help to improve this paper. M.F. acknowledges the support by NSFC through grants 11203081, 10733030 and 11173060. A.S.A. acknowledges support from the “Ramon y Cajal” Program from the Spanish MICINN/MINECO. This research has made use of the SIMBAD database, operated at CDS, Strasbourg, France. This publication makes use of data products from the Two Micron All Sky Survey, which is a joint project of the University of Massachusetts and the Infrared Processing and Analysis Center/California Institute of Technology, funded by the National Aeronautics and Space Administration and the National Science Foundation. This publication makes use of data products from the Wide-field Infrared Survey Explorer, which is a joint project of the University of California, Los Angeles, and the Jet Propulsion Laboratory/California Institute of Technology, funded by the National Aeronautics and Space Administration. This research is based on observations with AKARI, a JAXA project with the participation of ESA. This work is in part based on observations made with the Spitzer Space Telescope, which is operated by the Jet Propulsion Laboratory, California Institute of Technology under a contract with NASA.
References
- Ábrahám, P., Juhász, A., Dullemond, C. P., et al. 2009, Nature, 459, 224 [NASA ADS] [CrossRef] [PubMed] [Google Scholar]
- Allen, T. S., Pipher, J. L., Gutermuth, R. A., et al. 2008, ApJ, 675, 491 [NASA ADS] [CrossRef] [Google Scholar]
- Apai, D., Pascucci, I., Bouwman, J., et al. 2005, Science, 310, 834 [NASA ADS] [CrossRef] [PubMed] [Google Scholar]
- Baraffe, I., Chabrier, G., Allard, F., & Hauschildt, P. H. 1998, A&A, 337, 403 [NASA ADS] [Google Scholar]
- Barrado y Navascués, D., Stauffer, J. R., Morales-Calderón, M., et al. 2007, ApJ, 664, 481 [NASA ADS] [CrossRef] [Google Scholar]
- Bouwman, J., Meeus, G., de Koter, A., et al. 2001, A&A, 375, 950 [NASA ADS] [CrossRef] [EDP Sciences] [Google Scholar]
- Bouwman, J., de Koter, A., Dominik, C., & Waters, L. B. F. M. 2003, A&A, 401, 577 [NASA ADS] [CrossRef] [EDP Sciences] [Google Scholar]
- Bouwman, J., Lawson, W. A., Dominik, C., et al. 2006, ApJ, 653, L57 [NASA ADS] [CrossRef] [Google Scholar]
- Bouwman, J., Henning, T., Hillenbrand, L. A., et al. 2008, ApJ, 683, 479 [NASA ADS] [CrossRef] [Google Scholar]
- Briceño, C., Luhman, K. L., Hartmann, L., Stauffer, J. R., & Kirkpatrick, J. D. 2002, ApJ, 580, 317 [NASA ADS] [CrossRef] [Google Scholar]
- Briceño, C., Calvet, N., Hernández, J., et al. 2005, AJ, 129, 907 [NASA ADS] [CrossRef] [Google Scholar]
- Briceño, C., Hartmann, L., Hernández, J., et al. 2007, ApJ, 661, 1119 [NASA ADS] [CrossRef] [Google Scholar]
- Burgasser, A. J., Kirkpatrick, J. D., Reid, I. N., et al. 2003, ApJ, 586, 512 [NASA ADS] [CrossRef] [Google Scholar]
- Cardelli, J. A., Clayton, G. C., & Mathis, J. S. 1989, ApJ, 345, 245 [NASA ADS] [CrossRef] [Google Scholar]
- Carpenter, J. M., Mamajek, E. E., Hillenbrand, L. A., & Meyer, M. R. 2006, ApJ, 651, L49 [NASA ADS] [CrossRef] [Google Scholar]
- Chabrier, G., Baraffe, I., Allard, F., & Hauschildt, P. 2000, ApJ, 542, 464 [NASA ADS] [CrossRef] [Google Scholar]
- Chiang, E. I., & Goldreich, P. 1997, ApJ, 490, 368 [NASA ADS] [CrossRef] [Google Scholar]
- Cohen, M., & Witteborn, F. C. 1985, ApJ, 294, 345 [NASA ADS] [CrossRef] [Google Scholar]
- Comerón, F., Fernández, M., Baraffe, I., Neuhäuser, R., & Kaas, A. A. 2003, A&A, 406, 1001 [NASA ADS] [CrossRef] [EDP Sciences] [Google Scholar]
- Currie, T., & Kenyon, S. J. 2009, AJ, 138, 703 [NASA ADS] [CrossRef] [Google Scholar]
- Currie, T., & Sicilia-Aguilar, A. 2011, ApJ, 732, 24 [NASA ADS] [CrossRef] [Google Scholar]
- Currie, T., Lada, C. J., Plavchan, P., et al. 2009, ApJ, 698, 1 [NASA ADS] [CrossRef] [Google Scholar]
- Dorschner, J., Begemann, B., Henning, T., Jaeger, C., & Mutschke, H. 1995, A&A, 300, 503 [NASA ADS] [Google Scholar]
- Dotter, A., Chaboyer, B., Jevremović, D., et al. 2008, ApJS, 178, 89 [NASA ADS] [CrossRef] [Google Scholar]
- Dullemond, C. P., & Dominik, C. 2004, A&A, 417, 159 [NASA ADS] [CrossRef] [EDP Sciences] [Google Scholar]
- Epchtein, N., de Batz, B., Capoani, L., et al. 1997, The Messenger, 87, 27 [NASA ADS] [Google Scholar]
- Fang, M., van Boekel, R., Wang, W., et al. 2009, A&A, 504, 461 [NASA ADS] [CrossRef] [EDP Sciences] [Google Scholar]
- Fang, M., van Boekel, R., King, R. R., et al. 2012a, A&A, 539, A119 [NASA ADS] [CrossRef] [EDP Sciences] [Google Scholar]
- Fang, M., et al. 2012b, ApJS, submitted [Google Scholar]
- Fazio, G. G., Hora, J. L., Allen, L. E., et al. 2004, ApJS, 154, 10 [NASA ADS] [CrossRef] [Google Scholar]
- Fedele, D., van den Ancker, M. E., Henning, T., Jayawardhana, R., & Oliveira, J. M. 2010, A&A, 510, A72 [NASA ADS] [CrossRef] [EDP Sciences] [Google Scholar]
- Feigelson, E. D., Lawson, W. A., & Garmire, G. P. 2003, ApJ, 599, 1207 [NASA ADS] [CrossRef] [Google Scholar]
- Flaccomio, E., Micela, G., & Sciortino, S. 2006, A&A, 455, 903 [NASA ADS] [CrossRef] [EDP Sciences] [Google Scholar]
- Gauvin, L. S., & Strom, K. M. 1992, ApJ, 385, 217 [NASA ADS] [CrossRef] [Google Scholar]
- Glauser, A. M., Güdel, M., Watson, D. M., et al. 2009, A&A, 508, 247 [NASA ADS] [CrossRef] [EDP Sciences] [Google Scholar]
- Grady, C. A., Woodgate, B., Torres, C. A. O., et al. 2004, ApJ, 608, 809 [NASA ADS] [CrossRef] [Google Scholar]
- Gullbring, E., Hartmann, L., Briceno, C., & Calvet, N. 1998, ApJ, 492, 323 [NASA ADS] [CrossRef] [Google Scholar]
- Hartmann, L., Calvet, N., Gullbring, E., & D’Alessio, P. 1998, ApJ, 495, 385 [NASA ADS] [CrossRef] [Google Scholar]
- Henning, T. 2010, ARA&A, 48, 21 [NASA ADS] [CrossRef] [Google Scholar]
- Henning, T., & Mutschke, H. 1997, A&A, 327, 743 [NASA ADS] [Google Scholar]
- Herbig, G. H., & Dahm, S. E. 2006, AJ, 131, 1530 [NASA ADS] [CrossRef] [Google Scholar]
- Hernández, J., Calvet, N., Briceño, C., et al. 2007, ApJ, 671, 1784 [NASA ADS] [CrossRef] [Google Scholar]
- Hernández, J., Morales-Calderon, M., Calvet, N., et al. 2010, ApJ, 722, 1226 [NASA ADS] [CrossRef] [Google Scholar]
- Higdon, S. J. U., Devost, D., Higdon, J. L., et al. 2004, PASP, 116, 975 [NASA ADS] [CrossRef] [Google Scholar]
- Høg, E., Fabricius, C., Makarov, V. V., et al. 2000, A&A, 355, L27 [NASA ADS] [Google Scholar]
- Houck, J. R., Roellig, T. L., van Cleve, J., et al. 2004, ApJS, 154, 18 [NASA ADS] [CrossRef] [Google Scholar]
- Hughes, J., Hartigan, P., Krautter, J., & Kelemen, J. 1994, AJ, 108, 1071 [NASA ADS] [CrossRef] [Google Scholar]
- Ishihara, D., Onaka, T., Kataza, H., et al. 2010, A&A, 514, A1 [NASA ADS] [CrossRef] [EDP Sciences] [Google Scholar]
- Jäger, C., Molster, F. J., Dorschner, J., et al. 1998, A&A, 339, 904 [NASA ADS] [Google Scholar]
- Jayawardhana, R., Hartmann, L., Fazio, G., et al. 1999, ApJ, 521, L129 [NASA ADS] [CrossRef] [Google Scholar]
- Juhász, A., Henning, T., Bouwman, J., et al. 2009, ApJ, 695, 1024 [NASA ADS] [CrossRef] [Google Scholar]
- Juhász, A., Bouwman, J., Henning, T., et al. 2010, ApJ, 721, 431 [NASA ADS] [CrossRef] [Google Scholar]
- Kennedy, G. M., & Kenyon, S. J. 2009, ApJ, 695, 1210 [NASA ADS] [CrossRef] [Google Scholar]
- Kenyon, S. J., & Hartmann, L. 1995, ApJS, 101, 117 [NASA ADS] [CrossRef] [Google Scholar]
- Kessler-Silacci, J., Augereau, J., Dullemond, C. P., et al. 2006, ApJ, 639, 275 [NASA ADS] [CrossRef] [Google Scholar]
- Kraus, A. L., Ireland, M. J., Hillenbrand, L. A., & Martinache, F. 2012, ApJ, 745, 19 [NASA ADS] [CrossRef] [Google Scholar]
- Lada, C. J., Muench, A. A., Luhman, K. L., et al. 2006, AJ, 131, 1574 [NASA ADS] [CrossRef] [Google Scholar]
- Lahuis, F., & Boogert, A. 2003, in SFChem 2002: Chemistry as a Diagnostic of Star Formation, eds. C. L. Curry, & M. Fich, 335 [Google Scholar]
- Lawson, W. A., Lyo, A., & Bessell, M. S. 2009, MNRAS, 400, L29 [NASA ADS] [CrossRef] [Google Scholar]
- Looper, D. L., Burgasser, A. J., Kirkpatrick, J. D., & Swift, B. J. 2007, ApJ, 669, L97 [NASA ADS] [CrossRef] [Google Scholar]
- Looper, D. L., Bochanski, J. J., Burgasser, A. J., et al. 2010a, AJ, 140, 1486 [NASA ADS] [CrossRef] [Google Scholar]
- Looper, D. L., Mohanty, S., Bochanski, J. J., et al. 2010b, ApJ, 714, 45 [NASA ADS] [CrossRef] [Google Scholar]
- Luhman, K. L. 2004, ApJ, 616, 1033 [NASA ADS] [CrossRef] [Google Scholar]
- Luhman, K. L. 2007, ApJS, 173, 104 [NASA ADS] [CrossRef] [Google Scholar]
- Luhman, K. L., & Steeghs, D. 2004, ApJ, 609, 917 [NASA ADS] [CrossRef] [Google Scholar]
- Luhman, K. L., Stauffer, J. R., Muench, A. A., et al. 2003, ApJ, 593, 1093 [NASA ADS] [CrossRef] [Google Scholar]
- Luhman, K. L., Allen, L. E., Allen, P. R., et al. 2008a, ApJ, 675, 1375 [NASA ADS] [CrossRef] [Google Scholar]
- Luhman, K. L., Hernández, J., Downes, J. J., Hartmann, L., & Briceño, C. 2008b, ApJ, 688, 362 [NASA ADS] [CrossRef] [Google Scholar]
- Luhman, K. L., Allen, P. R., Espaillat, C., Hartmann, L., & Calvet, N. 2010, ApJS, 186, 111 [NASA ADS] [CrossRef] [Google Scholar]
- Lyo, A., Lawson, W. A., & Bessell, M. S. 2008, MNRAS, 389, 1461 [NASA ADS] [CrossRef] [Google Scholar]
- Mamajek, E. E. 2005, ApJ, 634, 1385 [NASA ADS] [CrossRef] [Google Scholar]
- Mamajek, E. E., Lawson, W. A., & Feigelson, E. D. 1999, ApJ, 516, L77 [NASA ADS] [CrossRef] [Google Scholar]
- Manoj, P., Kim, K. H., Furlan, E., et al. 2011, ApJS, 193, 11 [NASA ADS] [CrossRef] [Google Scholar]
- Meeus, G., Juhász, A., Henning, T., et al. 2009, A&A, 497, 379 [NASA ADS] [CrossRef] [EDP Sciences] [Google Scholar]
- Megeath, S. T., Hartmann, L., Luhman, K. L., & Fazio, G. G. 2005, ApJ, 634, L113 [NASA ADS] [CrossRef] [Google Scholar]
- Men’shchikov, A. B., & Henning, T. 1997, A&A, 318, 879 [NASA ADS] [Google Scholar]
- Mercer, E. P., Miller, J. M., Calvet, N., et al. 2009, AJ, 138, 7 [NASA ADS] [CrossRef] [Google Scholar]
- Merín, B., Brown, J. M., Oliveira, I., et al. 2010, ApJ, 718, 1200 [NASA ADS] [CrossRef] [Google Scholar]
- Moitinho, A., Alves, J., Huélamo, N., & Lada, C. J. 2001, ApJ, 563, L73 [NASA ADS] [CrossRef] [Google Scholar]
- Muench, A. A., Lada, C. J., Luhman, K. L., Muzerolle, J., & Young, E. 2007, AJ, 134, 411 [NASA ADS] [CrossRef] [Google Scholar]
- Murphy, S. J., Lawson, W. A., & Bessell, M. S. 2010, MNRAS, 406, L50 [NASA ADS] [Google Scholar]
- Murphy, S. J., Lawson, W. A., Bessell, M. S., & Bayliss, D. D. R. 2011, MNRAS, 411, L51 [NASA ADS] [CrossRef] [Google Scholar]
- Muzerolle, J., Calvet, N., & Hartmann, L. 1998, ApJ, 492, 743 [NASA ADS] [CrossRef] [Google Scholar]
- Natta, A., Meyer, M. R., & Beckwith, S. V. W. 2000, ApJ, 534, 838 [NASA ADS] [CrossRef] [Google Scholar]
- Olofsson, J., Augereau, J., van Dishoeck, E. F., et al. 2009, A&A, 507, 327 [NASA ADS] [CrossRef] [EDP Sciences] [Google Scholar]
- Olofsson, J., Augereau, J., van Dishoeck, E. F., et al. 2010, A&A, 520, A39 [NASA ADS] [CrossRef] [EDP Sciences] [Google Scholar]
- Pascucci, I., Apai, D., Luhman, K., et al. 2009, ApJ, 696, 143 [NASA ADS] [CrossRef] [Google Scholar]
- Preibisch, T., Brown, A. G. A., Bridges, T., Guenther, E., & Zinnecker, H. 2002, AJ, 124, 404 [NASA ADS] [CrossRef] [Google Scholar]
- Riaz, B., & Gizis, J. E. 2008, ApJ, 681, 1584 [NASA ADS] [CrossRef] [Google Scholar]
- Rieke, G. H., Young, E. T., Engelbracht, C. W., et al. 2004, ApJS, 154, 25 [NASA ADS] [CrossRef] [Google Scholar]
- Rochau, B., Brandner, W., Stolte, A., et al. 2010, ApJ, 716, L90 [NASA ADS] [CrossRef] [Google Scholar]
- Röser, S., Demleitner, M., & Schilbach, E. 2010, AJ, 139, 2440 [NASA ADS] [CrossRef] [Google Scholar]
- Servoin, J. L., & Piriou, B. 1973, phys. stat. sol., 55, 677 [Google Scholar]
- Sherry, W. H., Walter, F. M., & Wolk, S. J. 2004, AJ, 128, 2316 [NASA ADS] [CrossRef] [Google Scholar]
- Sicilia-Aguilar, A., Hartmann, L. W., Hernández, J., Briceño, C., & Calvet, N. 2005, AJ, 130, 188 [NASA ADS] [CrossRef] [Google Scholar]
- Sicilia-Aguilar, A., Hartmann, L., Calvet, N., et al. 2006, ApJ, 638, 897 [NASA ADS] [CrossRef] [Google Scholar]
- Sicilia-Aguilar, A., Hartmann, L. W., Watson, D., et al. 2007, ApJ, 659, 1637 [NASA ADS] [CrossRef] [Google Scholar]
- Sicilia-Aguilar, A., Henning, T., Juhász, A., et al. 2008, ApJ, 687, 1145 [NASA ADS] [CrossRef] [Google Scholar]
- Sicilia-Aguilar, A., Bouwman, J., Juhász, A., et al. 2009, ApJ, 701, 1188 [NASA ADS] [CrossRef] [Google Scholar]
- Sicilia-Aguilar, A., Henning, T., Dullemond, C. P., et al. 2011a, ApJ, 742, 39 [NASA ADS] [CrossRef] [Google Scholar]
- Sicilia-Aguilar, A., Henning, T., Kainulainen, J., & Roccatagliata, V. 2011b, ApJ, 736, 137 [NASA ADS] [CrossRef] [Google Scholar]
- Skrutskie, M. F., Cutri, R. M., Stiening, R., et al. 2006, AJ, 131, 1163 [NASA ADS] [CrossRef] [Google Scholar]
- Spezzi, L., Alcalá, J. M., Covino, E., et al. 2008, ApJ, 680, 1295 [NASA ADS] [CrossRef] [Google Scholar]
- Sung, H., Stauffer, J. R., & Bessell, M. S. 2009, AJ, 138, 1116 [NASA ADS] [CrossRef] [Google Scholar]
- Torres, C. A. O., Quast, G. R., Melo, C. H. F., & Sterzik, M. F. 2008, Young Nearby Loose Associations, ed. B. Reipurth, 757 [Google Scholar]
- van Boekel, R., Min, M., Leinert, C., et al. 2004, Nature, 432, 479 [NASA ADS] [CrossRef] [PubMed] [Google Scholar]
- van Boekel, R., Min, M., Waters, L. B. F. M., et al. 2005, A&A, 437, 189 [NASA ADS] [CrossRef] [EDP Sciences] [Google Scholar]
- Wahhaj, Z., Cieza, L., Koerner, D. W., et al. 2010, ApJ, 724, 835 [NASA ADS] [CrossRef] [Google Scholar]
- Webb, R. A., Zuckerman, B., Platais, I., et al. 1999, ApJ, 512, L63 [NASA ADS] [CrossRef] [Google Scholar]
- Weise, P., Launhardt, R., Setiawan, J., & Henning, T. 2010, A&A, 517, A88 [NASA ADS] [CrossRef] [EDP Sciences] [Google Scholar]
- White, R. J., & Hillenbrand, L. A. 2004, ApJ, 616, 998 [NASA ADS] [CrossRef] [Google Scholar]
- Wright, E. L., Eisenhardt, P. R. M., Mainzer, A. K., et al. 2010, AJ, 140, 1868 [NASA ADS] [CrossRef] [Google Scholar]
- Yamamura, I., Makiuti, S., Ikeda, N., et al. 2010, VizieR Online Data Catalog, II/298 [Google Scholar]
- Zsom, A., Ormel, C. W., Dullemond, C. P., & Henning, T. 2011, A&A, 534, A73 [NASA ADS] [CrossRef] [EDP Sciences] [Google Scholar]
Appendix A: The disk frequencies in star-formation regions
Fractions of YSO with excess emission at wavelengths less than ~8 μm in different SFRs.
In Table A.1, we list each star-formation region (SFR) used in Fig. 9. In total, 16 SFRs are included with median ages ranging from ~1.5 to ~13 Myr. Most of the SFRs in the tables have an age estimate using the PMS evolutionary tracks from Baraffe et al. (1998) in the literature. The references for these ages are also listed in the table. The 5 SFRs, i.e., ϵ Cha, TW Hya, L988e, Tr 37, and NGC 7160, are without ages estimated from the tracks of Baraffe et al. (1998). We estimate their ages using these tracks with a mixing length parameter l/HP = 1. In Table A.1, we give the disk frequency for each SFR as well as the references. We corrected these disk frequencies by removing the transitional disk objects that only show excess emission at wavelengths longer than 8 μm. For the disk frequencies estimated in this work, we distinguish the disk population from diskless ones using the SED slope criteria from Lada et al. (2006). The disk frequencies in the sparse stellar association, MBM 12, ϵ Cha, η Cha, and TW Hya tend to be systematically above those of the other SFRs with similar ages.
MBM 12. In this association, there are 12 known members with K to M
spectral types. Among these, eight objects (MBM 12-1,2,3,4,5,6,10,12) were detected by the
Spitzer/IRS, and seven objects show evidence for a circumstellar disk
(MBM 12-2,3,4,5,6,10,12). Three of the seven objects are suggested to be transition disk
candidates (Meeus et al. 2009). In the recently
published catalog from the Wide-field Infrared Survey Explorer (WISE, Wright et al. 2010) the four objects lacking IRS
spectra (MBM12-7,8,9,11) are detected in three photometric bands of WISE: W1
(3.4 μm), W2 (4.6 μm), and W3 (12 μm)
bands. With the new infrared photometry, we identify only MBM12-9 (see Fig. A.1) as having an IR excess at 12 μm,
whereas the other three sources have WISE fluxes consistent with the stellar photospheric
emission. The object MBM12-8 shows strong Hα emission
(EWHα = −120 Å),
pointing at active accretion. However it shows no excess emission at
12 μm and shorter wavelengths, which indicates that the warm inner disk
regions have already dissipated. Possibly this is a transition disk object with a large
opacity hole in the inner disk, where some gas is still present. This allows accretion to
proceed. Observations at longer wavelengths are needed to confirm the transition disk
nature of MBM12-8. For the time being, we do not consider the object to have a confirmed
circumstellar disk. Thus, the disk frequency for all known members in MBM 12 is
~ % (8/12), while for members with masses of
0.1–0.6 M⊙, it is
~
% (8/12), while for members with masses of
0.1–0.6 M⊙, it is
~ % (6/9).
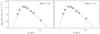 |
Fig. A.1 SEDs of two stars in MBM 12 associations. The photospheric emission level is indicated with a grey dashed curve in each panel. The open circles show the photometry in different bands. |
Stellar and disk properties for young stellar objects.
η Cha. In the η Cha association, 18
members have been observed with Spitzer. The disk frequency is estimated
to be ~ % (8/18) (Megeath et al. 2005; Sicilia-Aguilar et al.
2009). The sources RECX-3 and RECX-4 only show excess emission at wavelengths
longer than 10 μm. In this work, we restrict our disk census to the
Spitzer IRAC bands, thus excluding the two sources when calculating the
disk fraction in η Cha. Murphy et al.
(2010) proposed that seven candidate low-mass members of η Cha
comprise a halo surrounding the cluster core. Two of these may have disks that are
actively accreting, as indicated by their Hα emission (Murphy et al. 2010). We have found all seven objects in
the WISE catalogue. Only one of these (J08202975-8003259) shows excess emission in the
WISE data (see Fig. A.2). The source
2MASS J08014860-8058052 does not show clear excess emission at wavelengths up to
22 μm (see Fig. A.2). Thus, we
presently consider a possible disk around the latter object to be confirmed. Including the
seven new members, the disk frequency of η Cha is
~
% (8/18) (Megeath et al. 2005; Sicilia-Aguilar et al.
2009). The sources RECX-3 and RECX-4 only show excess emission at wavelengths
longer than 10 μm. In this work, we restrict our disk census to the
Spitzer IRAC bands, thus excluding the two sources when calculating the
disk fraction in η Cha. Murphy et al.
(2010) proposed that seven candidate low-mass members of η Cha
comprise a halo surrounding the cluster core. Two of these may have disks that are
actively accreting, as indicated by their Hα emission (Murphy et al. 2010). We have found all seven objects in
the WISE catalogue. Only one of these (J08202975-8003259) shows excess emission in the
WISE data (see Fig. A.2). The source
2MASS J08014860-8058052 does not show clear excess emission at wavelengths up to
22 μm (see Fig. A.2). Thus, we
presently consider a possible disk around the latter object to be confirmed. Including the
seven new members, the disk frequency of η Cha is
~ % (7/25). For the members with masses of
0.1–0.6 M⊙, the disk frequency is
~
% (7/25). For the members with masses of
0.1–0.6 M⊙, the disk frequency is
~ (6/19).
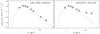 |
Fig. A.2 SEDs of two stars in the η Cha association. The photospheric emission level is indicated with a grey dashed curve in each panel. The open circles show the photometry in different bands. |
TW Hya. To estimate the disk frequency of this
association, we first constructed a catalog of members of this group. Our catalog is based
on the TW Hya membership criteria as refined by Mamajek
(2005), and includes TWA-1, 2A, 2B, 3A, 3B, 4, 5A, 5B, 6, 7, 8A, 8B, 9A, 9B, 10,
11A, 11B, 13A, 13B, 14, 15A, 15B, 16, 20, 21, 23, 25, 26, 27, 28, plus new identified
members TWA-29 30A, 30B (Looper et al. 2007, 2010a,b). Among
these members, TWA-1, 3A, 4, 7, 11A, 27, 28, and 30B show evidence for disks with excess
emission at wavelengths shorter than 8 μm (Jayawardhana et al. 1999; Riaz &
Gizis 2008; Looper et al. 2010a,b). TWA-30A may harbor a disk because its optical and
infrared spectra show emission lines due to accretion activity (Looper et al. 2010a). However, there is no infrared data to suggest
whether TWA-30A shows excess emission at wavelengths shorter than 8 μm.
Thus, we do not count this source when calculating the disk fraction in TW Hya. The disk
frequency for all known members is estimated to be
~ %(8/32), and the disk frequency for members
with masses of 0.1–0.6 M⊙ is
~
%(8/32), and the disk frequency for members
with masses of 0.1–0.6 M⊙ is
~ % (3/16).
Appendix B: The dust properties around M-type PMS stars in other regions
In Table B.1, we list the targets used in Figs. 13–16. The total luminosity, extinction, and accretion rate listed here for each object are derived using the procedure described in Sect. 2.1 and in Fang et al. (2009). The stellar masses and ages are estimated by comparison to theoretical PMS evolutionary tracks from Dotter et al. (2008). We collected the dust properties for each disk from the literature (Sicilia-Aguilar et al. 2008, 2009; Meeus et al. 2009; Olofsson et al. 2010). These include the average sizes of amorphous and crystalline silicate grains, along with the mass fractions of crystalline silicate grains, and were derived using either the same TLTD method that we used for the analysis of the spectra of ϵ Cha members (as described in Sect. 2.3) or the B2C method, which is similar to the TLTD method.
All Tables
Fractions of YSO with excess emission at wavelengths less than ~8 μm in different SFRs.
All Figures
|
Fig. 1 VLT/VISIR image of the HD 104237 region taken through the SIC filter, on a square root scaling from –0.1% to +6.5% of the peak flux of the HD 104237A component. The position of the HD 104237D component is indicated with a circle, but there is no significant detection of this source. Coordinates are offsets in arcseconds with respect to HD 104237A. |
| In the text | |
|
Fig. 2 Proper motions of known stars in the ϵ Cha association taken from the catalog by Röser et al. (2010). The mean proper motion of the members and the 1 and 2σ ellipses of the standard deviation of the distribution are shown with dashed-line and dotted-line curves, respectively. |
| In the text | |
|
Fig. 3 HR diagram of members (filled circles) of ϵ Cha. The open diamond marks the underluminous object ID#11. The grey lines are PMS isochrones of 1, 3, 10, and 100 Myr, and the dark line is the PMS isochrone of 4 Myr (Dotter et al. 2008). The dashed lines are the PMS evolutionary tracks for individual masses. The open circles are for stars ID#9 and 12, which have proper motions that deviate from the other stars. |
| In the text | |
|
Fig. 4 Observed photometry (filled circles) and model photometry (open circles) for HD 104237C in the J, H, and Ks bands. Panel a) shows model photometry for a 13 MJup brown dwarf with an age of 3 Myr, panel b) shows a model of a 15.2 MJup object of 5 Myr. The model photometry was adopted from Chabrier et al. (2000). |
| In the text | |
|
Fig. 5 SEDs of apparently diskless stars. The photospheric emission level is indicated with a dotted curve in each panel. The circles show the photometry in different bands. The filled circle show the upper limit derived from our VLT/VISIR imaging for ID#6. The thick grey solid lines in panels a, b, d and e show the Spitzer/IRS spectra. |
| In the text | |
|
Fig. 6 SEDs of the disk population in ϵ Cha. The photospheric emission level is indicated with a grey dotted curve in each panel. The circles show the photometry in various bands. The filled circles show the photometry from our VLT/VISIR imaging. The solid line shows the IRS spectrum in each panel. The dashed line in each panel represents the calculated SED of a flaring disk model, and the dash-dotted line shows the calculated SED of a flattened disk model. |
| In the text | |
|
Fig. 7 Optical spectrum and SED of 2MASS J12014343 (ID#11). a) The optical spectrum of source ID#11 (black line) and of a similarly underluminous object in L1641 (L1641-ID#122, grey line, Fang et al. 2009). b) The SED of source ID#11. The photospheric emission level is indicated with a grey solid curve. The open circles show the broad-band photometry of ID#11, and the IRS spectrum of this source is shown in black. The photometry of underluminous source L1641-ID#122 is depicted with the open squares connected by dashed line for comparison and shows striking resemblance to that of ID#11 at mid-infrared wavelengths. The dash-dotted line presents the median SED of the distributed disk population in L1641 (Fang et al. 2009). |
| In the text | |
|
Fig. 8 SED of the source ID#11. The open circles show the broad-band photometry of ID#11, and the IRS spectrum of this source is shown in black. The dashed lines marked by numbers 1–5 show model SEDs for a same model disk with different inclination angles. From model 1 to model 5, the inclination angles are 83°, 84°, 84.5°, 85°, and 86°, respectively. In the model, we added a few small dust grains to the hole of the disk. The model with disk inclination ~84.5° best fits the SED of ID#11. The dash-dotted line shows the model SED for a disk (inclination angle ~84°) without small dust grains in the disk hole. The model SED generally fits the shape of the observed SED of ID#11, but fails to reproduce the observed silicate features. |
| In the text | |
|
Fig. 9 Disk frequencies for different clusters/star-formation regions plotted as a function of their ages, which are all estimated from Baraffe et al. (1998) (see Table A.1). In panel a) we plot the disk frequency among all known members, in panel b) we show only the low-mass (0.1–0.6 M⊙) population. The filled pentagram represents the sparse stellar associations, Taurus, CrA, MBM 12, ϵ Cha, η Cha, and TW Hya in panel a), and the sparse stellar associations, Taurus, MBM 12, ϵ Cha, η Cha, and TW Hya in panel b). The open circles show the disk frequencies in the compact clusters or the OB associations (see Appendix A for a detailed description). In each panel, the dashed line represents the best-fit exponential decay for all regions, excluding the sparse associations and the dash-dotted line represents the best-fit exponential decay for the sparse associations. |
| In the text | |
|
Fig. 10 The 10 μm silicate features fitted using the TLTD method (solid red lines). The observed spectra are represented as filled circles with the errors in grey. |
| In the text | |
|
Fig. 11 IRS spectra in the 17–37 μm range and spectral fits using the TLTD method. The observed spectra are represented as filled circles with the errors in grey, whereas the fits are shown in red. |
| In the text | |
|
Fig. 12 a) IRS spectrum of source ID#8. The positions of the C2H2 and HCN rovibrational bands are marked. b) IRS spectrum of the source ID#10. The dotted vertical lines mark the features of enstatite. c)–e): The mass absorption coefficients of enstatite and amorphous silicates (with olivine and pyroxene stoichiometry) with grain sizes of 0.1 μm (solid lines), 1.5 μm (dashed lines), and 6.0 μm (dash-dotted lines). The dotted lines in panels b), c) are identical. |
| In the text | |
|
Fig. 13 a) Comparison of the mass-averaged sizes of amorphous dust grains as derived from the shorter and longer wavelength part of the IRS spectra (indicated with “W” and “C” superscripts for “warm” and “cold” disk regions) of sources in ϵ Cha, MBM 12, η Cha, and the Coronet cluster, and the targets from Olofsson et al. (2010). The circles are for the targets in MBM 12, η Cha, and the Coronet cluster. The diamonds show the targets from Olofsson et al. (2010). The pentagram marks object ID#10 and 11 in ϵ Cha. b) Similar to a), but for mass-averaged sizes of crystalline dust grains. c) Comparison of the mass fraction of crystalline dust grains as derived from the shorter and longer wavelength part of the IRS spectra. The symbols are similar to panel a). |
| In the text | |
|
Fig. 14 The average sizes of amorphous grains plotted versus the accretion rate of the central stars. The grain sizes are derived in the warmer region of the IRS spectra. The filled symbols show the CTTSs, and the open symbols represent the WTTSs. The targets in MBM 12 are shown as circles, in η Cha as squares, and in the Coronet cluster as triangles. The diamonds show the targets from Olofsson et al. (2010). The pentagram marks object ID#10 in ϵ Cha. The thick dashed lines are the fit to the relation between the accretion rates and the grain sizes for Ṁacc > 10-9 M⊙ yr-1. |
| In the text | |
|
Fig. 15 The mass fractions of crystalline material compared to the effective temperature of the central stars (which correlates closely with the bolometric luminosity, see Fig. 3). The crystallinities are derived from the 7–17 μm part of the IRS spectra. b) similar to a), except that the crystallinities are derived from in 17–37 μm part of the IRS spectra. The symbols are identical to those in Fig. 14. |
| In the text | |
|
Fig. 16 The mass fractions of crystalline silicates plotted versus the accretion rates of the central objects. Panel a) shows the crystallinities as derived from the 7–17 μm part of the IRS spectra, panel b) shows the same quantity derived in the 17–37 μm spectral region. The symbols are identical to those in Fig. 14. |
| In the text | |
|
Fig. A.1 SEDs of two stars in MBM 12 associations. The photospheric emission level is indicated with a grey dashed curve in each panel. The open circles show the photometry in different bands. |
| In the text | |
|
Fig. A.2 SEDs of two stars in the η Cha association. The photospheric emission level is indicated with a grey dashed curve in each panel. The open circles show the photometry in different bands. |
| In the text | |
Current usage metrics show cumulative count of Article Views (full-text article views including HTML views, PDF and ePub downloads, according to the available data) and Abstracts Views on Vision4Press platform.
Data correspond to usage on the plateform after 2015. The current usage metrics is available 48-96 hours after online publication and is updated daily on week days.
Initial download of the metrics may take a while.