Fig. 14
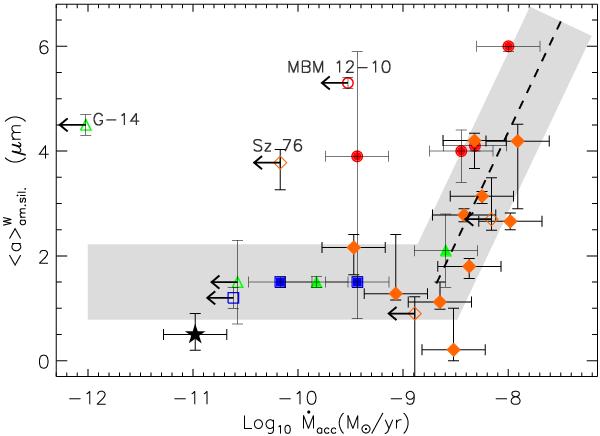
The average sizes of amorphous grains plotted versus the accretion rate of the central stars. The grain sizes are derived in the warmer region of the IRS spectra. The filled symbols show the CTTSs, and the open symbols represent the WTTSs. The targets in MBM 12 are shown as circles, in η Cha as squares, and in the Coronet cluster as triangles. The diamonds show the targets from Olofsson et al. (2010). The pentagram marks object ID#10 in ϵ Cha. The thick dashed lines are the fit to the relation between the accretion rates and the grain sizes for Ṁacc > 10-9 M⊙ yr-1.
Current usage metrics show cumulative count of Article Views (full-text article views including HTML views, PDF and ePub downloads, according to the available data) and Abstracts Views on Vision4Press platform.
Data correspond to usage on the plateform after 2015. The current usage metrics is available 48-96 hours after online publication and is updated daily on week days.
Initial download of the metrics may take a while.