Fig. 13
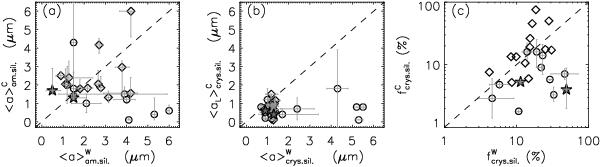
a) Comparison of the mass-averaged sizes of amorphous dust grains as derived from the shorter and longer wavelength part of the IRS spectra (indicated with “W” and “C” superscripts for “warm” and “cold” disk regions) of sources in ϵ Cha, MBM 12, η Cha, and the Coronet cluster, and the targets from Olofsson et al. (2010). The circles are for the targets in MBM 12, η Cha, and the Coronet cluster. The diamonds show the targets from Olofsson et al. (2010). The pentagram marks object ID#10 and 11 in ϵ Cha. b) Similar to a), but for mass-averaged sizes of crystalline dust grains. c) Comparison of the mass fraction of crystalline dust grains as derived from the shorter and longer wavelength part of the IRS spectra. The symbols are similar to panel a).
Current usage metrics show cumulative count of Article Views (full-text article views including HTML views, PDF and ePub downloads, according to the available data) and Abstracts Views on Vision4Press platform.
Data correspond to usage on the plateform after 2015. The current usage metrics is available 48-96 hours after online publication and is updated daily on week days.
Initial download of the metrics may take a while.