Fig. 7
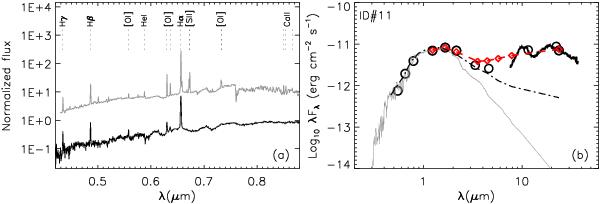
Optical spectrum and SED of 2MASS J12014343 (ID#11). a) The optical spectrum of source ID#11 (black line) and of a similarly underluminous object in L1641 (L1641-ID#122, grey line, Fang et al. 2009). b) The SED of source ID#11. The photospheric emission level is indicated with a grey solid curve. The open circles show the broad-band photometry of ID#11, and the IRS spectrum of this source is shown in black. The photometry of underluminous source L1641-ID#122 is depicted with the open squares connected by dashed line for comparison and shows striking resemblance to that of ID#11 at mid-infrared wavelengths. The dash-dotted line presents the median SED of the distributed disk population in L1641 (Fang et al. 2009).
Current usage metrics show cumulative count of Article Views (full-text article views including HTML views, PDF and ePub downloads, according to the available data) and Abstracts Views on Vision4Press platform.
Data correspond to usage on the plateform after 2015. The current usage metrics is available 48-96 hours after online publication and is updated daily on week days.
Initial download of the metrics may take a while.